| Param | Original file | Final file |
|---|---|---|
| Filename | modeM0/AS1A12_077T06_9000005474_39438cztM0_level2.fits | modeM0/AS1A12_077T06_9000005474_39438cztM0_level2_quad_clean.evt |
| Size (bytes) | 485,352,000 | 93,859,200 |
| Size | 462.9 MB | 89.5 MB |
| Events in quadrant A | 6,376,552 | 608,302 |
| Events in quadrant B | 3,051,233 | 665,122 |
| Events in quadrant C | 3,183,478 | 628,922 |
| Events in quadrant D | 4,893,567 | 524,771 |
| Mode M0 | |||
|---|---|---|---|
| Quadrant | BADHDUFLAG | Total packets | Discarded packets |
| A | 0 | 23029 | 3 |
| B | 0 | 13059 | 2 |
| C | 0 | 13046 | 2 |
| D | 0 | 18612 | 2 |
| Mode SS | |||
|---|---|---|---|
| Quadrant | BADHDUFLAG | Total packets | Discarded packets |
| A | 0 | 118 | 0 |
| B | 0 | 118 | 0 |
| C | 0 | 118 | 0 |
| D | 0 | 118 | 0 |
| Mode M9 | |||
|---|---|---|---|
| Quadrant | BADHDUFLAG | Total packets | Discarded packets |
| A | 0 | 25 | 0 |
| B | 0 | 25 | 0 |
| C | 0 | 25 | 0 |
| D | 0 | 26 | 0 |
| Quadrant | Total seconds | Saturated seconds | Saturation percentage |
|---|---|---|---|
| A | 5940 | 652 | 10.976431% |
| B | 5940 | 96 | 1.616162% |
| C | 5940 | 11 | 0.185185% |
| D | 5940 | 676 | 11.380471% |
Noise dominated data is calculated using 1-second bins in cleaned event files. If a bin has >2000 counts, and if more than 50% of those come from <1% of pixels, then it is considered to be noise-dominated and hence unusable.
| Quadrant | # 1 sec bins | Bins with >0 counts | Bins with >2000 counts | High rate bins dominated by noise | Noise dominated (total time) | Noise dominated (detector-on time) | Marked lightcurve |
|---|---|---|---|---|---|---|---|
| A | 7253 | 5941 | 620 | 620 | 8.55% | 10.44% | 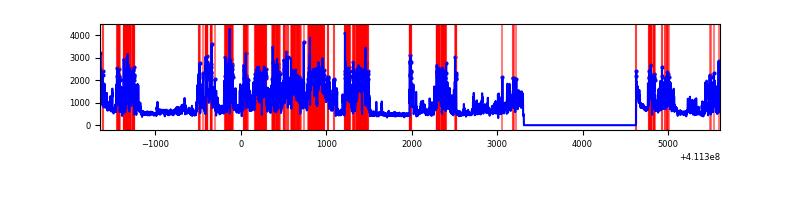 |
| B | 7253 | 5941 | 56 | 56 | 0.77% | 0.94% | 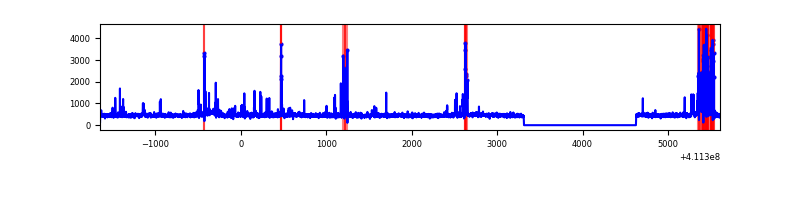 |
| C | 7253 | 5941 | 5 | 5 | 0.07% | 0.08% | 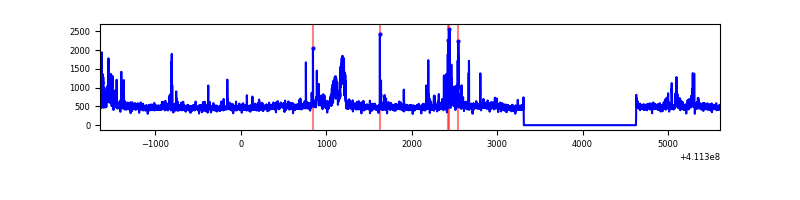 |
| D | 7253 | 5941 | 573 | 573 | 7.90% | 9.64% | 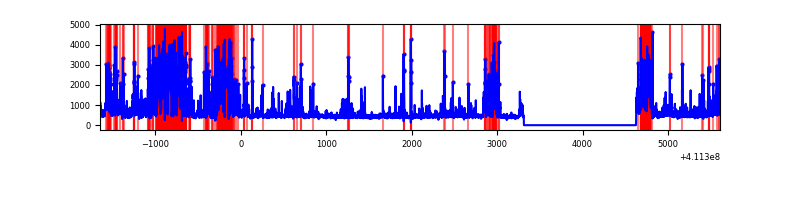 |
Top three noisy pixels from each quadrant. If the there are fewer than three noisy pixels in the level2.evt file, extra rows are filled as -1
| Pixel properties | Quadrant properties | ||||||
|---|---|---|---|---|---|---|---|
| Quadrant | DetID | PixID | Counts | Sigma | Mean | Median | Sigma |
| A | 15 | 222 | 3315634 | 24696.32 | 649 | 636 | 134.2 |
| A | 10 | 83 | 485194 | 3609.9 | 649 | 636 | 134.2 |
| A | 9 | 143 | 37131 | 271.88 | 649 | 636 | 134.2 |
| B | 5 | 172 | 256668 | 1998.33 | 654 | 635 | 128.1 |
| B | 8 | 3 | 99731 | 773.44 | 654 | 635 | 128.1 |
| B | 5 | 255 | 95543 | 740.76 | 654 | 635 | 128.1 |
| C | 15 | 214 | 247510 | 1635.85 | 642 | 646 | 150.9 |
| C | 9 | 187 | 196651 | 1298.83 | 642 | 646 | 150.9 |
| C | 14 | 254 | 135359 | 892.68 | 642 | 646 | 150.9 |
| D | 2 | 249 | 1074530 | 7151.82 | 606 | 587 | 150.2 |
| D | 12 | 227 | 934966 | 6222.41 | 606 | 587 | 150.2 |
| D | 12 | 0 | 312195 | 2075.12 | 606 | 587 | 150.2 |
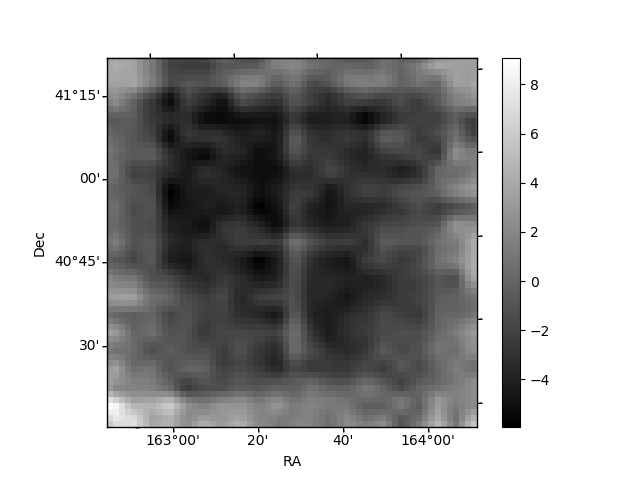
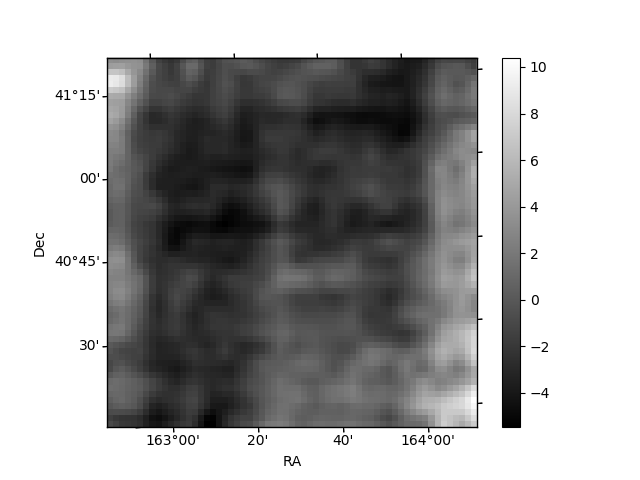
Histogram calculated using DETX and DETY for each event in the final _common_clean file
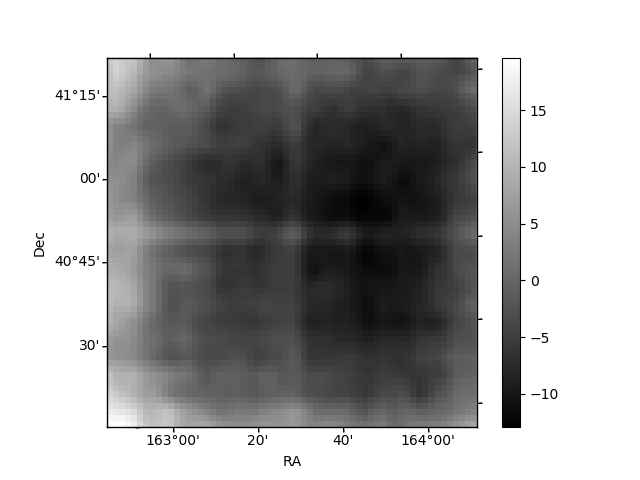
| Quadrant A | 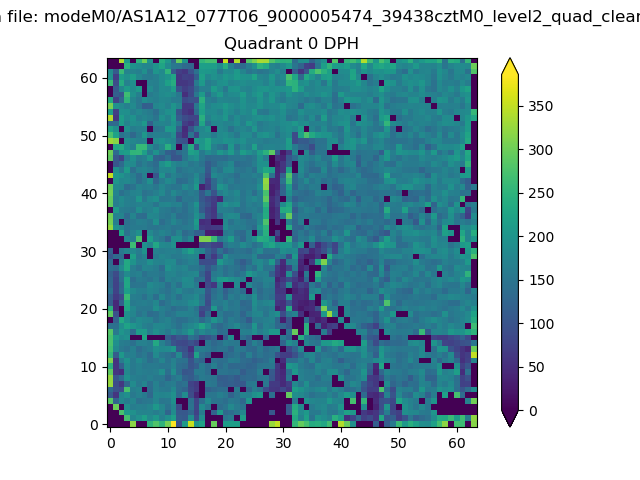 |
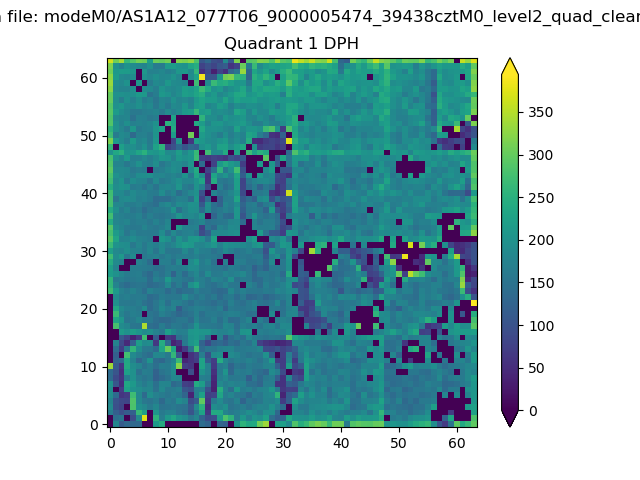 |
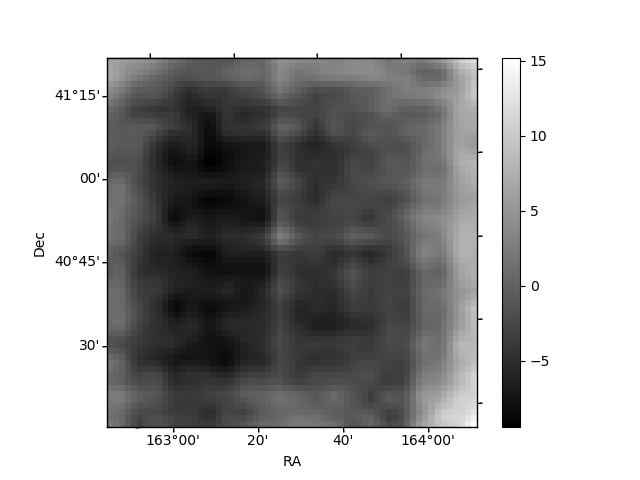
Quadrant B |
|---|---|---|---|
| Quadrant D | 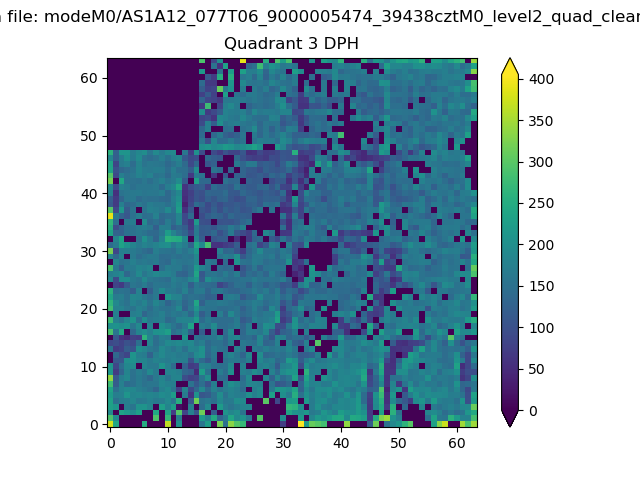 |
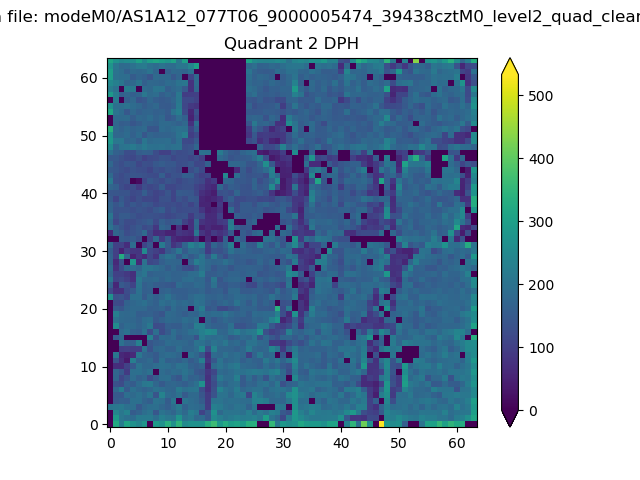 |
Quadrant C |
| Plot type | Count rate plots | Images |
|---|---|---|
| Comparison with Poisson distribution Blue bars denote a histogram of data divided into 1 sec bins. Red curve is a Poisson curve with rate = median count rate of data. |
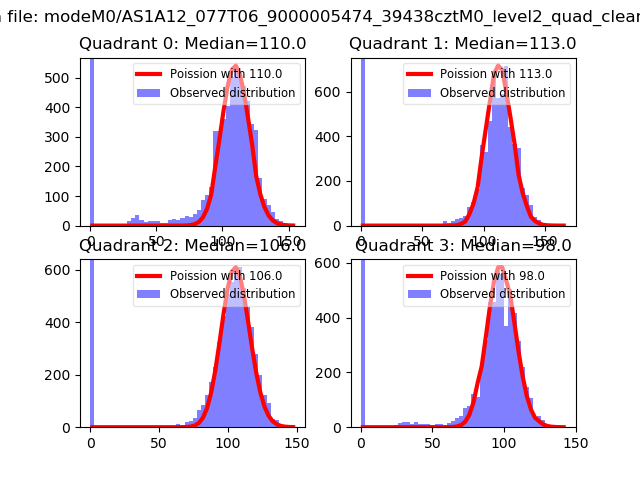 |
 |
| Quadrant-wise count rates Data is divided into 100 sec bins |
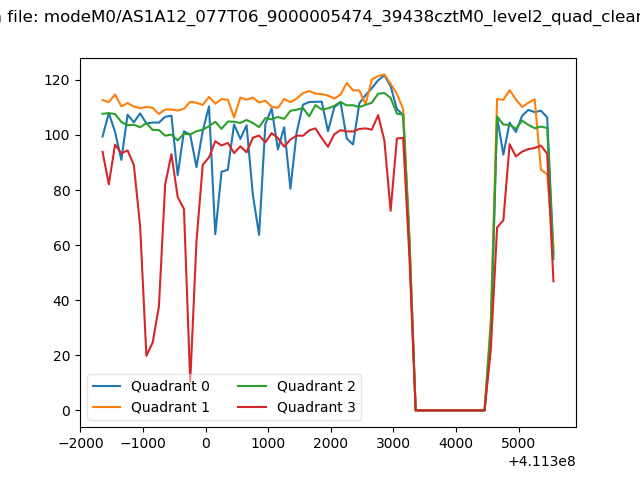 |
|
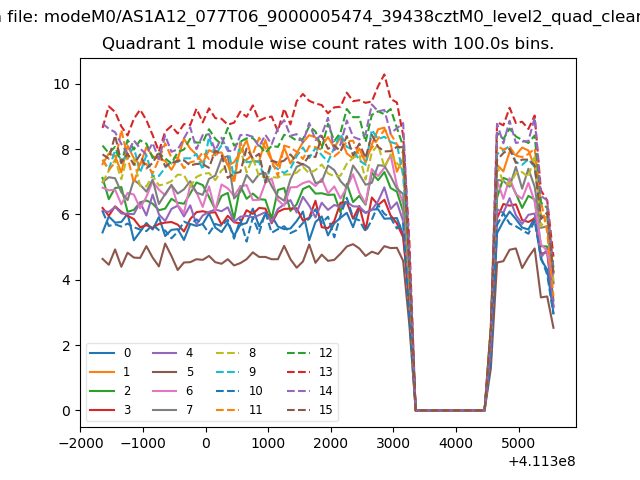
| Module-wise count rates for Quadrant A Data is divided into 100 sec bins |
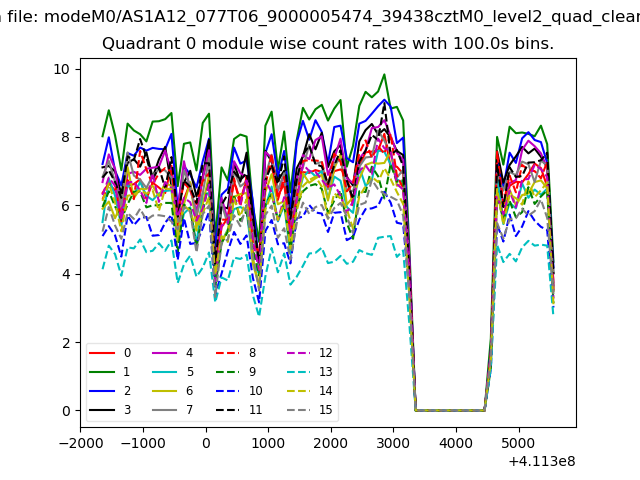 |
 |
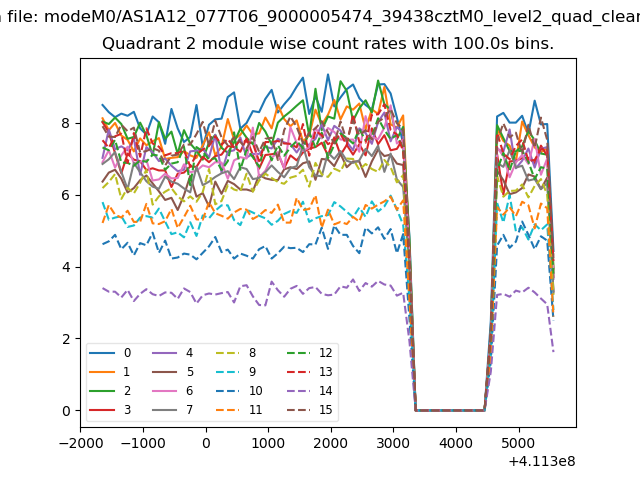
| Module-wise count rates for Quadrant B Data is divided into 100 sec bins |
 |
 |
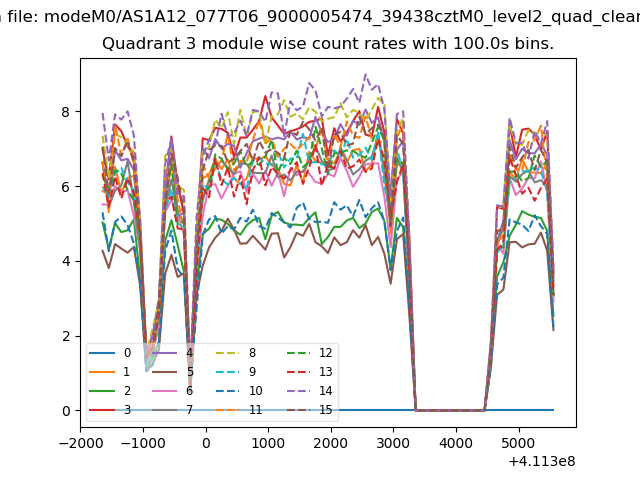
| Module-wise count rates for Quadrant C Data is divided into 100 sec bins |
 |
 |
| Module-wise count rates for Quadrant D Data is divided into 100 sec bins |
 |
 |
| Parameter | Plot |
|---|---|
| CZT HV Monitor | 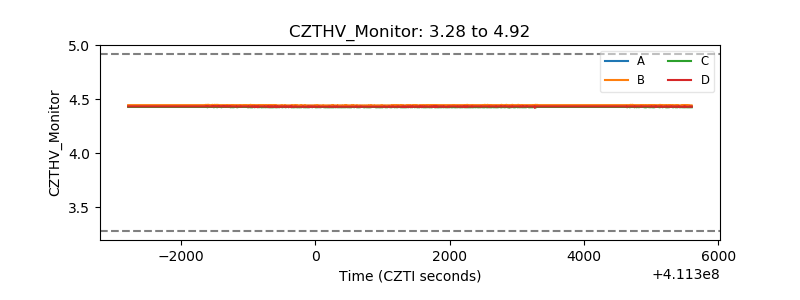 |
| D_VDD | 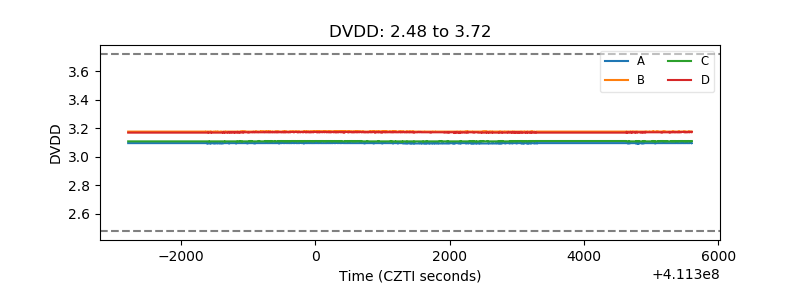 |
| Temperature 1 | 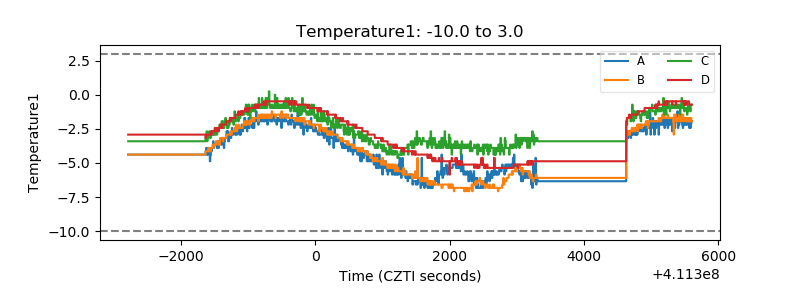 |
| Veto HV Monitor | 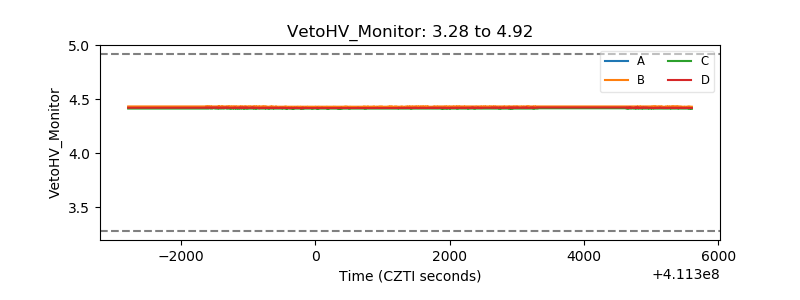 |
| Veto LLD | 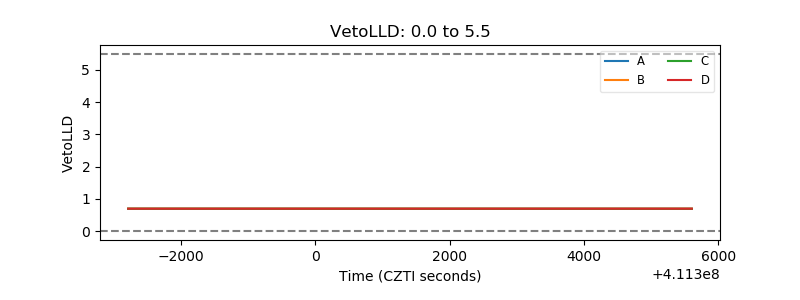 |
| Alpha Counter | 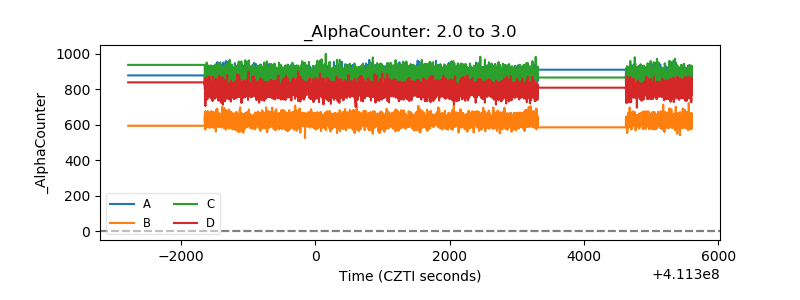 |
| _CPM_Rate | 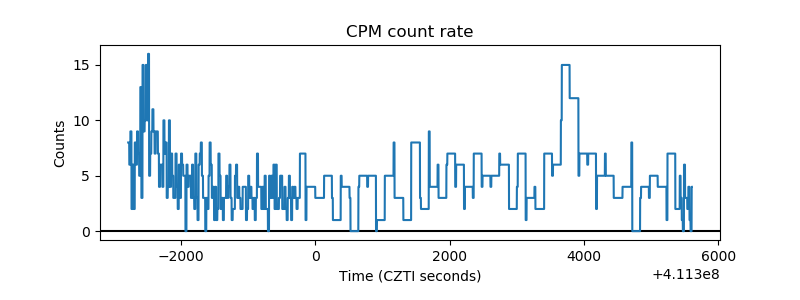 |
| CZT Counter | 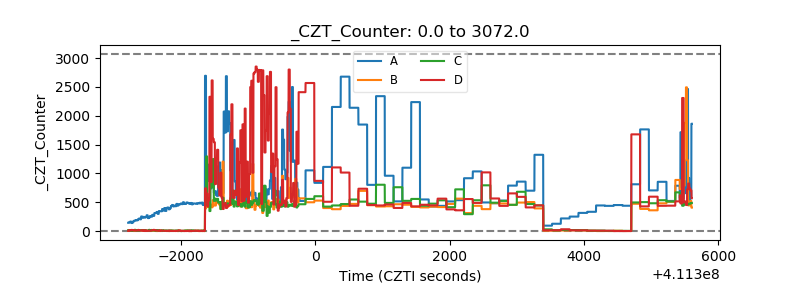 |
| +2.5 Volts monitor | 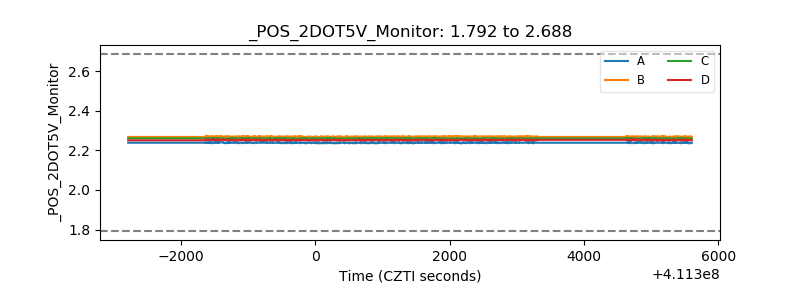 |
| +5 Volts monitor | 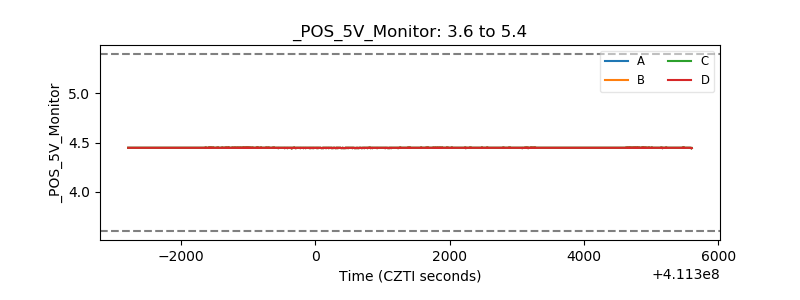 |
| _ROLL_ROT | 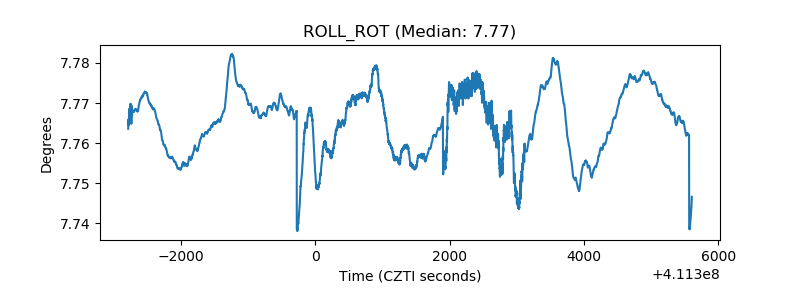 |
| _Roll_DEC | 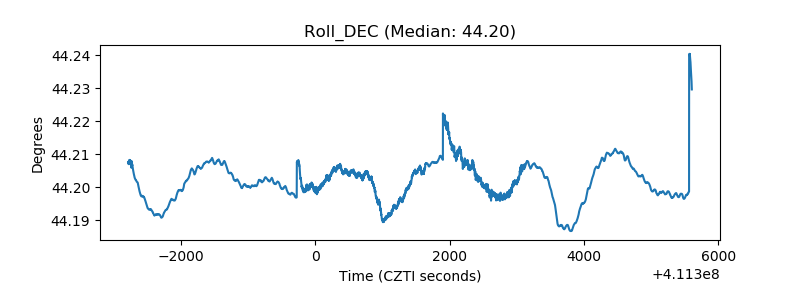 |
| _Roll_RA | 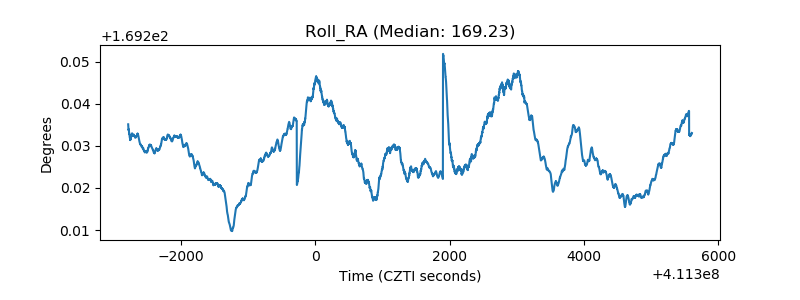 |
| Veto Counter | 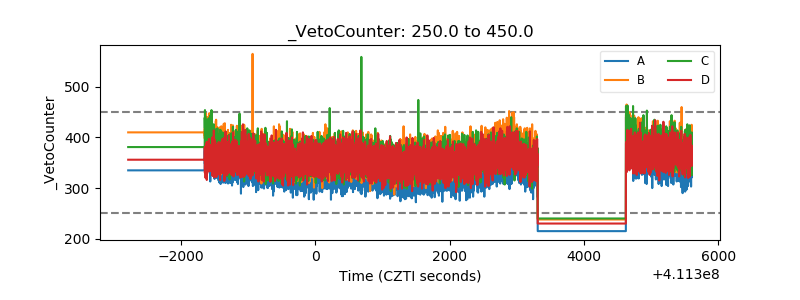 |