| Param | Original file | Final file |
|---|---|---|
| Filename | modeM0/AS1A12_077T06_9000005474_39440cztM0_level2.fits | modeM0/AS1A12_077T06_9000005474_39440cztM0_level2_quad_clean.evt |
| Size (bytes) | 798,629,760 | 170,956,800 |
| Size | 761.6 MB | 163.0 MB |
| Events in quadrant A | 7,988,542 | 1,146,599 |
| Events in quadrant B | 5,419,886 | 1,199,456 |
| Events in quadrant C | 6,667,009 | 1,095,837 |
| Events in quadrant D | 8,652,186 | 987,297 |
| Mode M0 | |||
|---|---|---|---|
| Quadrant | BADHDUFLAG | Total packets | Discarded packets |
| A | 0 | 30865 | 4 |
| B | 0 | 23511 | 3 |
| C | 0 | 26522 | 3 |
| D | 0 | 33083 | 3 |
| Mode SS | |||
|---|---|---|---|
| Quadrant | BADHDUFLAG | Total packets | Discarded packets |
| A | 0 | 220 | 0 |
| B | 0 | 220 | 0 |
| C | 0 | 220 | 0 |
| D | 0 | 220 | 0 |
| Mode M9 | |||
|---|---|---|---|
| Quadrant | BADHDUFLAG | Total packets | Discarded packets |
| A | 0 | 32 | 0 |
| B | 0 | 32 | 0 |
| C | 0 | 32 | 0 |
| D | 0 | 33 | 0 |
| Quadrant | Total seconds | Saturated seconds | Saturation percentage |
|---|---|---|---|
| A | 10784 | 410 | 3.801929% |
| B | 10784 | 132 | 1.224036% |
| C | 10784 | 371 | 3.440282% |
| D | 10784 | 893 | 8.280786% |
Noise dominated data is calculated using 1-second bins in cleaned event files. If a bin has >2000 counts, and if more than 50% of those come from <1% of pixels, then it is considered to be noise-dominated and hence unusable.
| Quadrant | # 1 sec bins | Bins with >0 counts | Bins with >2000 counts | High rate bins dominated by noise | Noise dominated (total time) | Noise dominated (detector-on time) | Marked lightcurve |
|---|---|---|---|---|---|---|---|
| A | 13559 | 10786 | 287 | 287 | 2.12% | 2.66% | 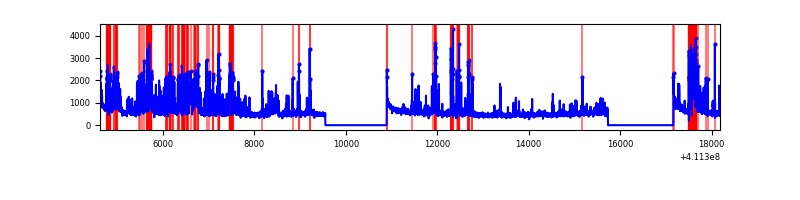 |
| B | 13559 | 10786 | 69 | 69 | 0.51% | 0.64% | 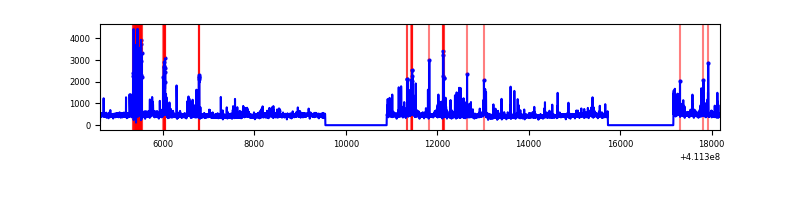 |
| C | 13559 | 10786 | 291 | 291 | 2.15% | 2.70% | 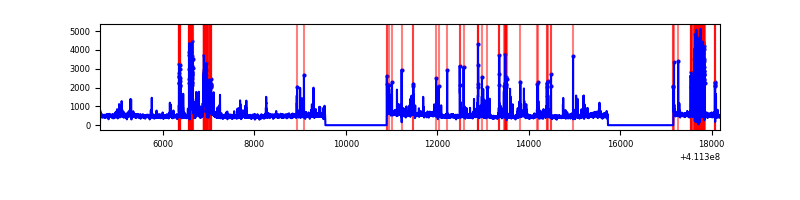 |
| D | 13559 | 10786 | 767 | 767 | 5.66% | 7.11% | 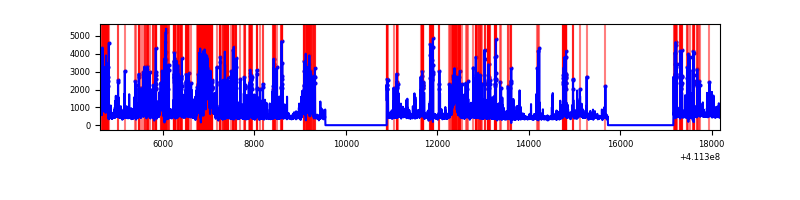 |
Top three noisy pixels from each quadrant. If the there are fewer than three noisy pixels in the level2.evt file, extra rows are filled as -1
| Pixel properties | Quadrant properties | ||||||
|---|---|---|---|---|---|---|---|
| Quadrant | DetID | PixID | Counts | Sigma | Mean | Median | Sigma |
| A | 15 | 222 | 2227076 | 9187.68 | 1189 | 1163 | 242.3 |
| A | 10 | 83 | 825345 | 3401.89 | 1189 | 1163 | 242.3 |
| A | 9 | 143 | 296359 | 1218.45 | 1189 | 1163 | 242.3 |
| B | 5 | 172 | 402843 | 1741.82 | 1192 | 1156 | 230.6 |
| B | 8 | 3 | 262302 | 1132.39 | 1192 | 1156 | 230.6 |
| B | 5 | 255 | 55110 | 233.96 | 1192 | 1156 | 230.6 |
| C | 15 | 208 | 960628 | 3586.42 | 1151 | 1158 | 267.5 |
| C | 15 | 214 | 438377 | 1634.29 | 1151 | 1158 | 267.5 |
| C | 14 | 254 | 389185 | 1450.41 | 1151 | 1158 | 267.5 |
| D | 12 | 227 | 2030878 | 7342.88 | 1127 | 1095 | 276.4 |
| D | 12 | 0 | 932943 | 3371.02 | 1127 | 1095 | 276.4 |
| D | 2 | 249 | 656462 | 2370.84 | 1127 | 1095 | 276.4 |
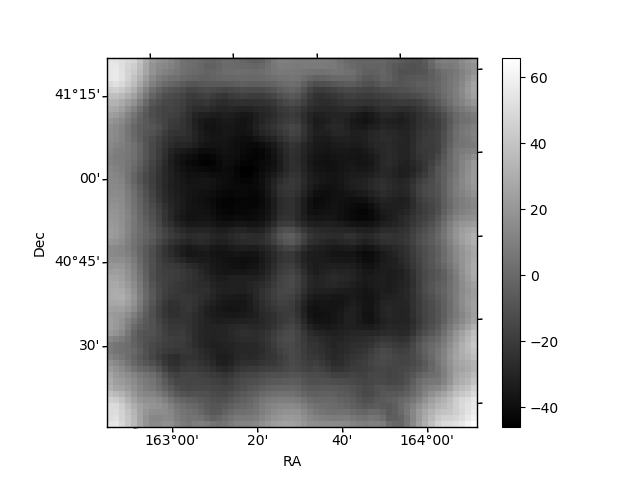
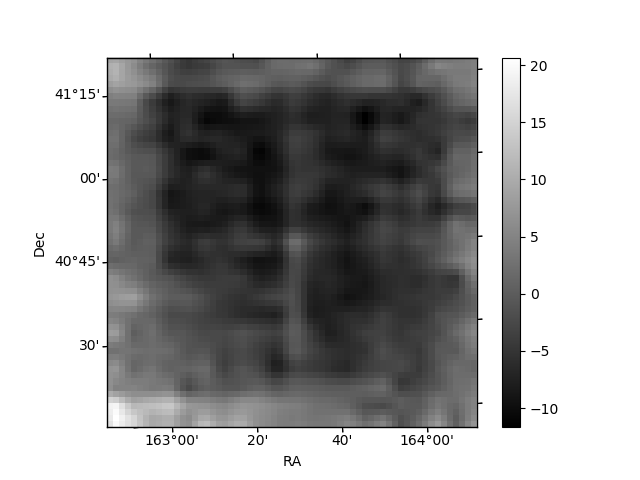
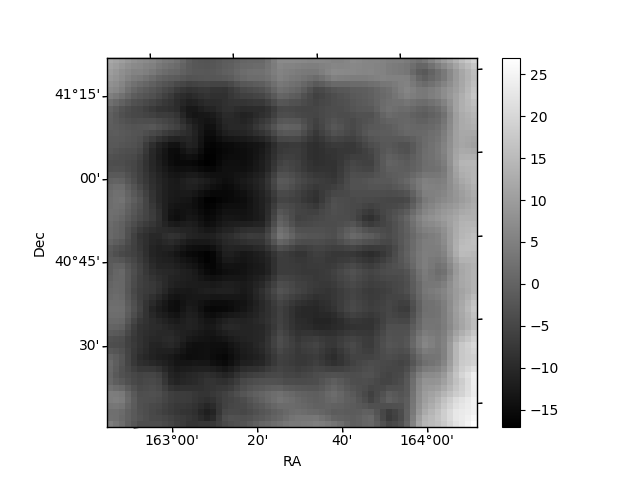
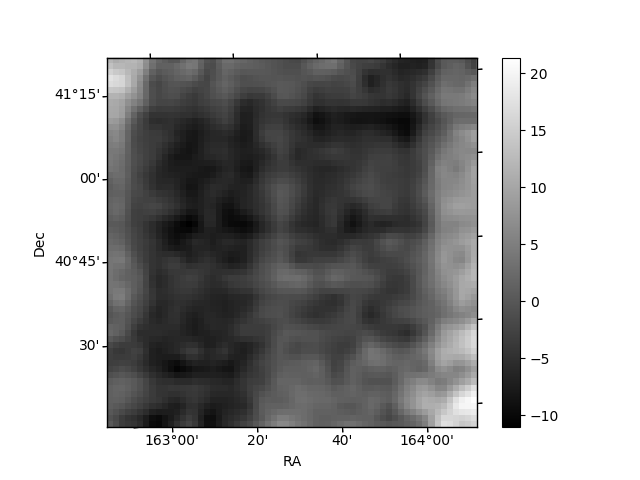
Histogram calculated using DETX and DETY for each event in the final _common_clean file
| Quadrant A | 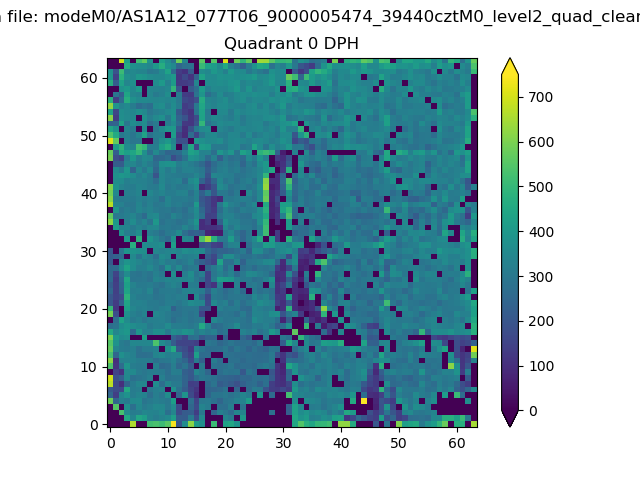 |
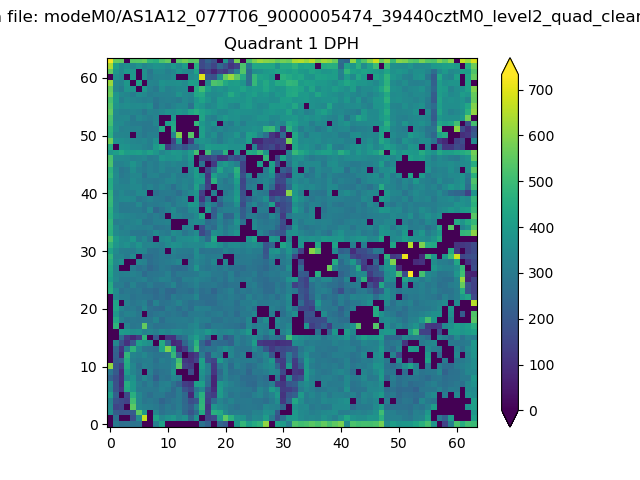 |
Quadrant B |
|---|---|---|---|
| Quadrant D | 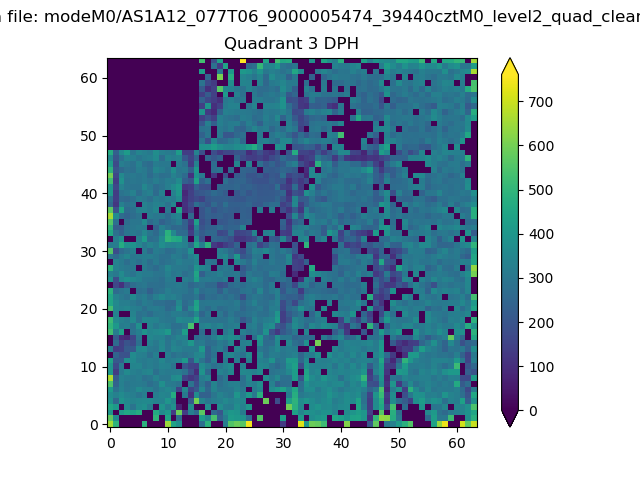 |
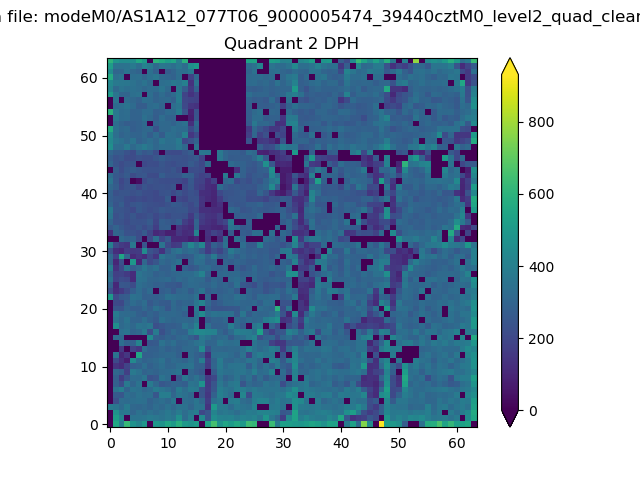 |
Quadrant C |
| Plot type | Count rate plots | Images |
|---|---|---|
| Comparison with Poisson distribution Blue bars denote a histogram of data divided into 1 sec bins. Red curve is a Poisson curve with rate = median count rate of data. |
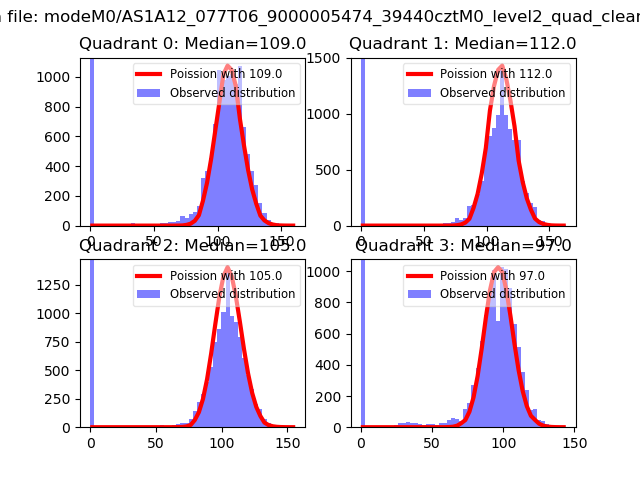 |
 |
| Quadrant-wise count rates Data is divided into 100 sec bins |
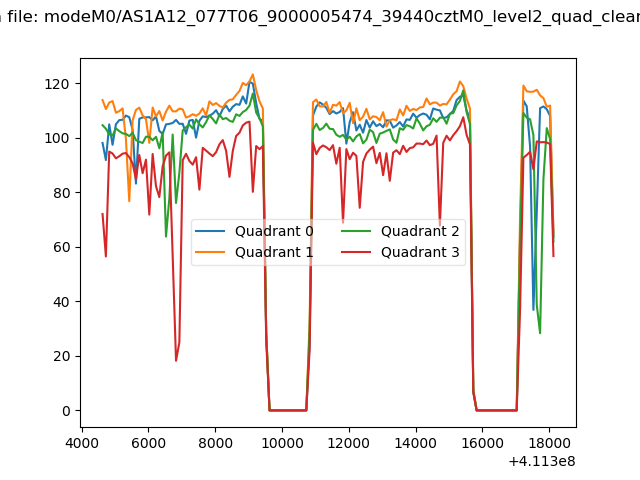 |
|
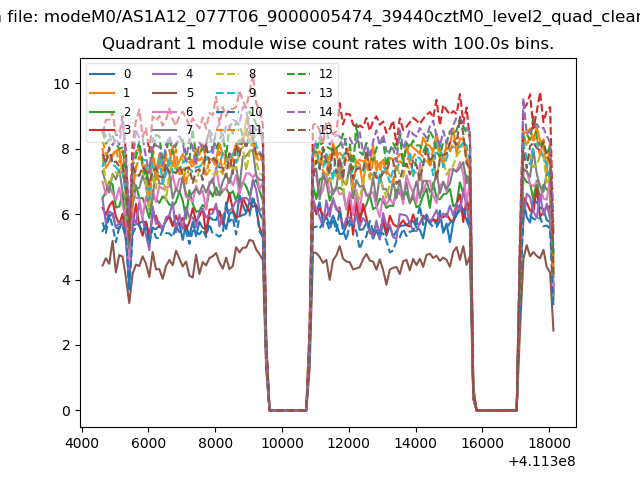
| Module-wise count rates for Quadrant A Data is divided into 100 sec bins |
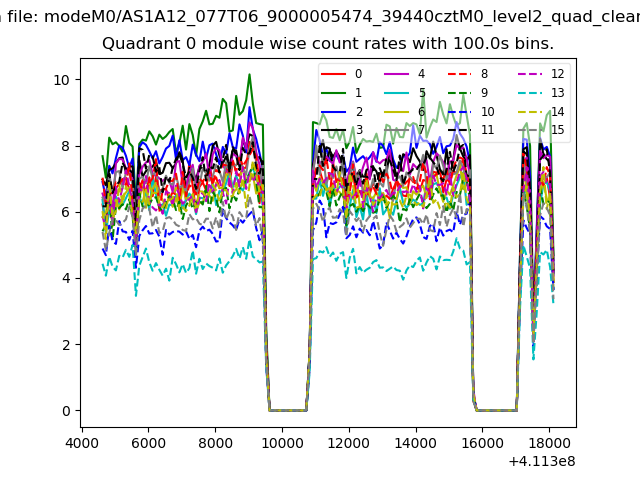 |
 |
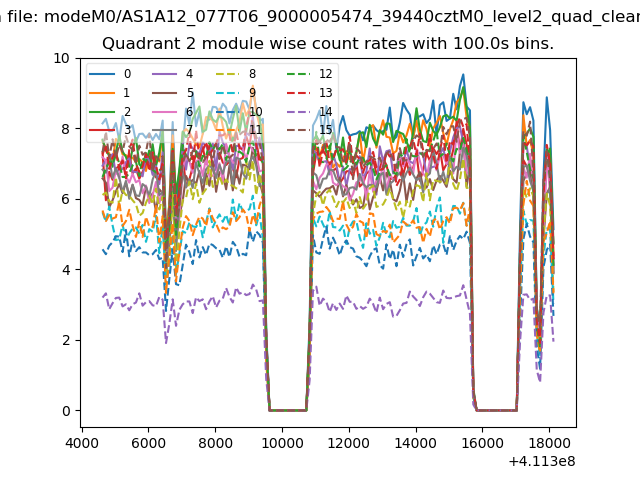
| Module-wise count rates for Quadrant B Data is divided into 100 sec bins |
 |
 |
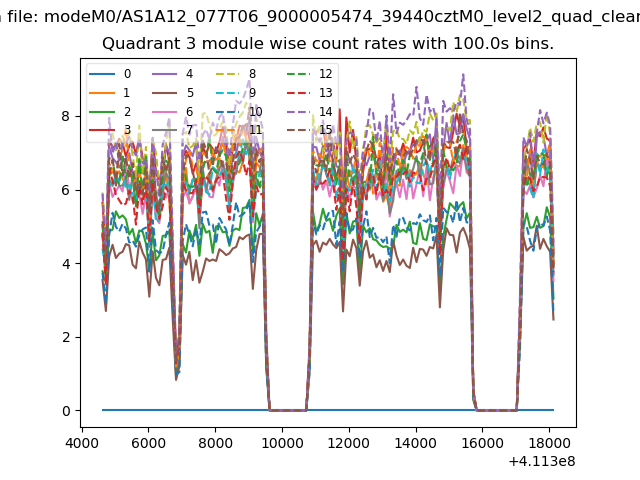
| Module-wise count rates for Quadrant C Data is divided into 100 sec bins |
 |
 |
| Module-wise count rates for Quadrant D Data is divided into 100 sec bins |
 |
 |
| Parameter | Plot |
|---|---|
| CZT HV Monitor | 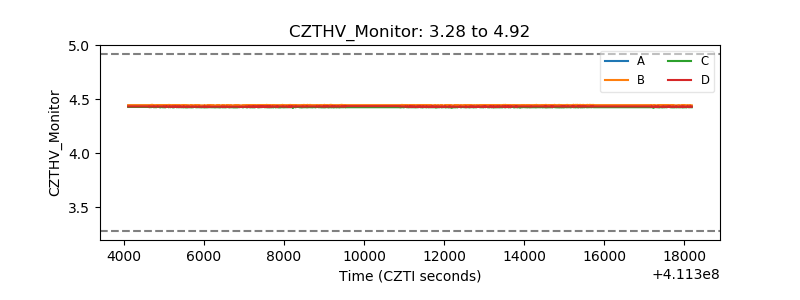 |
| D_VDD | 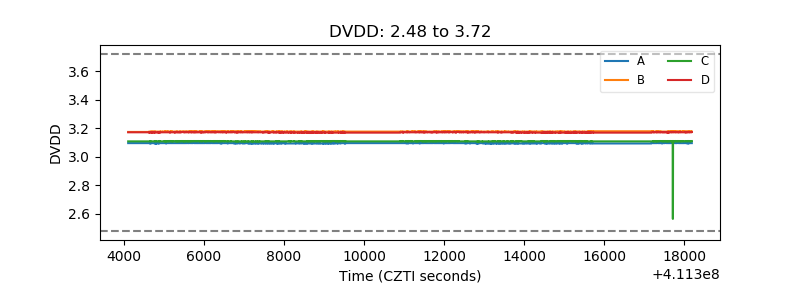 |
| Temperature 1 | 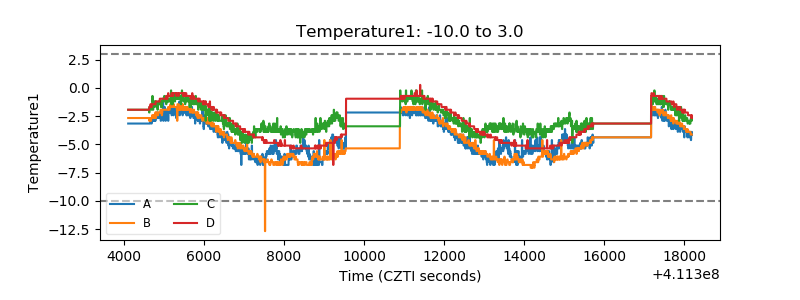 |
| Veto HV Monitor | 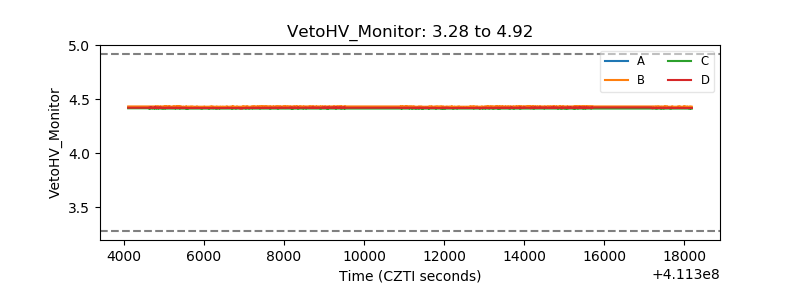 |
| Veto LLD | 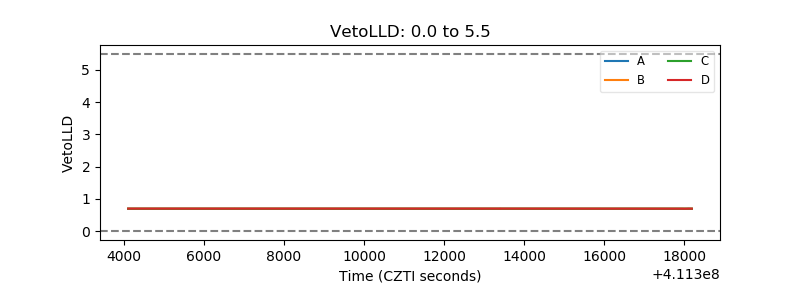 |
| Alpha Counter | 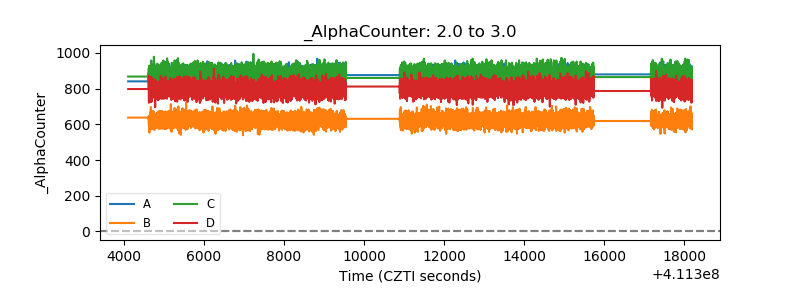 |
| _CPM_Rate | 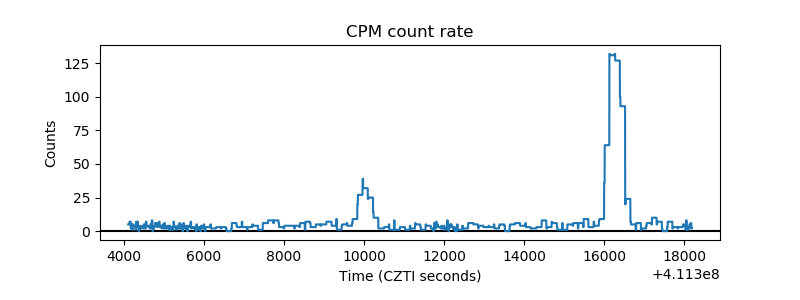 |
| CZT Counter | 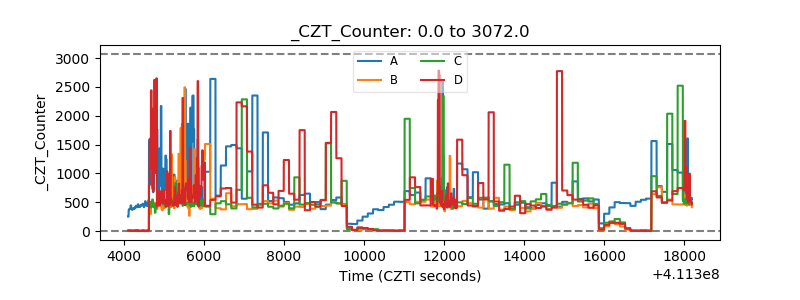 |
| +2.5 Volts monitor | 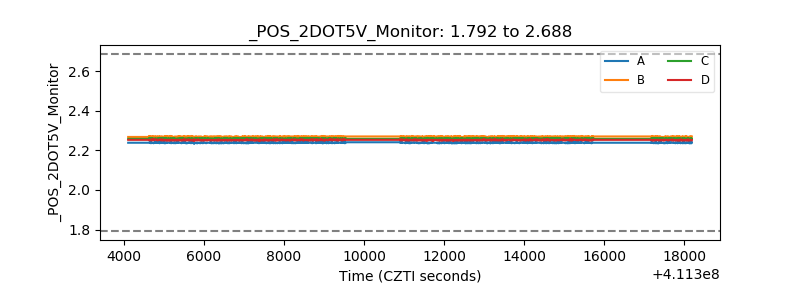 |
| +5 Volts monitor | 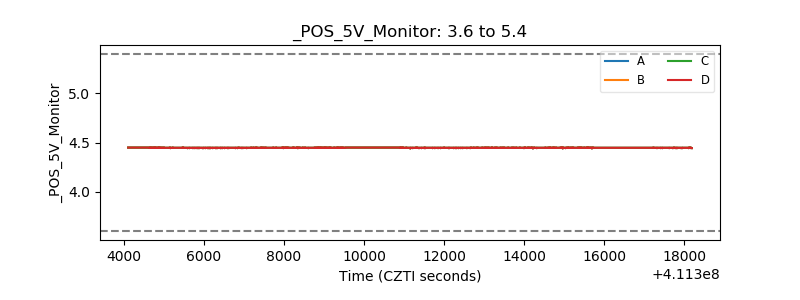 |
| _ROLL_ROT | 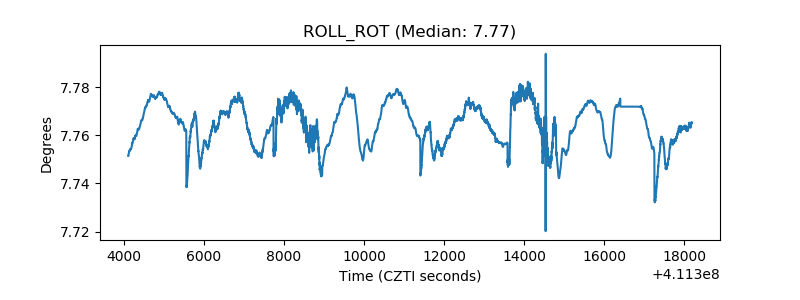 |
| _Roll_DEC | 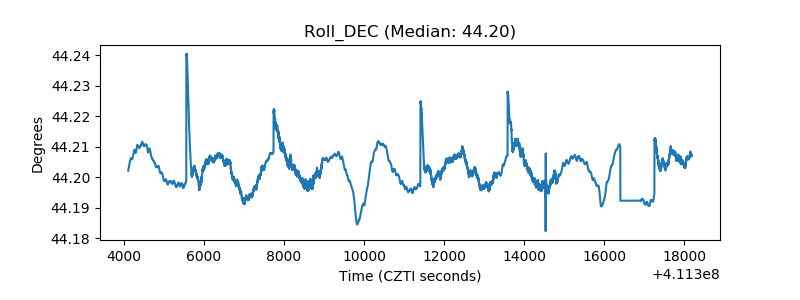 |
| _Roll_RA | 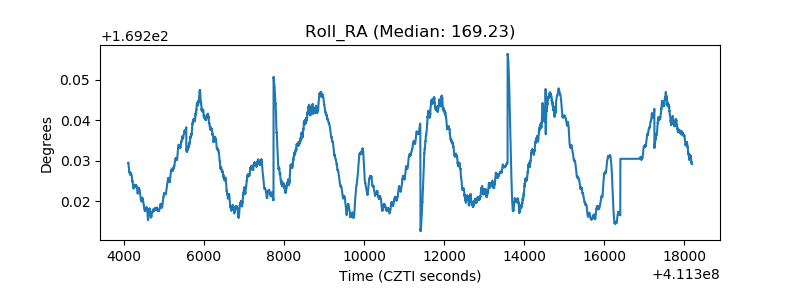 |
| Veto Counter | 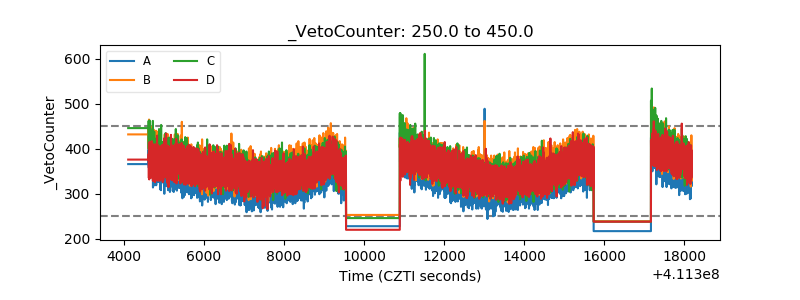 |