| Param | Original file | Final file |
|---|---|---|
| Filename | modeM0/AS1A12_077T06_9000005474_39441cztM0_level2.fits | modeM0/AS1A12_077T06_9000005474_39441cztM0_level2_quad_clean.evt |
| Size (bytes) | 450,624,960 | 89,654,400 |
| Size | 429.7 MB | 85.5 MB |
| Events in quadrant A | 4,749,190 | 577,304 |
| Events in quadrant B | 3,102,033 | 638,369 |
| Events in quadrant C | 3,865,282 | 581,835 |
| Events in quadrant D | 4,522,296 | 519,640 |
| Mode M0 | |||
|---|---|---|---|
| Quadrant | BADHDUFLAG | Total packets | Discarded packets |
| A | 0 | 17907 | 3 |
| B | 0 | 13234 | 2 |
| C | 0 | 15124 | 2 |
| D | 0 | 17469 | 2 |
| Mode SS | |||
|---|---|---|---|
| Quadrant | BADHDUFLAG | Total packets | Discarded packets |
| A | 0 | 116 | 0 |
| B | 0 | 116 | 0 |
| C | 0 | 116 | 0 |
| D | 0 | 116 | 0 |
| Mode M9 | |||
|---|---|---|---|
| Quadrant | BADHDUFLAG | Total packets | Discarded packets |
| A | 0 | 28 | 0 |
| B | 0 | 28 | 0 |
| C | 0 | 28 | 0 |
| D | 0 | 29 | 0 |
| Quadrant | Total seconds | Saturated seconds | Saturation percentage |
|---|---|---|---|
| A | 5682 | 576 | 10.137276% |
| B | 5682 | 115 | 2.023935% |
| C | 5682 | 340 | 5.983809% |
| D | 5682 | 582 | 10.242872% |
Noise dominated data is calculated using 1-second bins in cleaned event files. If a bin has >2000 counts, and if more than 50% of those come from <1% of pixels, then it is considered to be noise-dominated and hence unusable.
| Quadrant | # 1 sec bins | Bins with >0 counts | Bins with >2000 counts | High rate bins dominated by noise | Noise dominated (total time) | Noise dominated (detector-on time) | Marked lightcurve |
|---|---|---|---|---|---|---|---|
| A | 7265 | 5682 | 458 | 458 | 6.30% | 8.06% | 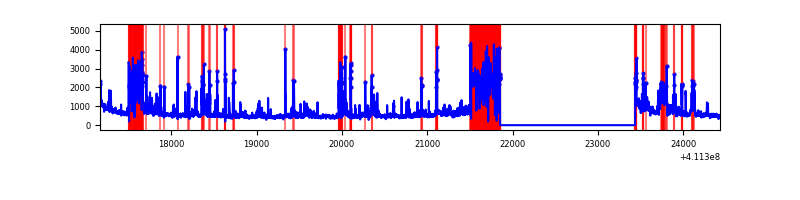 |
| B | 7265 | 5683 | 58 | 58 | 0.80% | 1.02% | 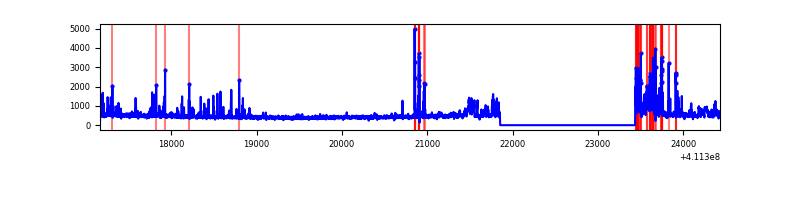 |
| C | 7265 | 5683 | 266 | 266 | 3.66% | 4.68% | 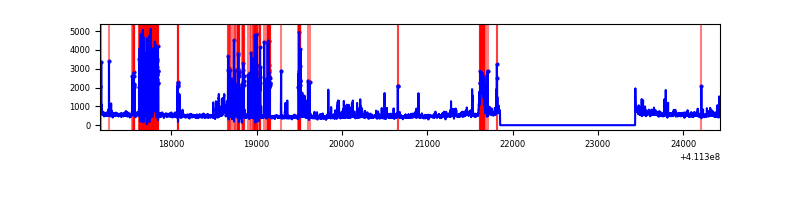 |
| D | 7265 | 5683 | 448 | 448 | 6.17% | 7.88% | 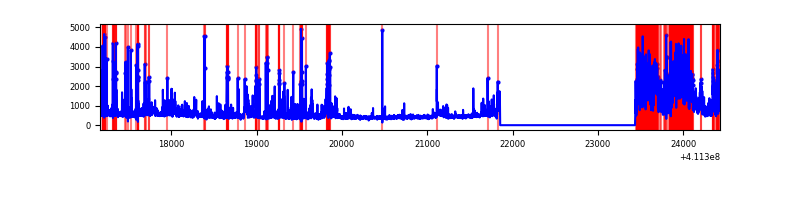 |
Top three noisy pixels from each quadrant. If the there are fewer than three noisy pixels in the level2.evt file, extra rows are filled as -1
| Pixel properties | Quadrant properties | ||||||
|---|---|---|---|---|---|---|---|
| Quadrant | DetID | PixID | Counts | Sigma | Mean | Median | Sigma |
| A | 15 | 222 | 1611834 | 12991.29 | 600 | 587 | 124.0 |
| A | 10 | 83 | 459981 | 3704.04 | 600 | 587 | 124.0 |
| A | 9 | 143 | 342775 | 2759.02 | 600 | 587 | 124.0 |
| B | 5 | 172 | 343316 | 2779.69 | 628 | 610 | 123.3 |
| B | 5 | 255 | 263037 | 2128.55 | 628 | 610 | 123.3 |
| B | 12 | 111 | 15089 | 117.44 | 628 | 610 | 123.3 |
| C | 15 | 208 | 910770 | 6495.25 | 598 | 602 | 140.1 |
| C | 9 | 187 | 277662 | 1977.19 | 598 | 602 | 140.1 |
| C | 15 | 214 | 231162 | 1645.35 | 598 | 602 | 140.1 |
| D | 12 | 0 | 1137939 | 7966.81 | 588 | 571 | 142.8 |
| D | 12 | 227 | 673216 | 4711.61 | 588 | 571 | 142.8 |
| D | 13 | 249 | 209000 | 1459.96 | 588 | 571 | 142.8 |
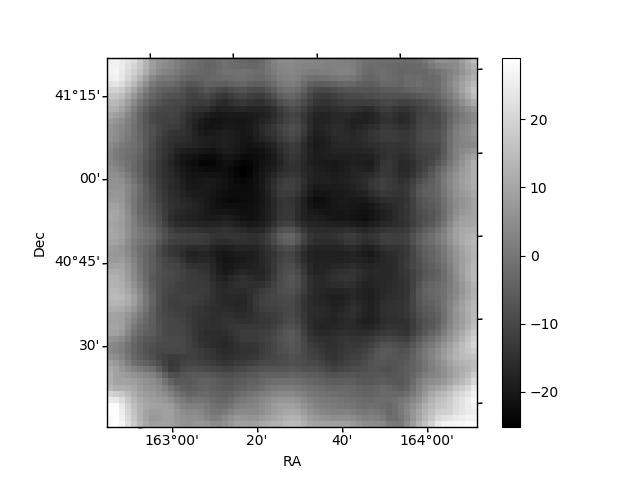
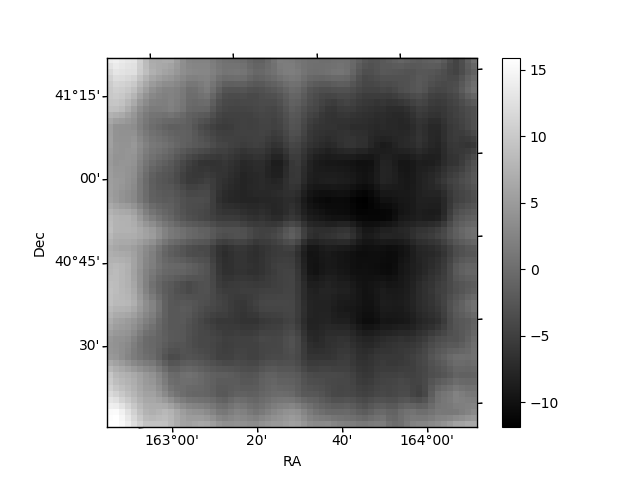
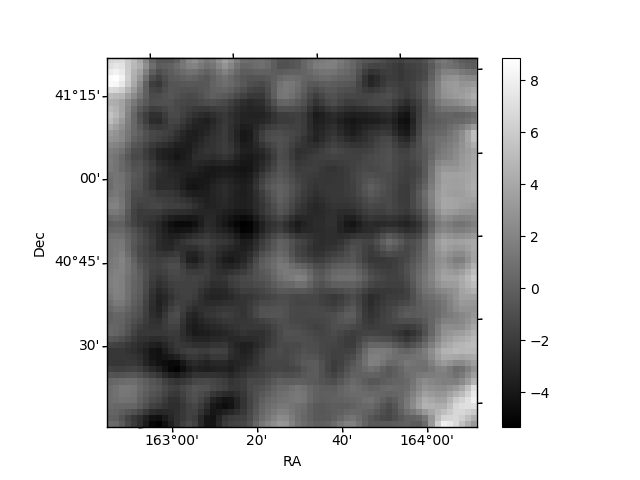
Histogram calculated using DETX and DETY for each event in the final _common_clean file
| Quadrant A | 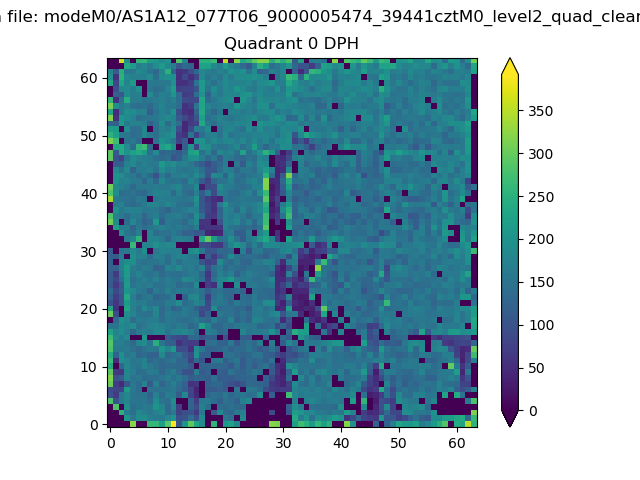 |
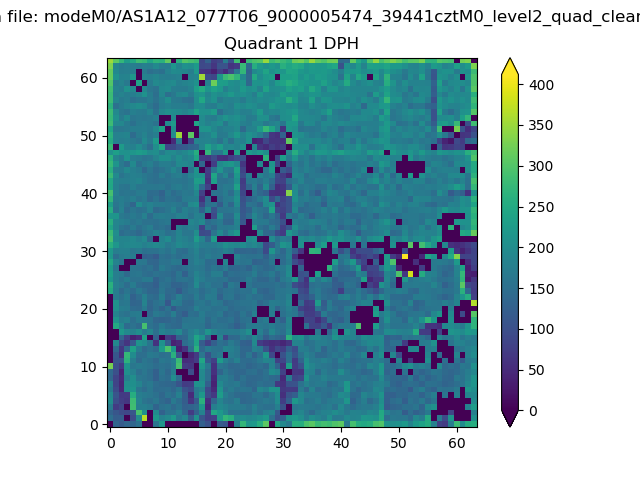 |
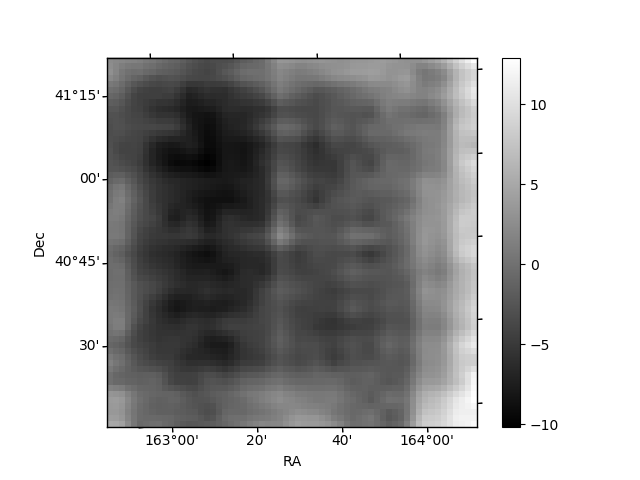
Quadrant B |
|---|---|---|---|
| Quadrant D | 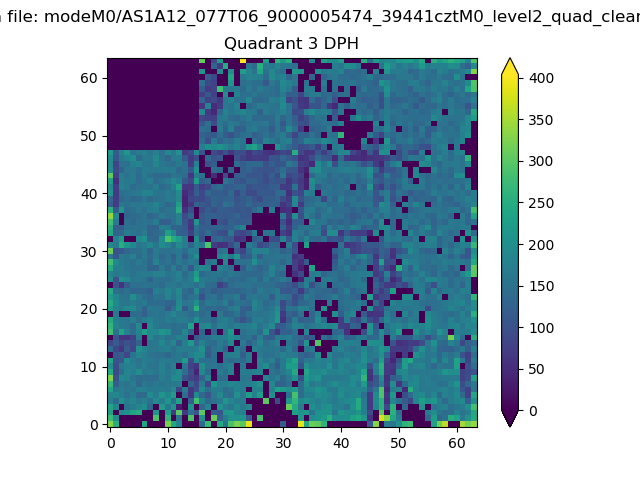 |
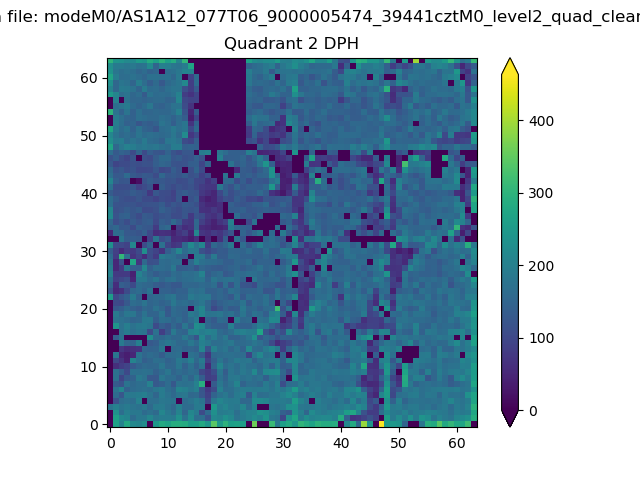 |
Quadrant C |
| Plot type | Count rate plots | Images |
|---|---|---|
| Comparison with Poisson distribution Blue bars denote a histogram of data divided into 1 sec bins. Red curve is a Poisson curve with rate = median count rate of data. |
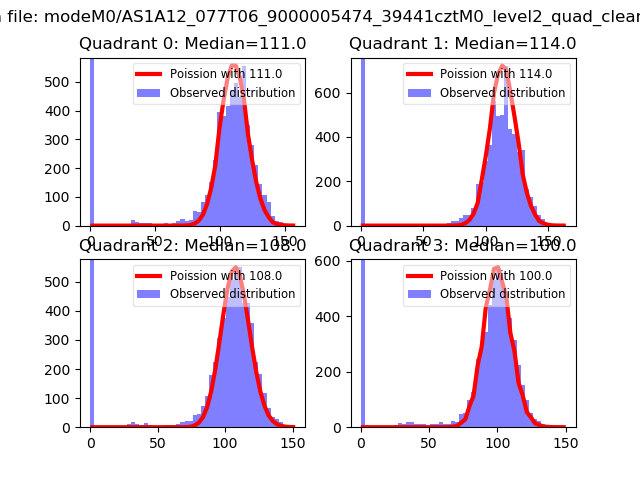 |
 |
| Quadrant-wise count rates Data is divided into 100 sec bins |
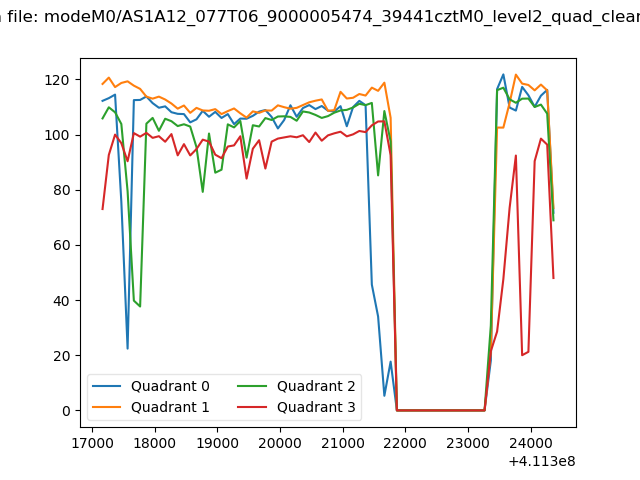 |
|
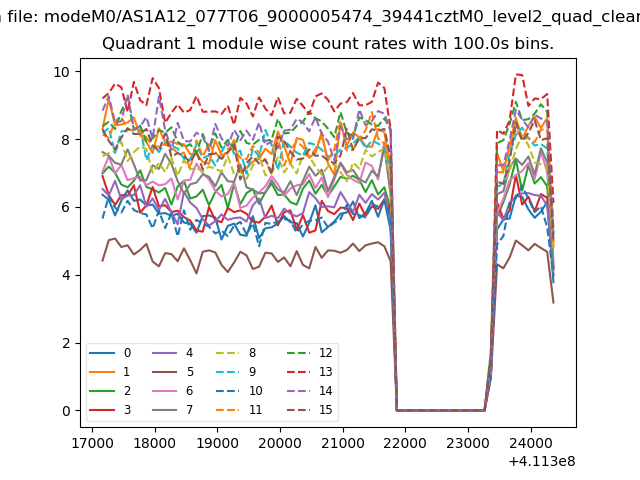
| Module-wise count rates for Quadrant A Data is divided into 100 sec bins |
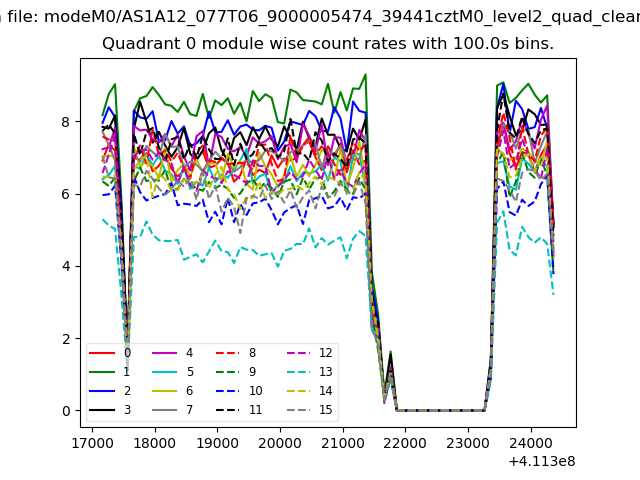 |
 |
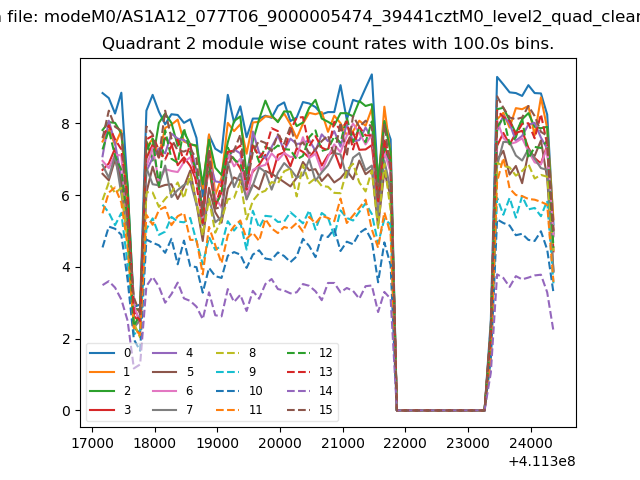
| Module-wise count rates for Quadrant B Data is divided into 100 sec bins |
 |
 |
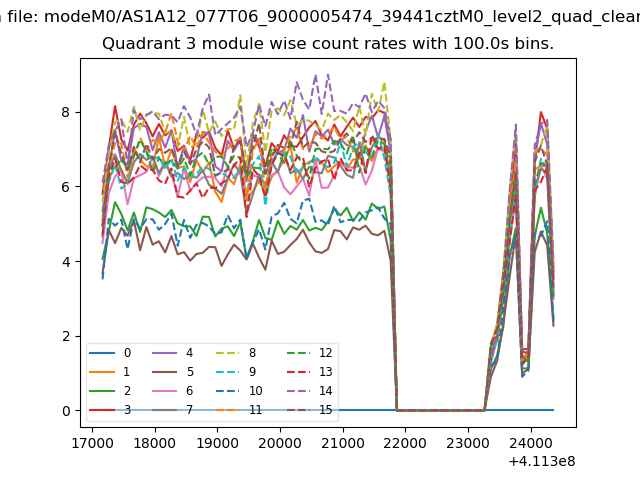
| Module-wise count rates for Quadrant C Data is divided into 100 sec bins |
 |
 |
| Module-wise count rates for Quadrant D Data is divided into 100 sec bins |
 |
 |
| Parameter | Plot |
|---|---|
| CZT HV Monitor | 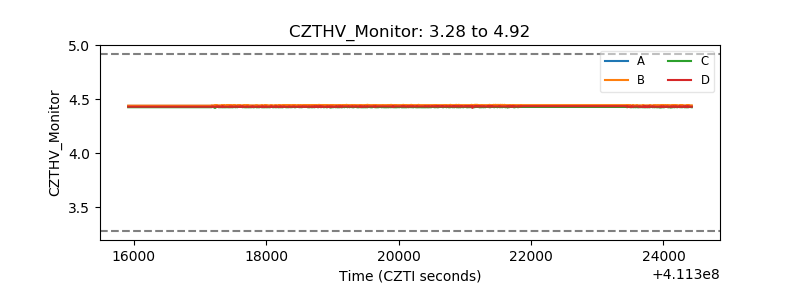 |
| D_VDD | 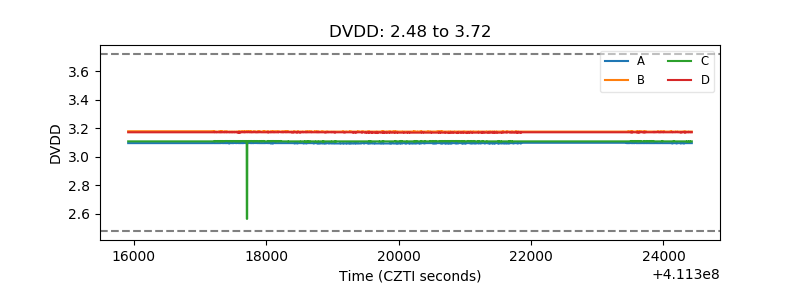 |
| Temperature 1 | 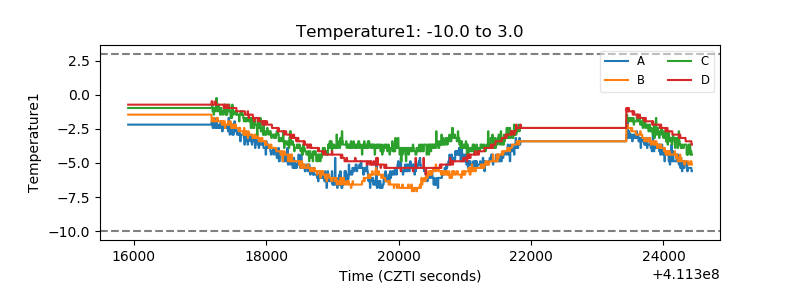 |
| Veto HV Monitor | 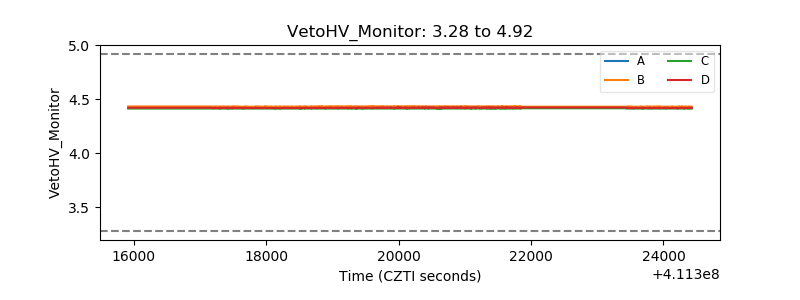 |
| Veto LLD | 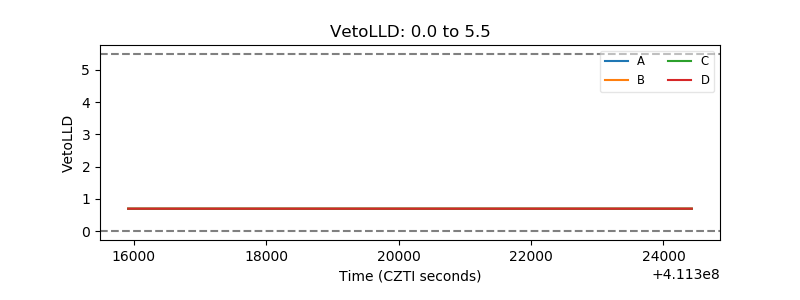 |
| Alpha Counter | 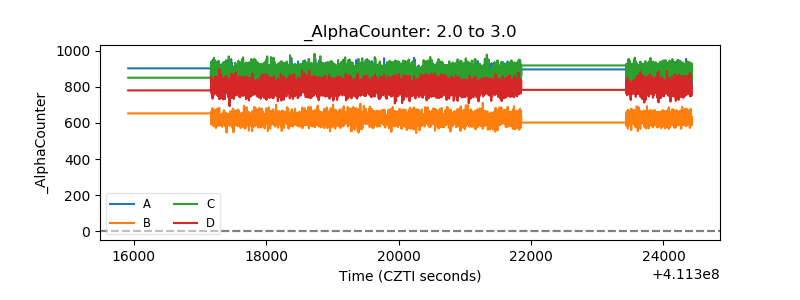 |
| _CPM_Rate | 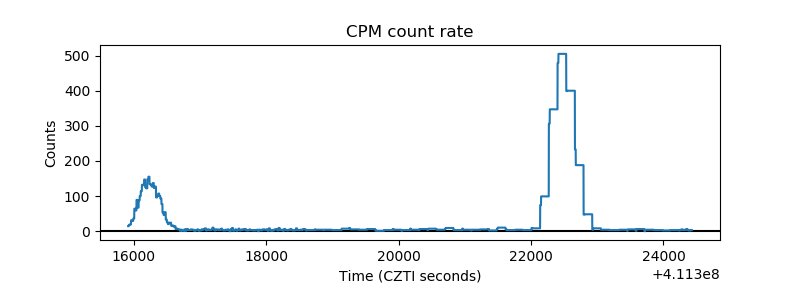 |
| CZT Counter | 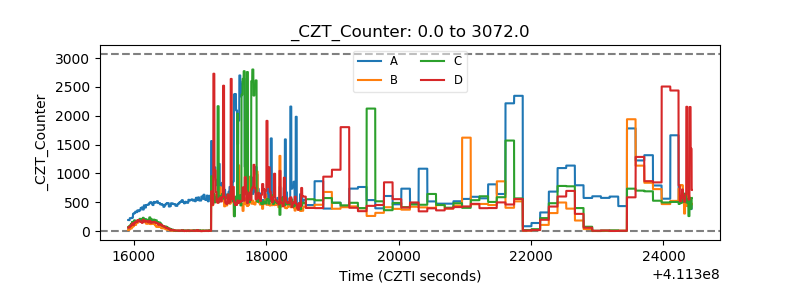 |
| +2.5 Volts monitor | 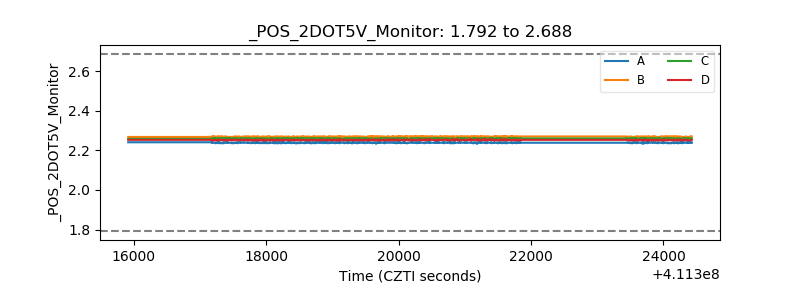 |
| +5 Volts monitor | 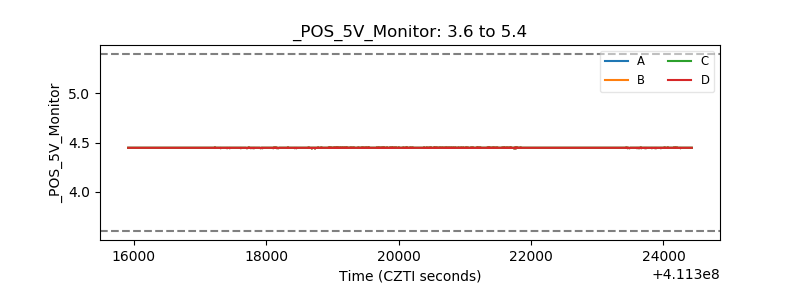 |
| _ROLL_ROT | 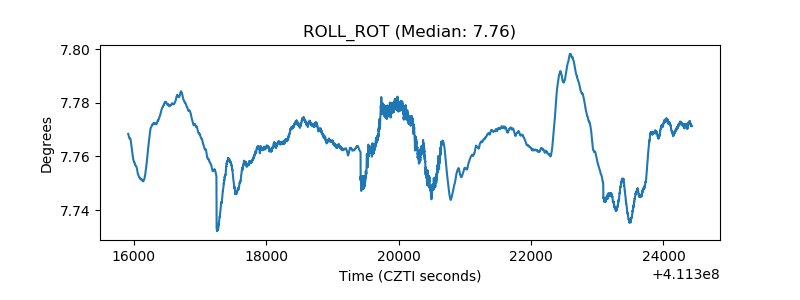 |
| _Roll_DEC | 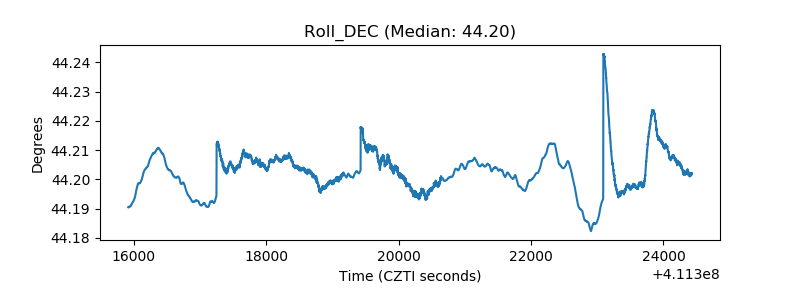 |
| _Roll_RA | 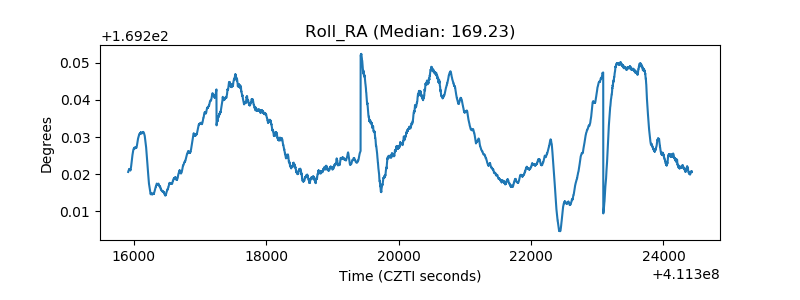 |
| Veto Counter | 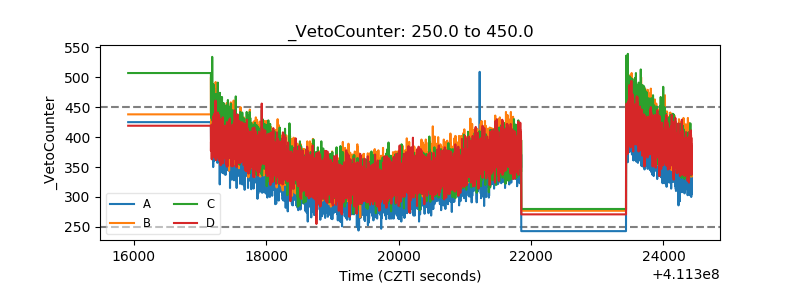 |