| Param | Original file | Final file |
|---|---|---|
| Filename | modeM0/AS1A12_077T06_9000005474_39442cztM0_level2.fits | modeM0/AS1A12_077T06_9000005474_39442cztM0_level2_quad_clean.evt |
| Size (bytes) | 410,304,960 | 91,483,200 |
| Size | 391.3 MB | 87.2 MB |
| Events in quadrant A | 3,667,777 | 624,339 |
| Events in quadrant B | 3,219,961 | 633,965 |
| Events in quadrant C | 3,389,478 | 607,352 |
| Events in quadrant D | 4,480,746 | 517,291 |
| Mode M0 | |||
|---|---|---|---|
| Quadrant | BADHDUFLAG | Total packets | Discarded packets |
| A | 0 | 14580 | 3 |
| B | 0 | 13328 | 2 |
| C | 0 | 13667 | 2 |
| D | 0 | 17278 | 2 |
| Mode SS | |||
|---|---|---|---|
| Quadrant | BADHDUFLAG | Total packets | Discarded packets |
| A | 0 | 112 | 0 |
| B | 0 | 112 | 0 |
| C | 0 | 112 | 0 |
| D | 0 | 112 | 0 |
| Mode M9 | |||
|---|---|---|---|
| Quadrant | BADHDUFLAG | Total packets | Discarded packets |
| A | 0 | 32 | 0 |
| B | 0 | 32 | 0 |
| C | 0 | 32 | 0 |
| D | 0 | 32 | 0 |
| Quadrant | Total seconds | Saturated seconds | Saturation percentage |
|---|---|---|---|
| A | 5534 | 96 | 1.734731% |
| B | 5534 | 147 | 2.656306% |
| C | 5534 | 95 | 1.716661% |
| D | 5534 | 584 | 10.552945% |
Noise dominated data is calculated using 1-second bins in cleaned event files. If a bin has >2000 counts, and if more than 50% of those come from <1% of pixels, then it is considered to be noise-dominated and hence unusable.
| Quadrant | # 1 sec bins | Bins with >0 counts | Bins with >2000 counts | High rate bins dominated by noise | Noise dominated (total time) | Noise dominated (detector-on time) | Marked lightcurve |
|---|---|---|---|---|---|---|---|
| A | 7208 | 5535 | 61 | 61 | 0.85% | 1.10% | 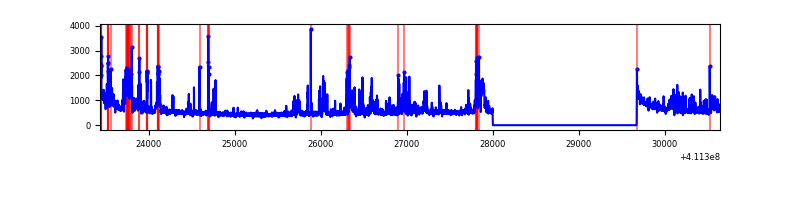 |
| B | 7208 | 5535 | 81 | 81 | 1.12% | 1.46% | 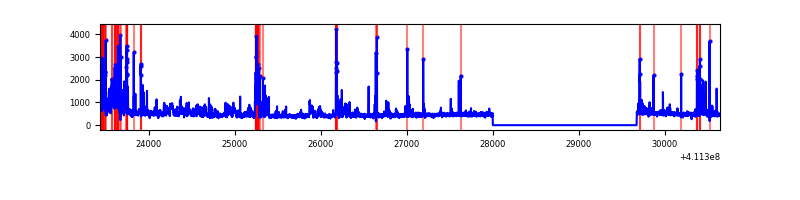 |
| C | 7208 | 5535 | 88 | 88 | 1.22% | 1.59% | 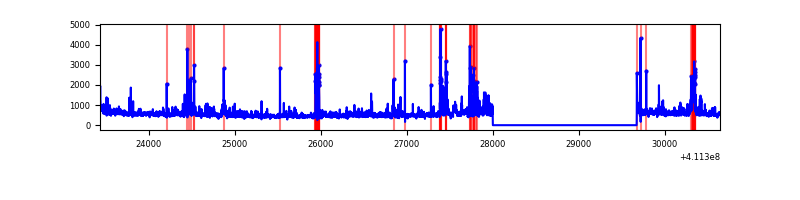 |
| D | 7208 | 5535 | 482 | 482 | 6.69% | 8.71% | 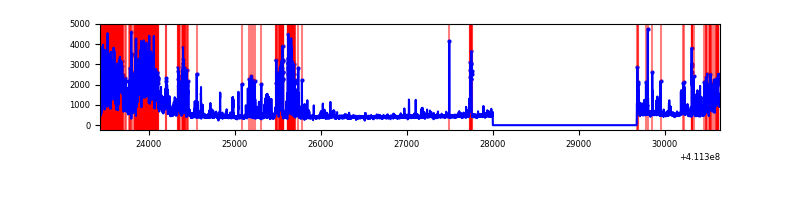 |
Top three noisy pixels from each quadrant. If the there are fewer than three noisy pixels in the level2.evt file, extra rows are filled as -1
| Pixel properties | Quadrant properties | ||||||
|---|---|---|---|---|---|---|---|
| Quadrant | DetID | PixID | Counts | Sigma | Mean | Median | Sigma |
| A | 15 | 222 | 588869 | 4629.6 | 615 | 602 | 127.1 |
| A | 10 | 83 | 457764 | 3597.81 | 615 | 602 | 127.1 |
| A | 9 | 143 | 220699 | 1732.14 | 615 | 602 | 127.1 |
| B | 5 | 255 | 540531 | 4509.76 | 612 | 596 | 119.7 |
| B | 5 | 172 | 245651 | 2046.8 | 612 | 596 | 119.7 |
| B | 0 | 186 | 14707 | 117.86 | 612 | 596 | 119.7 |
| C | 15 | 208 | 498937 | 3515.63 | 603 | 607 | 141.7 |
| C | 15 | 214 | 231685 | 1630.21 | 603 | 607 | 141.7 |
| C | 9 | 187 | 160381 | 1127.18 | 603 | 607 | 141.7 |
| D | 12 | 0 | 1097671 | 7896.55 | 575 | 559 | 138.9 |
| D | 13 | 249 | 392716 | 2822.58 | 575 | 559 | 138.9 |
| D | 12 | 227 | 271030 | 1946.73 | 575 | 559 | 138.9 |
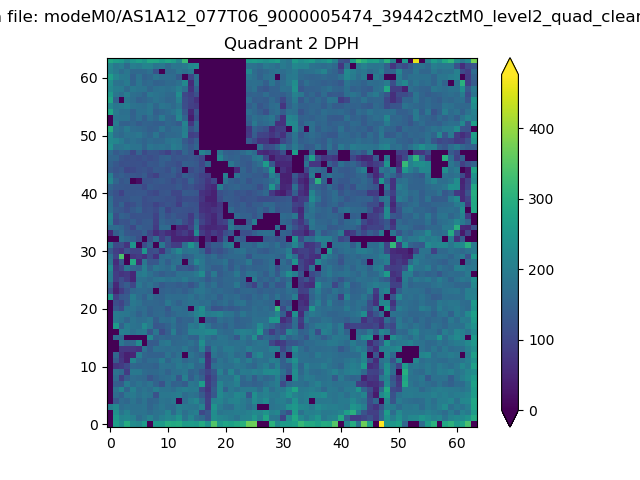
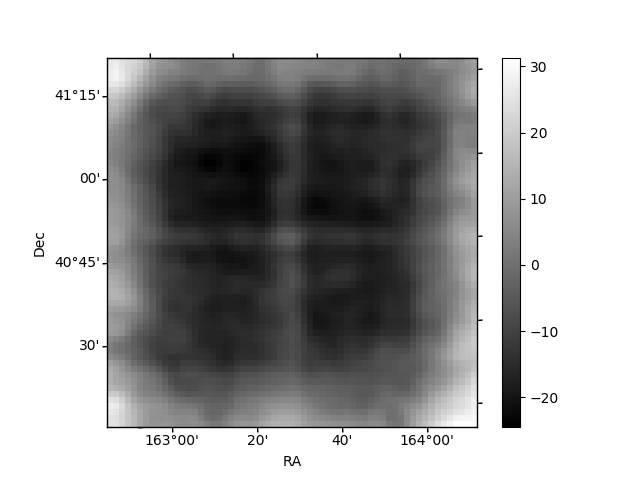
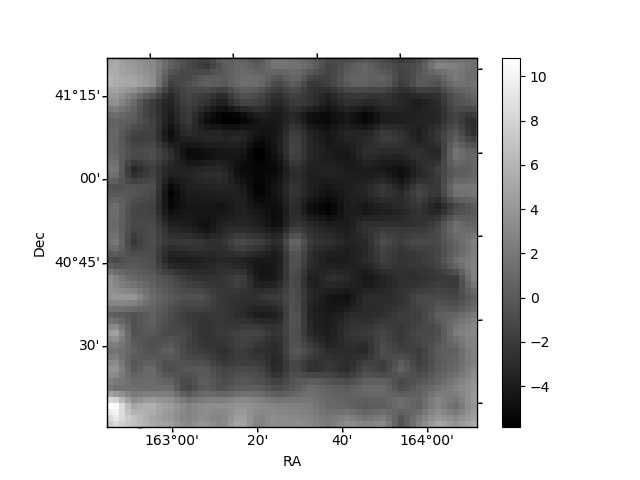
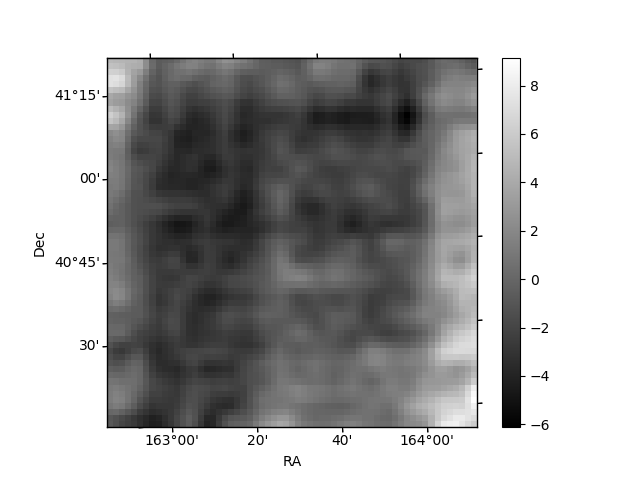
Histogram calculated using DETX and DETY for each event in the final _common_clean file
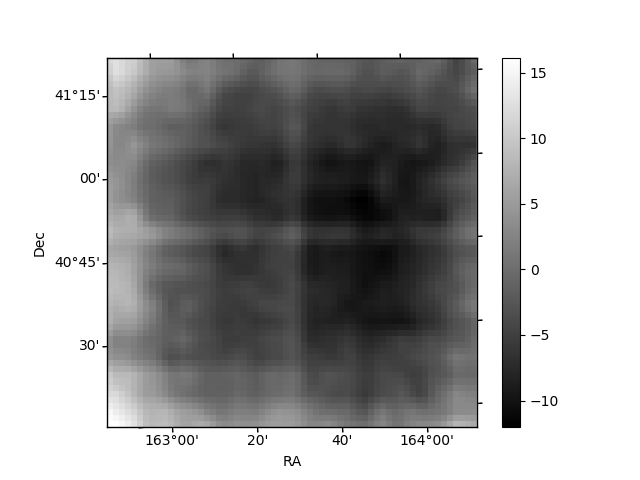
| Quadrant A | 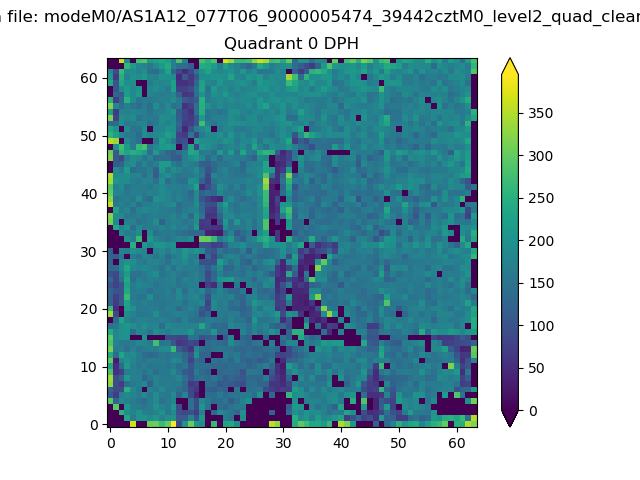 |
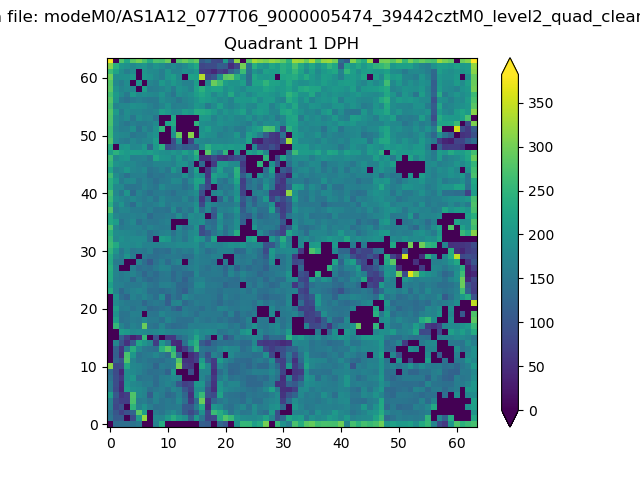 |
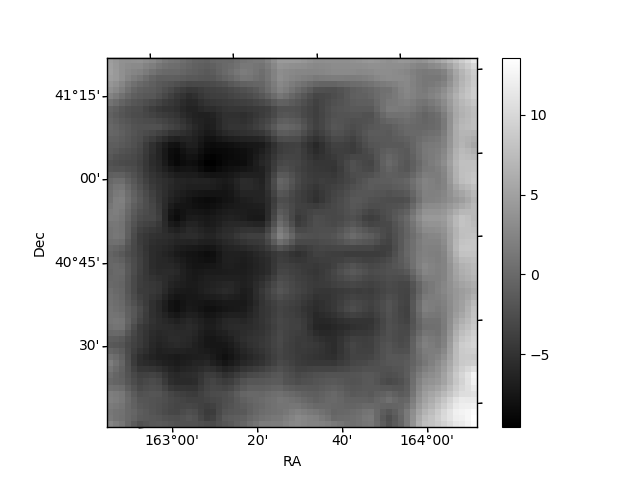
Quadrant B |
|---|---|---|---|
| Quadrant D | 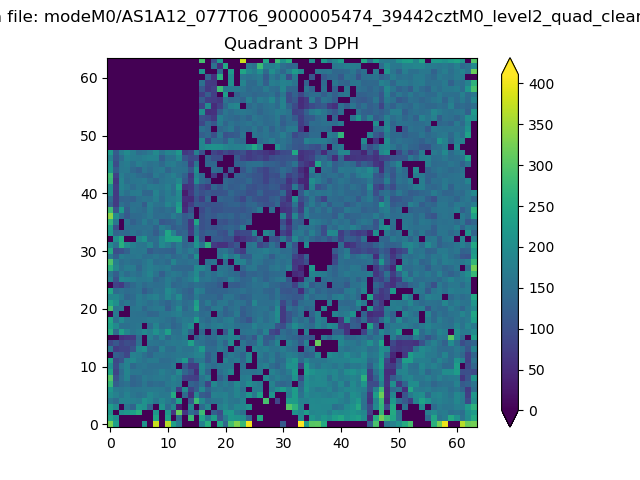 |
 |
Quadrant C |
| Plot type | Count rate plots | Images |
|---|---|---|
| Comparison with Poisson distribution Blue bars denote a histogram of data divided into 1 sec bins. Red curve is a Poisson curve with rate = median count rate of data. |
 |
 |
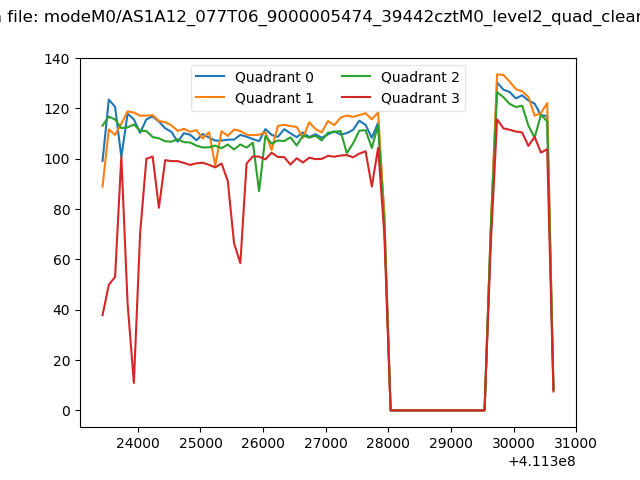
| Quadrant-wise count rates Data is divided into 100 sec bins |
 |
|
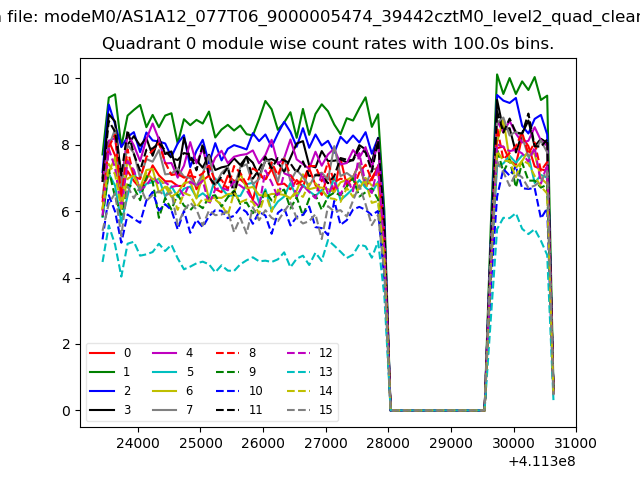
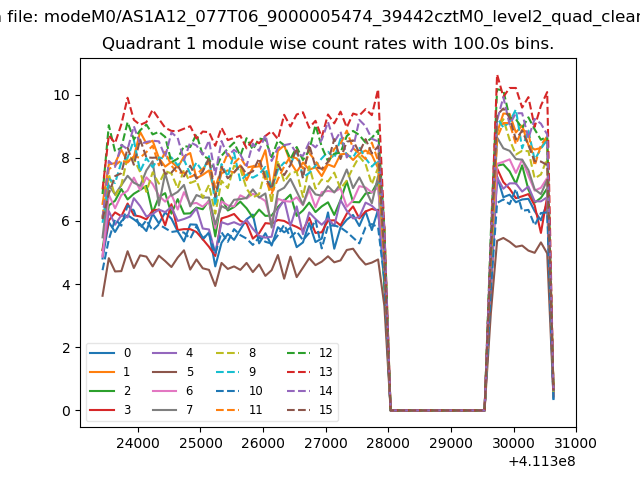
| Module-wise count rates for Quadrant A Data is divided into 100 sec bins |
 |
 |
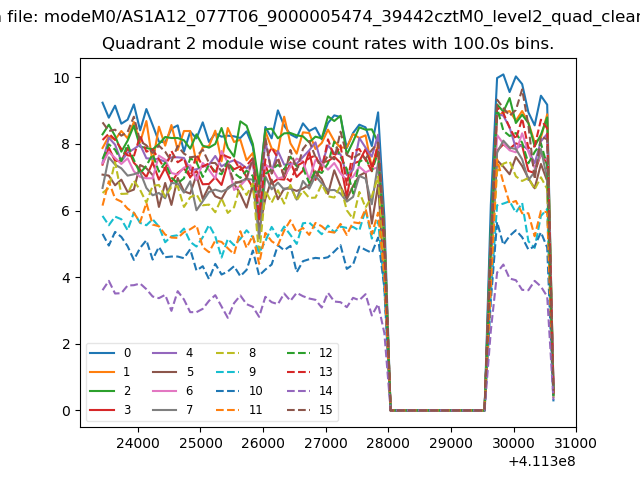
| Module-wise count rates for Quadrant B Data is divided into 100 sec bins |
 |
 |
| Module-wise count rates for Quadrant C Data is divided into 100 sec bins |
 |
 |
| Module-wise count rates for Quadrant D Data is divided into 100 sec bins |
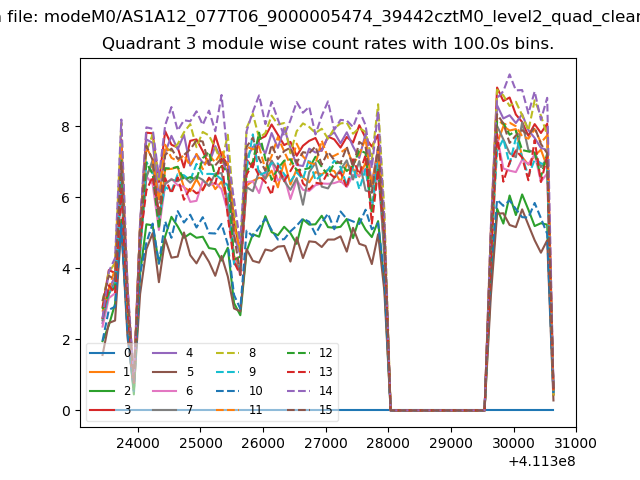 |
 |
| Parameter | Plot |
|---|---|
| CZT HV Monitor | 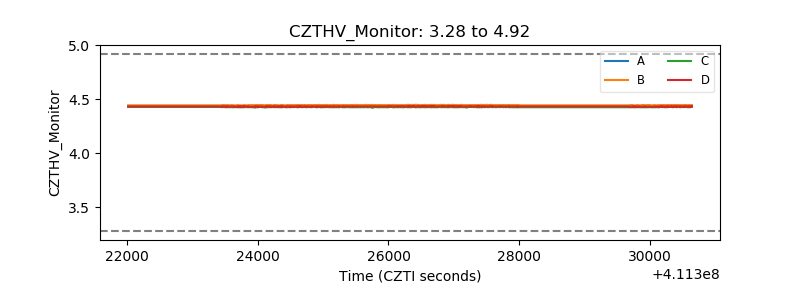 |
| D_VDD | 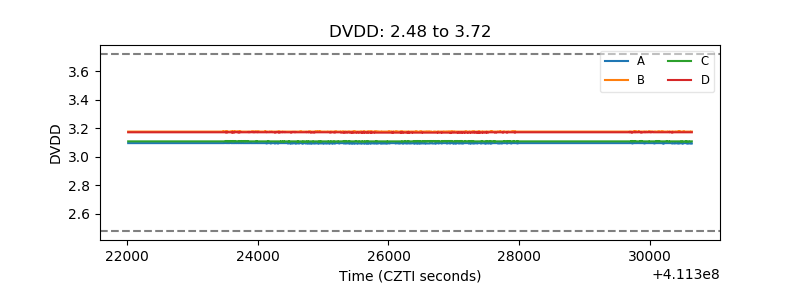 |
| Temperature 1 | 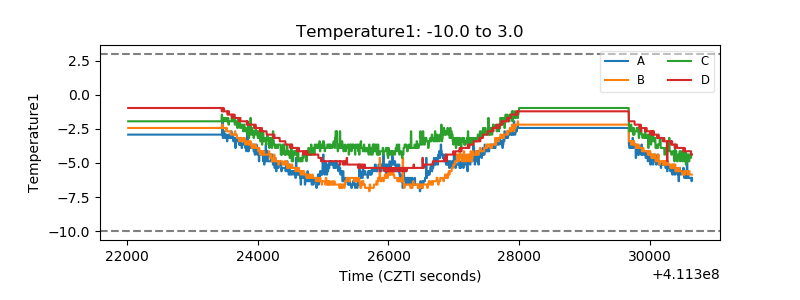 |
| Veto HV Monitor | 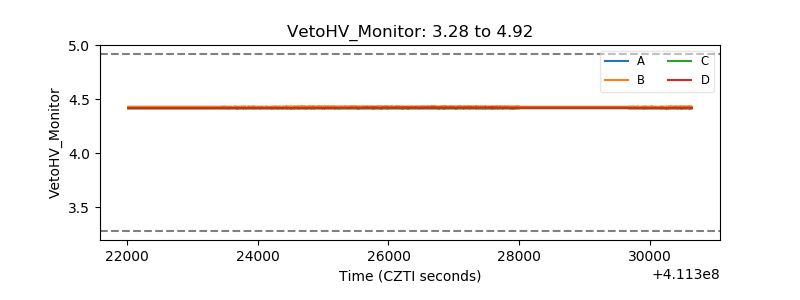 |
| Veto LLD | 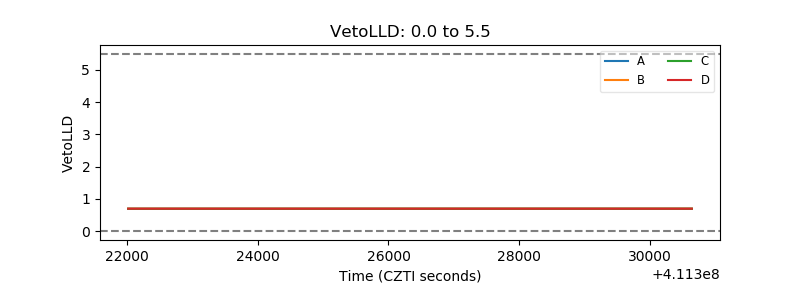 |
| Alpha Counter | 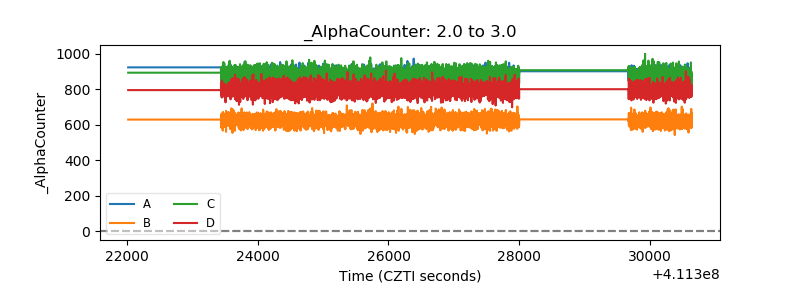 |
| _CPM_Rate | 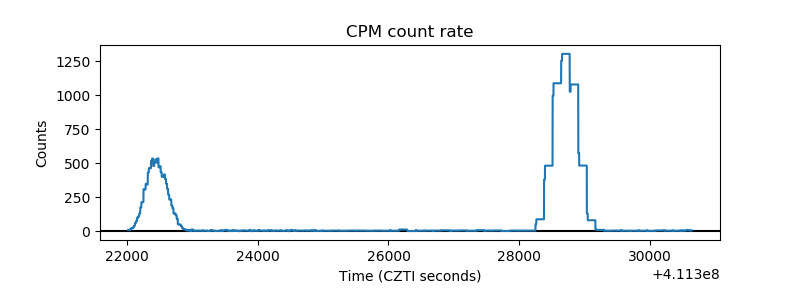 |
| CZT Counter | 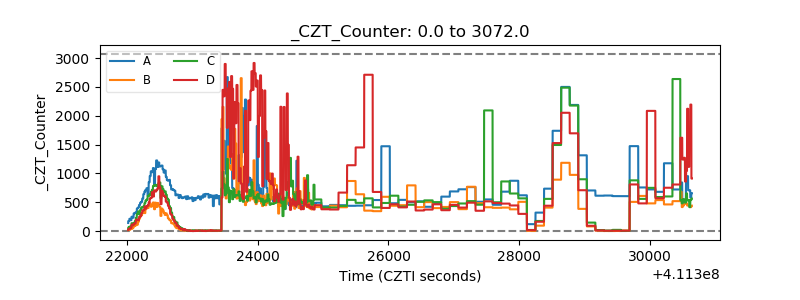 |
| +2.5 Volts monitor | 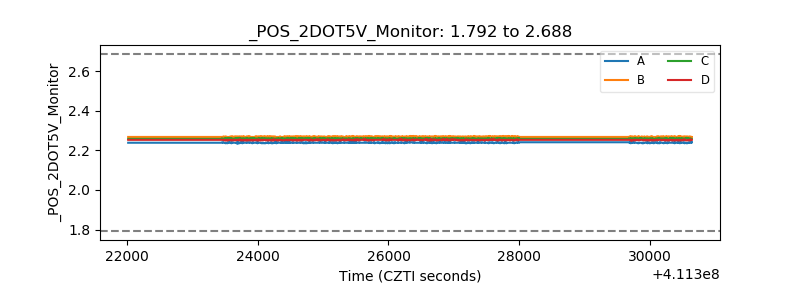 |
| +5 Volts monitor | 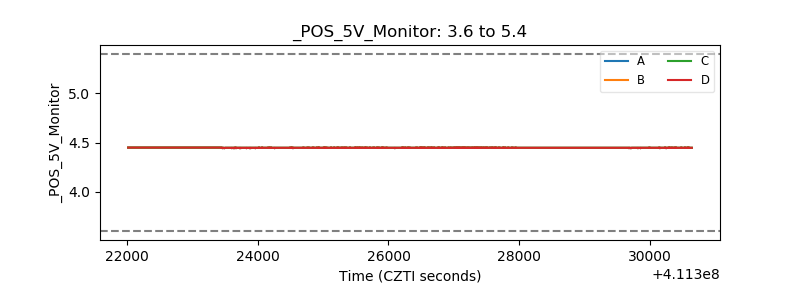 |
| _ROLL_ROT | 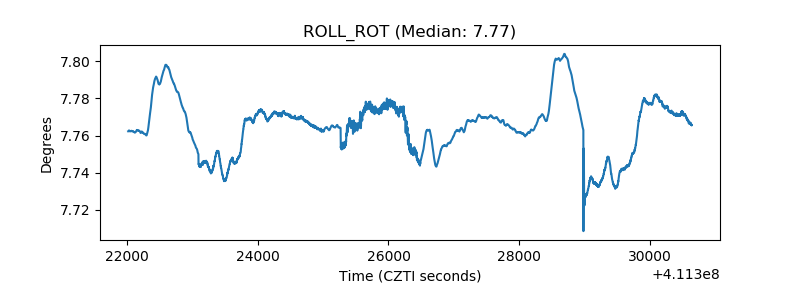 |
| _Roll_DEC | 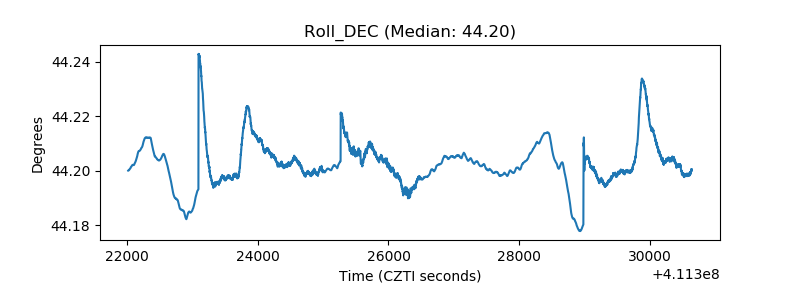 |
| _Roll_RA | 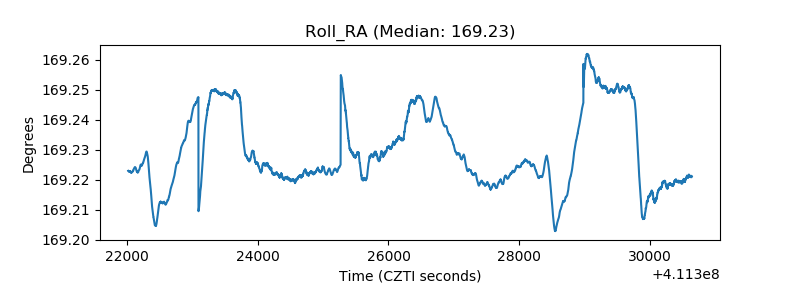 |
| Veto Counter | 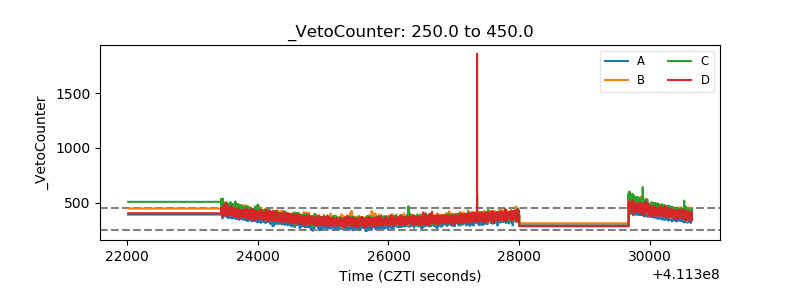 |