| Param | Original file | Final file |
|---|---|---|
| Filename | modeM0/AS1A12_077T06_9000005474_39445cztM0_level2.fits | modeM0/AS1A12_077T06_9000005474_39445cztM0_level2_quad_clean.evt |
| Size (bytes) | 328,504,320 | 85,495,680 |
| Size | 313.3 MB | 81.5 MB |
| Events in quadrant A | 3,399,321 | 572,408 |
| Events in quadrant B | 2,548,623 | 590,023 |
| Events in quadrant C | 2,775,849 | 563,515 |
| Events in quadrant D | 3,051,652 | 516,580 |
| Mode M0 | |||
|---|---|---|---|
| Quadrant | BADHDUFLAG | Total packets | Discarded packets |
| A | 0 | 13386 | 2 |
| B | 0 | 10911 | 2 |
| C | 0 | 11484 | 2 |
| D | 0 | 12516 | 2 |
| Mode SS | |||
|---|---|---|---|
| Quadrant | BADHDUFLAG | Total packets | Discarded packets |
| A | 0 | 102 | 0 |
| B | 0 | 102 | 0 |
| C | 0 | 102 | 0 |
| D | 0 | 102 | 0 |
| Mode M9 | |||
|---|---|---|---|
| Quadrant | BADHDUFLAG | Total packets | Discarded packets |
| A | 0 | 35 | 0 |
| B | 0 | 35 | 0 |
| C | 0 | 35 | 0 |
| D | 0 | 35 | 0 |
| Quadrant | Total seconds | Saturated seconds | Saturation percentage |
|---|---|---|---|
| A | 4941 | 48 | 0.971463% |
| B | 4941 | 29 | 0.586926% |
| C | 4941 | 37 | 0.748836% |
| D | 4941 | 72 | 1.457195% |
Noise dominated data is calculated using 1-second bins in cleaned event files. If a bin has >2000 counts, and if more than 50% of those come from <1% of pixels, then it is considered to be noise-dominated and hence unusable.
| Quadrant | # 1 sec bins | Bins with >0 counts | Bins with >2000 counts | High rate bins dominated by noise | Noise dominated (total time) | Noise dominated (detector-on time) | Marked lightcurve |
|---|---|---|---|---|---|---|---|
| A | 8437 | 4943 | 33 | 33 | 0.39% | 0.67% | 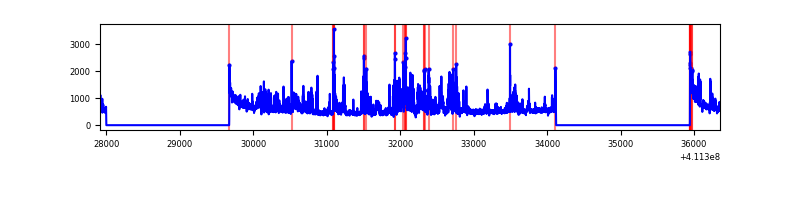 |
| B | 8437 | 4943 | 12 | 12 | 0.14% | 0.24% | 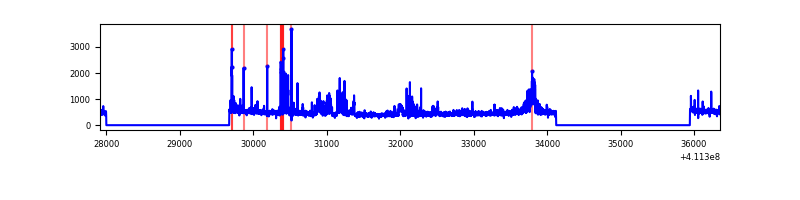 |
| C | 8437 | 4943 | 28 | 28 | 0.33% | 0.57% | 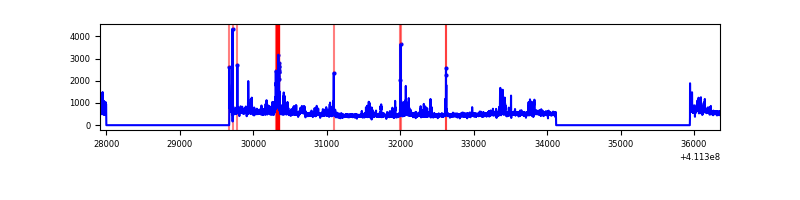 |
| D | 8437 | 4943 | 78 | 78 | 0.92% | 1.58% | 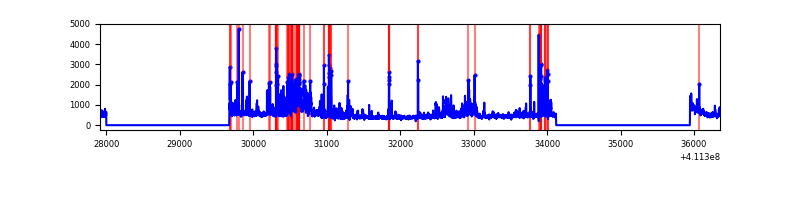 |
Top three noisy pixels from each quadrant. If the there are fewer than three noisy pixels in the level2.evt file, extra rows are filled as -1
| Pixel properties | Quadrant properties | ||||||
|---|---|---|---|---|---|---|---|
| Quadrant | DetID | PixID | Counts | Sigma | Mean | Median | Sigma |
| A | 15 | 222 | 802358 | 7080.42 | 552 | 541 | 113.2 |
| A | 10 | 83 | 412103 | 3634.28 | 552 | 541 | 113.2 |
| A | 9 | 143 | 30541 | 264.91 | 552 | 541 | 113.2 |
| B | 5 | 255 | 208068 | 1949.63 | 552 | 537 | 106.4 |
| B | 8 | 3 | 100509 | 939.18 | 552 | 537 | 106.4 |
| B | 5 | 172 | 56936 | 529.84 | 552 | 537 | 106.4 |
| C | 15 | 214 | 205795 | 1619.32 | 542 | 545 | 126.8 |
| C | 9 | 187 | 194867 | 1533.1 | 542 | 545 | 126.8 |
| C | 15 | 208 | 174768 | 1374.53 | 542 | 545 | 126.8 |
| D | 1 | 52 | 333854 | 2551.77 | 537 | 523 | 130.6 |
| D | 12 | 0 | 145228 | 1107.77 | 537 | 523 | 130.6 |
| D | 2 | 249 | 141578 | 1079.83 | 537 | 523 | 130.6 |
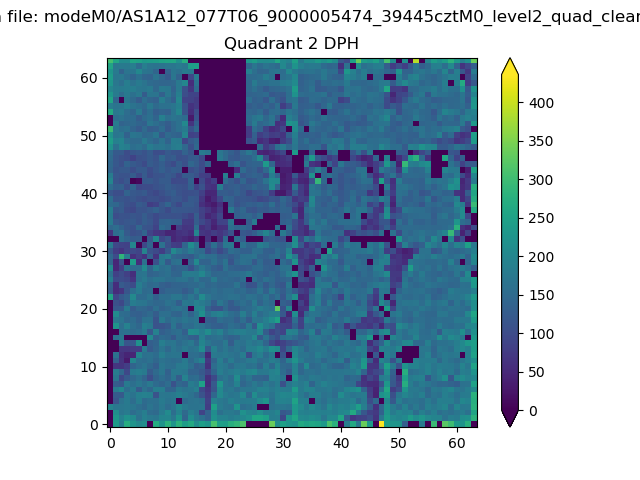
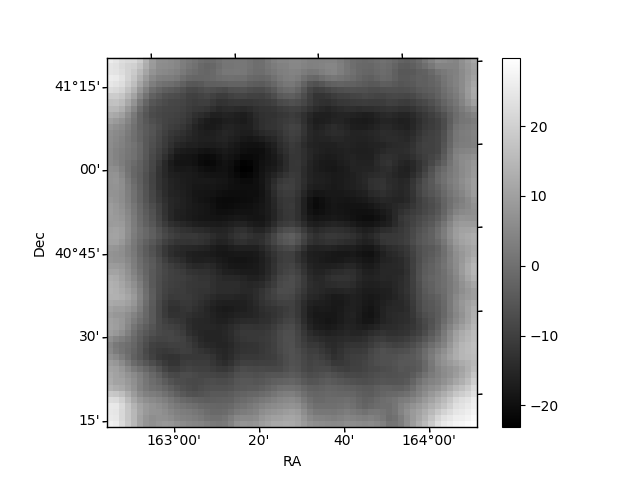
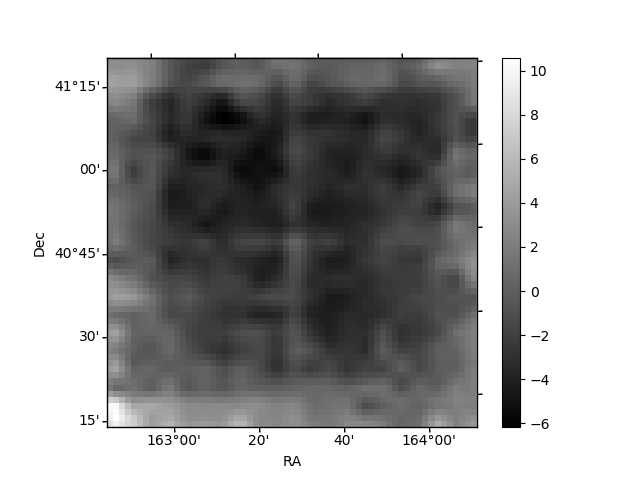
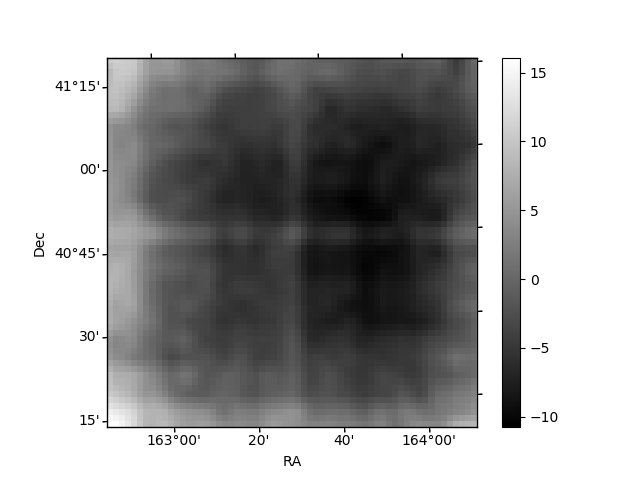
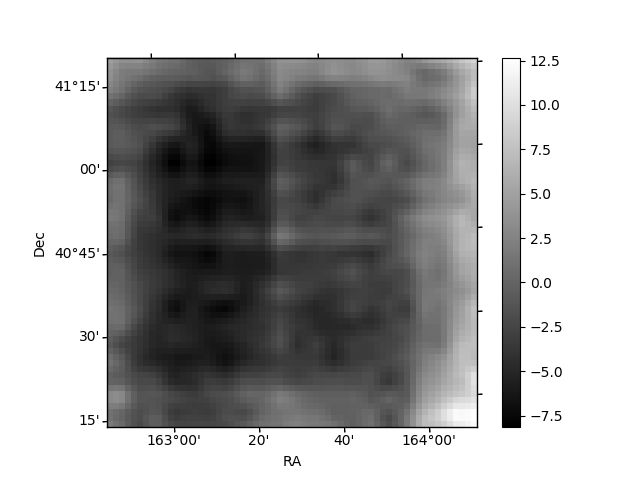
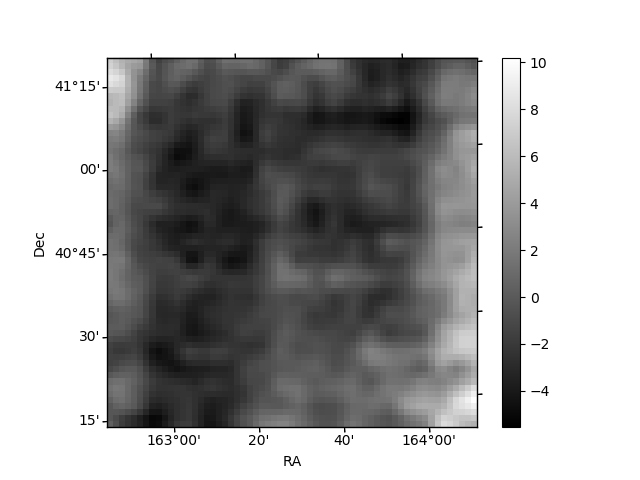
Histogram calculated using DETX and DETY for each event in the final _common_clean file
| Quadrant A | 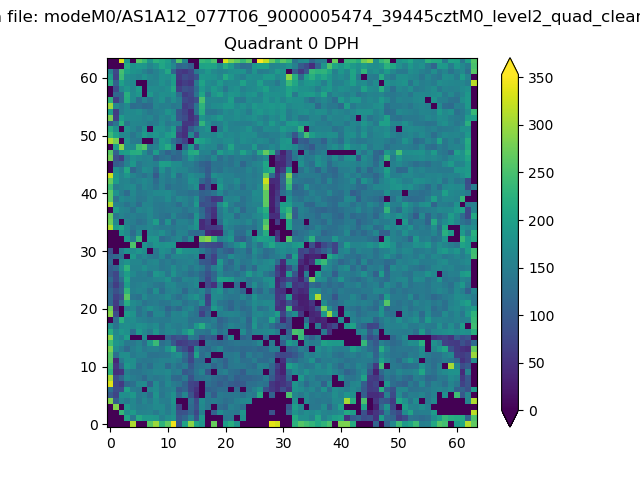 |
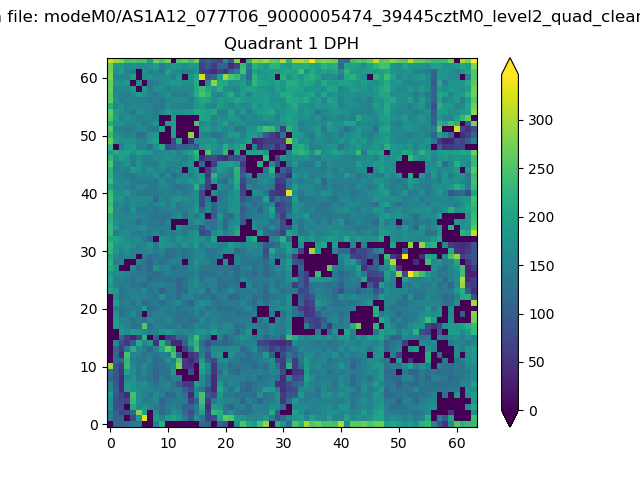 |
Quadrant B |
|---|---|---|---|
| Quadrant D | 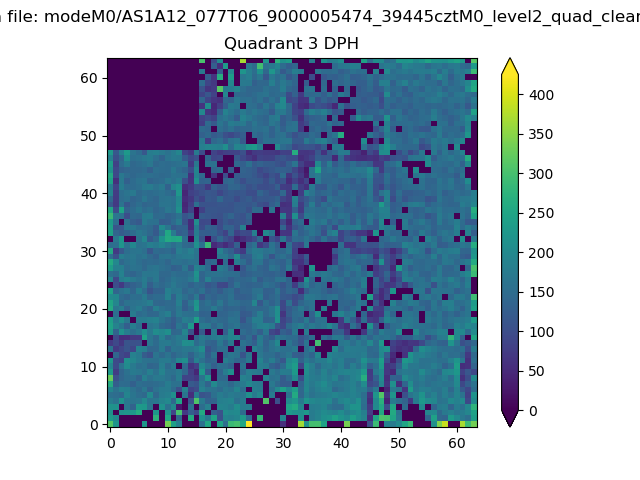 |
 |
Quadrant C |
| Plot type | Count rate plots | Images |
|---|---|---|
| Comparison with Poisson distribution Blue bars denote a histogram of data divided into 1 sec bins. Red curve is a Poisson curve with rate = median count rate of data. |
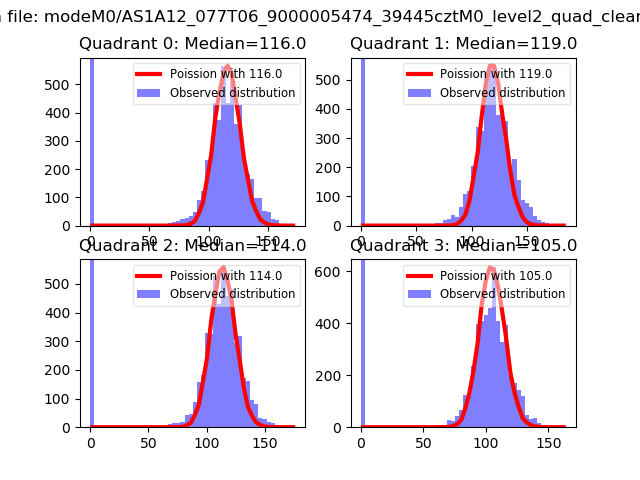 |
 |
| Quadrant-wise count rates Data is divided into 100 sec bins |
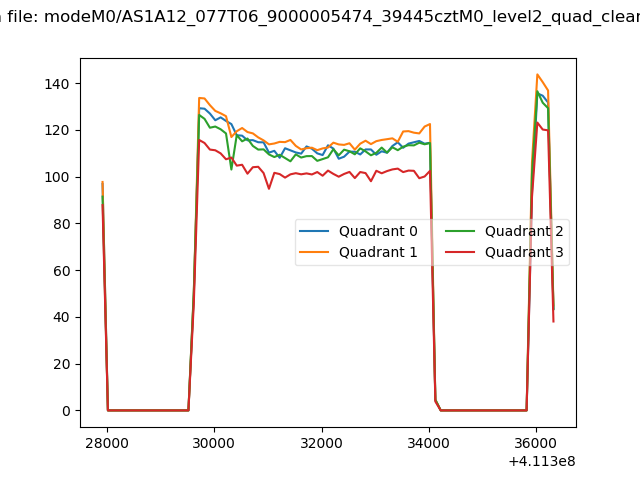 |
|
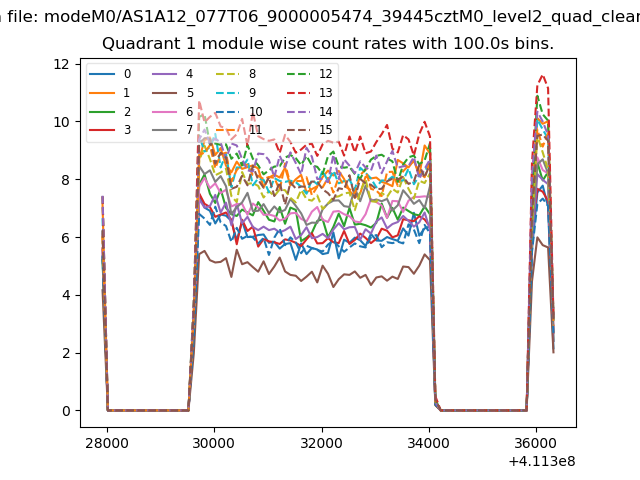
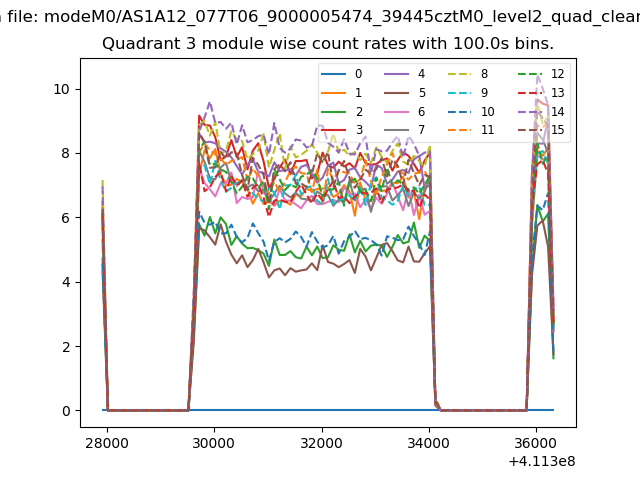
| Module-wise count rates for Quadrant A Data is divided into 100 sec bins |
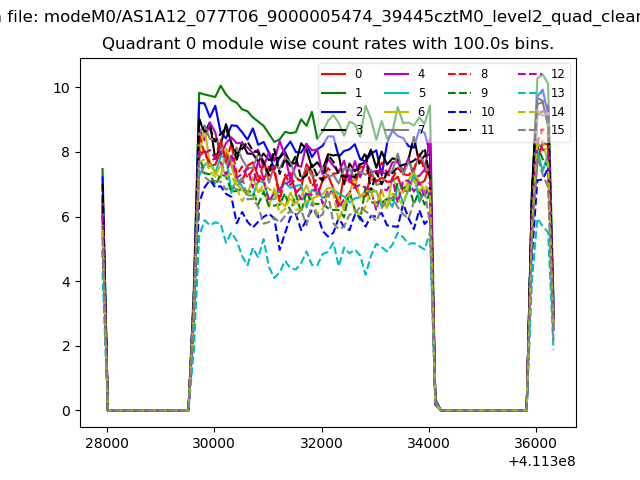 |
 |
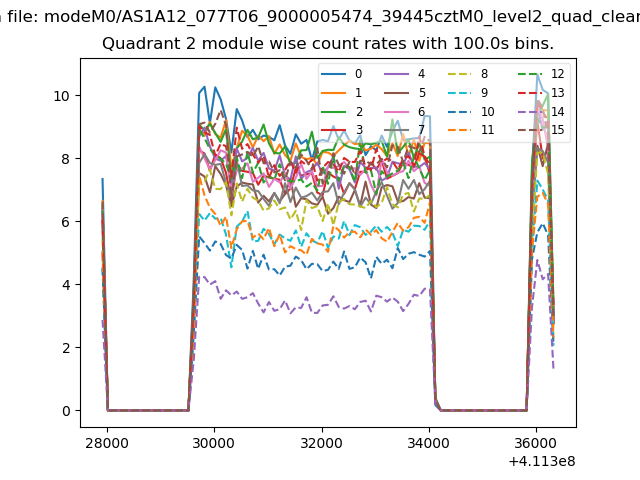
| Module-wise count rates for Quadrant B Data is divided into 100 sec bins |
 |
 |
| Module-wise count rates for Quadrant C Data is divided into 100 sec bins |
 |
 |
| Module-wise count rates for Quadrant D Data is divided into 100 sec bins |
 |
 |
| Parameter | Plot |
|---|---|
| CZT HV Monitor | 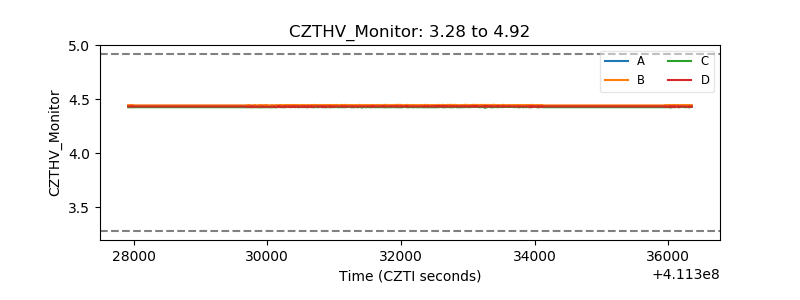 |
| D_VDD | 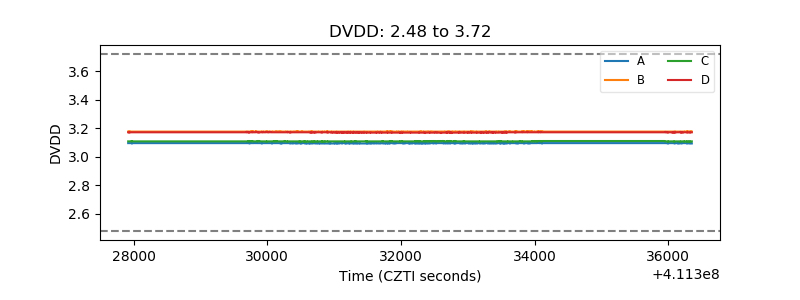 |
| Temperature 1 | 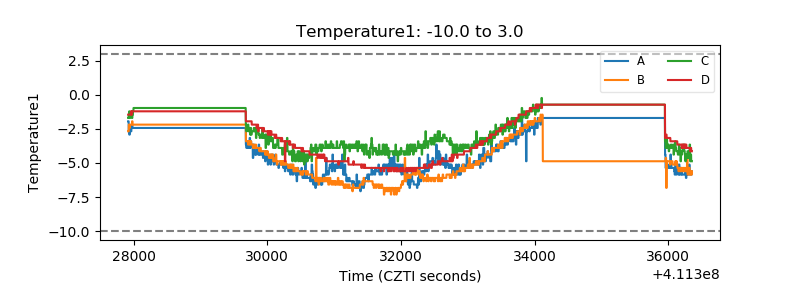 |
| Veto HV Monitor |  |
| Veto LLD | 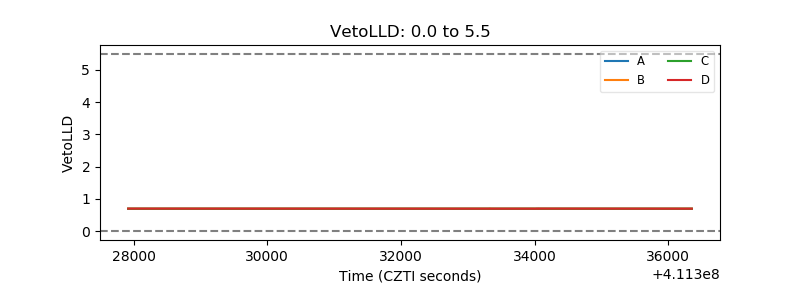 |
| Alpha Counter | 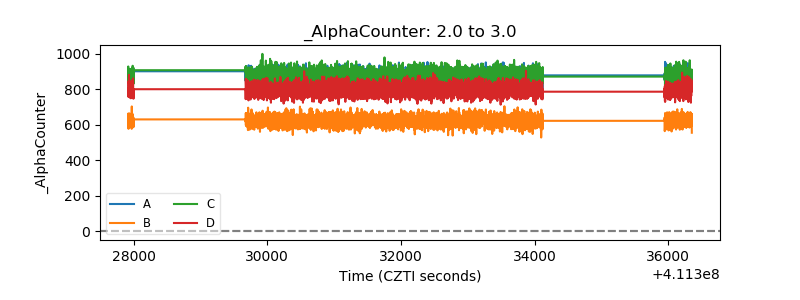 |
| _CPM_Rate | 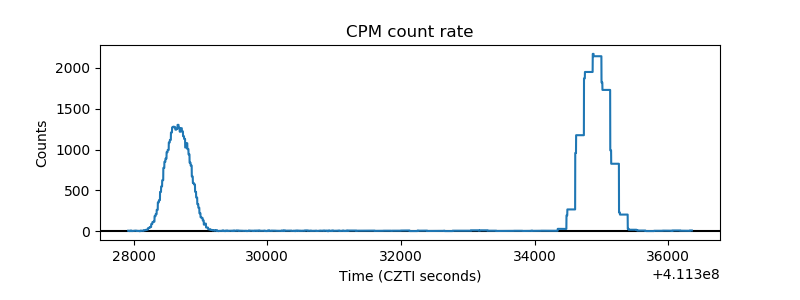 |
| CZT Counter | 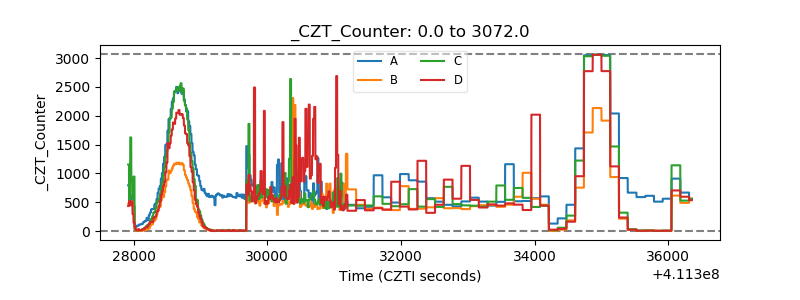 |
| +2.5 Volts monitor |  |
| +5 Volts monitor | 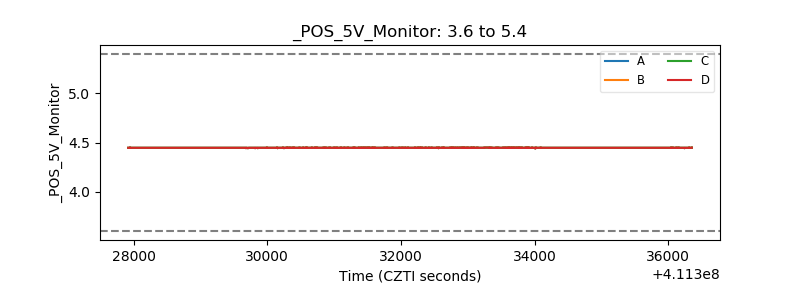 |
| _ROLL_ROT | 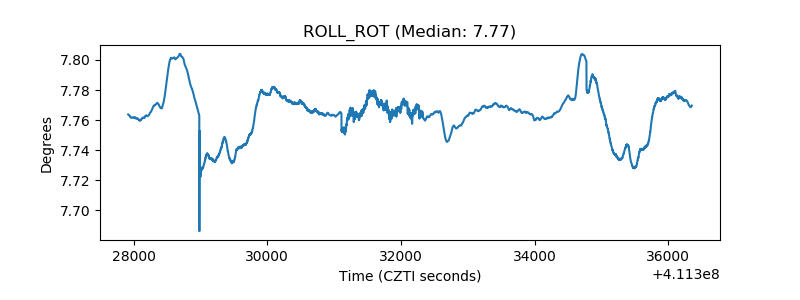 |
| _Roll_DEC | 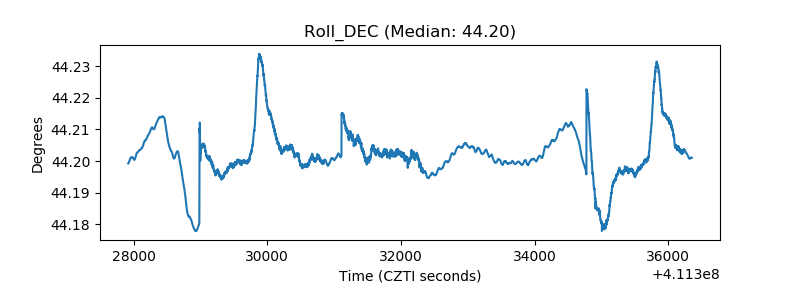 |
| _Roll_RA | 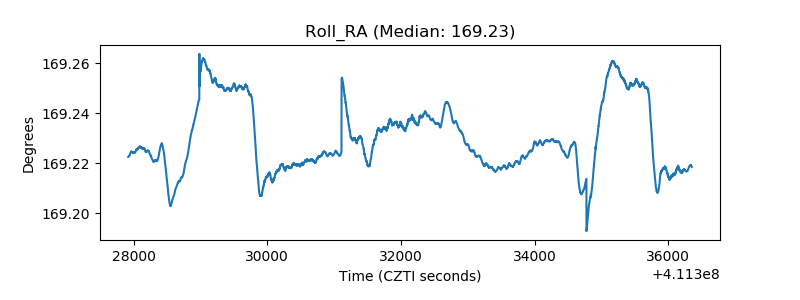 |
| Veto Counter | 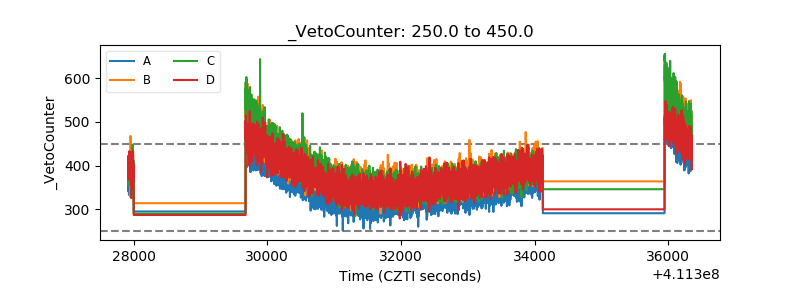 |