| Param | Original file | Final file |
|---|---|---|
| Filename | modeM0/AS1A12_025T17_9000005476_39445cztM0_level2.fits | modeM0/AS1A12_025T17_9000005476_39445cztM0_level2_quad_clean.evt |
| Size (bytes) | 296,933,760 | 63,089,280 |
| Size | 283.2 MB | 60.2 MB |
| Events in quadrant A | 3,468,853 | 401,454 |
| Events in quadrant B | 2,290,256 | 446,284 |
| Events in quadrant C | 2,173,926 | 438,382 |
| Events in quadrant D | 2,772,650 | 365,702 |
| Mode M0 | |||
|---|---|---|---|
| Quadrant | BADHDUFLAG | Total packets | Discarded packets |
| A | 0 | 12540 | 2 |
| B | 0 | 9060 | 1 |
| C | 0 | 8755 | 1 |
| D | 0 | 10670 | 1 |
| Mode SS | |||
|---|---|---|---|
| Quadrant | BADHDUFLAG | Total packets | Discarded packets |
| A | 0 | 74 | 0 |
| B | 0 | 74 | 0 |
| C | 0 | 74 | 0 |
| D | 0 | 74 | 0 |
| Mode M9 | |||
|---|---|---|---|
| Quadrant | BADHDUFLAG | Total packets | Discarded packets |
| A | 0 | 20 | 0 |
| B | 0 | 20 | 0 |
| C | 0 | 20 | 0 |
| D | 0 | 20 | 0 |
| Quadrant | Total seconds | Saturated seconds | Saturation percentage |
|---|---|---|---|
| A | 3660 | 423 | 11.557377% |
| B | 3660 | 160 | 4.371585% |
| C | 3660 | 18 | 0.491803% |
| D | 3660 | 349 | 9.535519% |
Noise dominated data is calculated using 1-second bins in cleaned event files. If a bin has >2000 counts, and if more than 50% of those come from <1% of pixels, then it is considered to be noise-dominated and hence unusable.
| Quadrant | # 1 sec bins | Bins with >0 counts | Bins with >2000 counts | High rate bins dominated by noise | Noise dominated (total time) | Noise dominated (detector-on time) | Marked lightcurve |
|---|---|---|---|---|---|---|---|
| A | 5603 | 3661 | 481 | 481 | 8.58% | 13.14% | 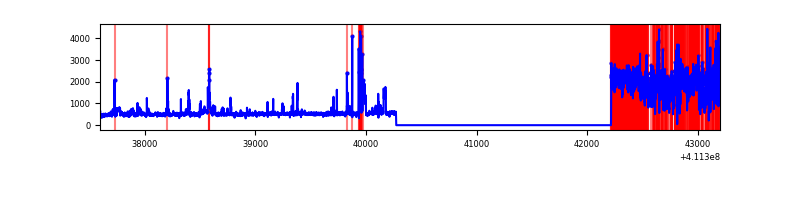 |
| B | 5603 | 3661 | 99 | 99 | 1.77% | 2.70% | 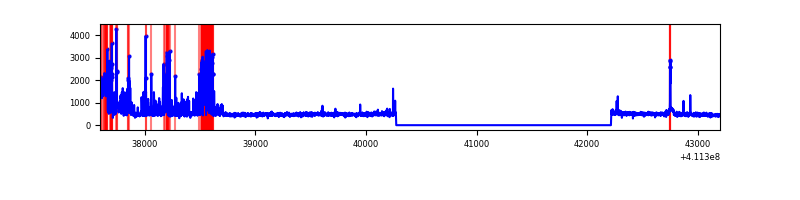 |
| C | 5603 | 3661 | 10 | 10 | 0.18% | 0.27% | 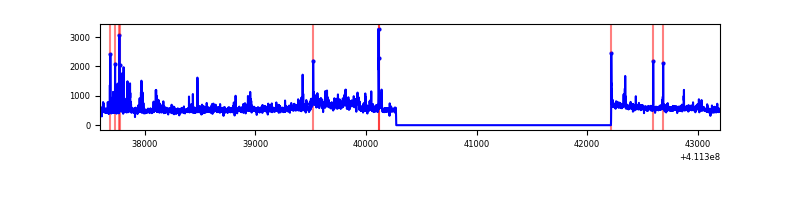 |
| D | 5603 | 3661 | 276 | 276 | 4.93% | 7.54% | 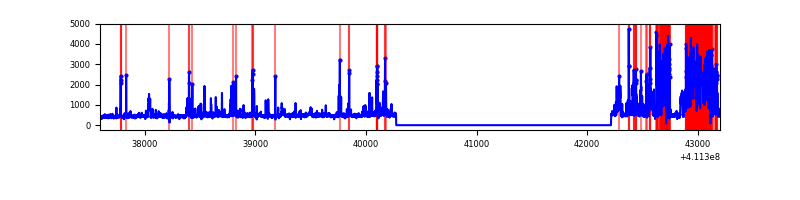 |
Top three noisy pixels from each quadrant. If the there are fewer than three noisy pixels in the level2.evt file, extra rows are filled as -1
| Pixel properties | Quadrant properties | ||||||
|---|---|---|---|---|---|---|---|
| Quadrant | DetID | PixID | Counts | Sigma | Mean | Median | Sigma |
| A | 15 | 222 | 1576262 | 18267.87 | 419 | 412 | 86.3 |
| A | 10 | 83 | 252218 | 2919.03 | 419 | 412 | 86.3 |
| A | 12 | 189 | 10855 | 121.06 | 419 | 412 | 86.3 |
| B | 8 | 3 | 592296 | 7034.96 | 428 | 417 | 84.1 |
| B | 5 | 172 | 14839 | 171.42 | 428 | 417 | 84.1 |
| B | 12 | 111 | 10440 | 119.13 | 428 | 417 | 84.1 |
| C | 15 | 214 | 149248 | 1490.36 | 425 | 429 | 99.9 |
| C | 9 | 187 | 138013 | 1377.85 | 425 | 429 | 99.9 |
| C | 15 | 208 | 135407 | 1351.75 | 425 | 429 | 99.9 |
| D | 13 | 249 | 909850 | 9215.47 | 400 | 388 | 98.7 |
| D | 12 | 227 | 176024 | 1779.7 | 400 | 388 | 98.7 |
| D | 2 | 153 | 70578 | 711.23 | 400 | 388 | 98.7 |
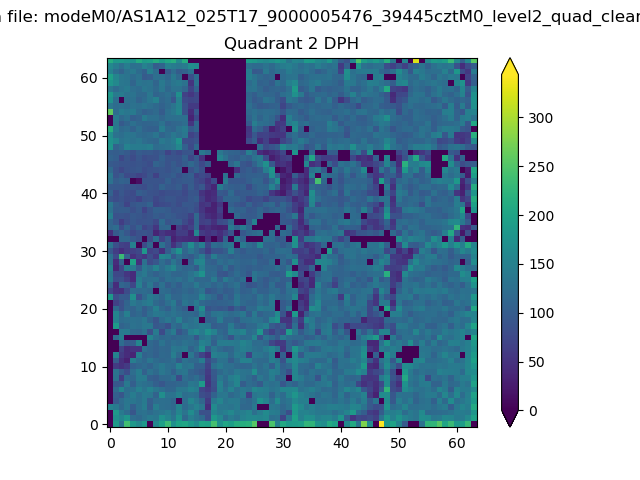
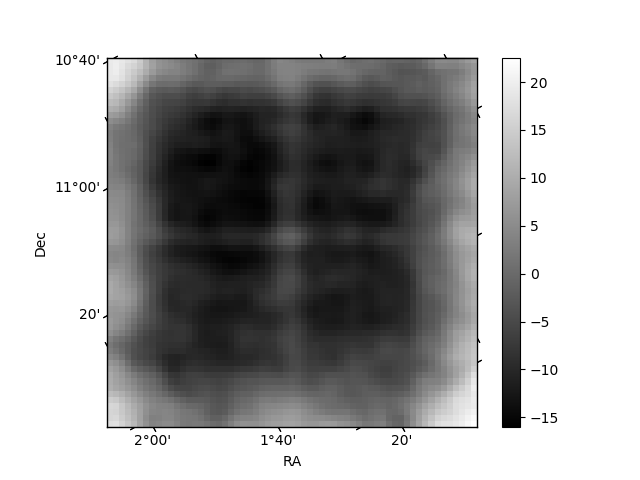
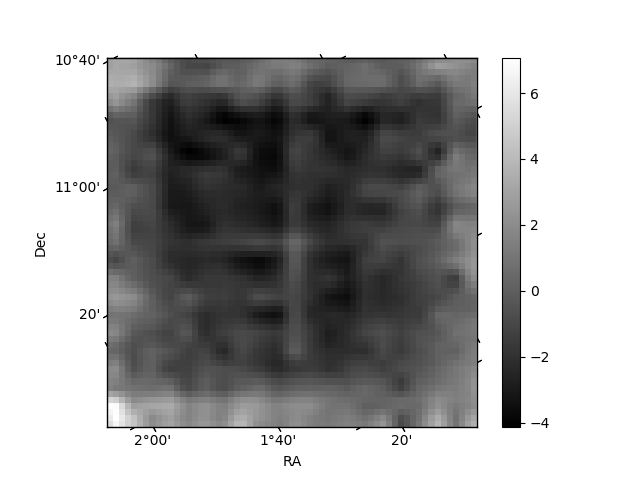
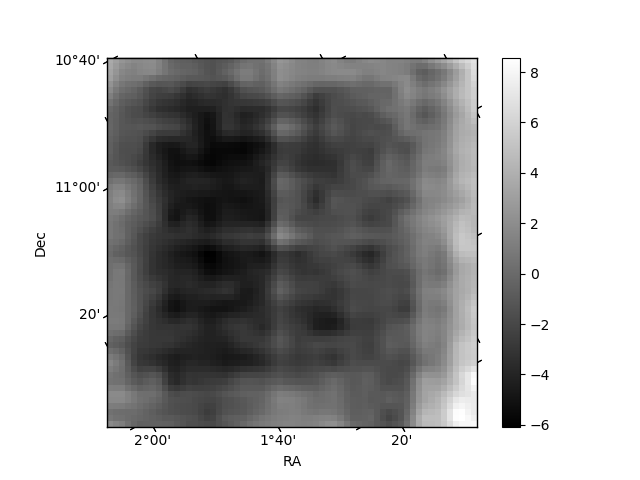
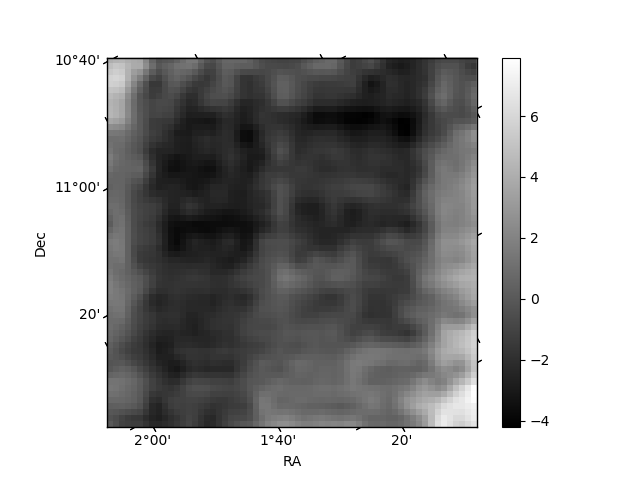
Histogram calculated using DETX and DETY for each event in the final _common_clean file
| Quadrant A | 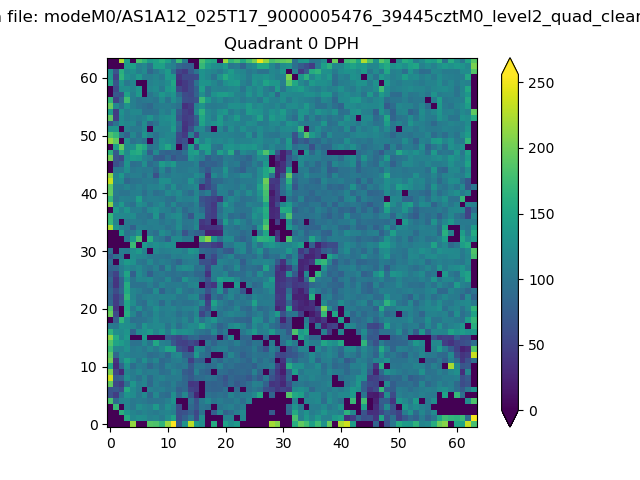 |
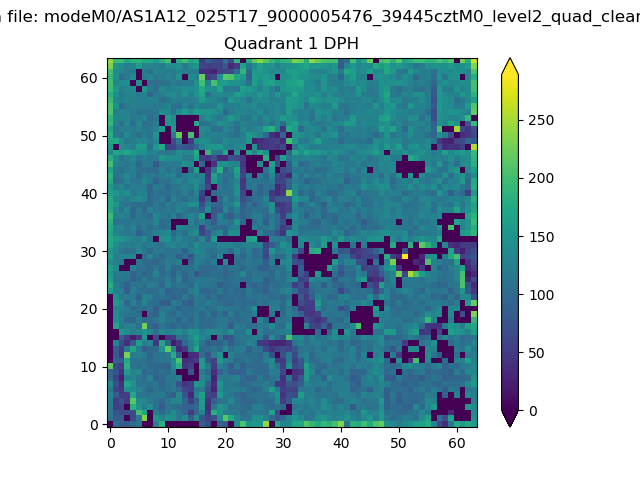 |
Quadrant B |
|---|---|---|---|
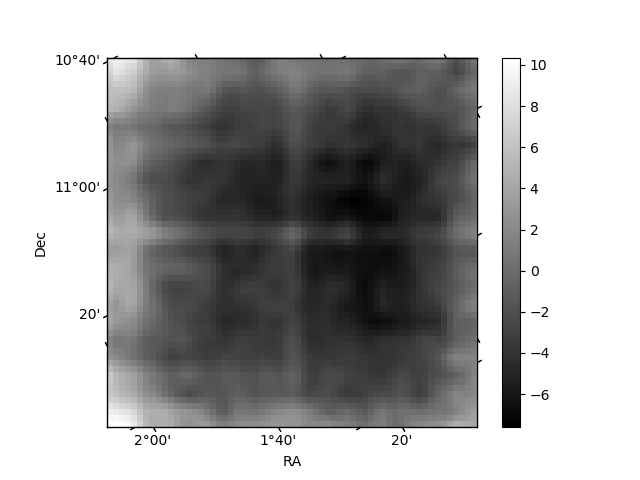
| Quadrant D | 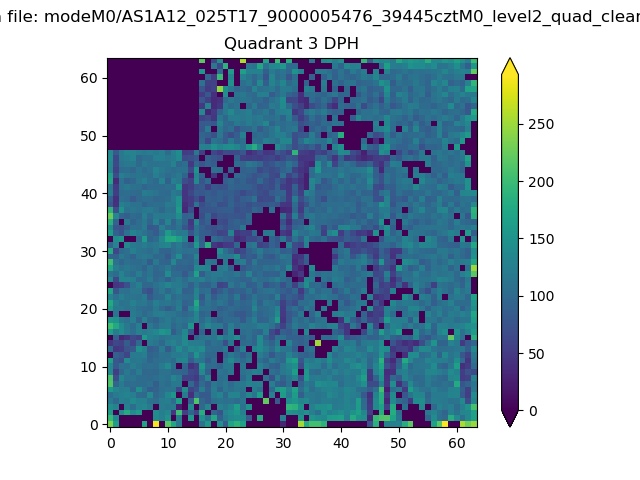 |
 |
Quadrant C |
| Plot type | Count rate plots | Images |
|---|---|---|
| Comparison with Poisson distribution Blue bars denote a histogram of data divided into 1 sec bins. Red curve is a Poisson curve with rate = median count rate of data. |
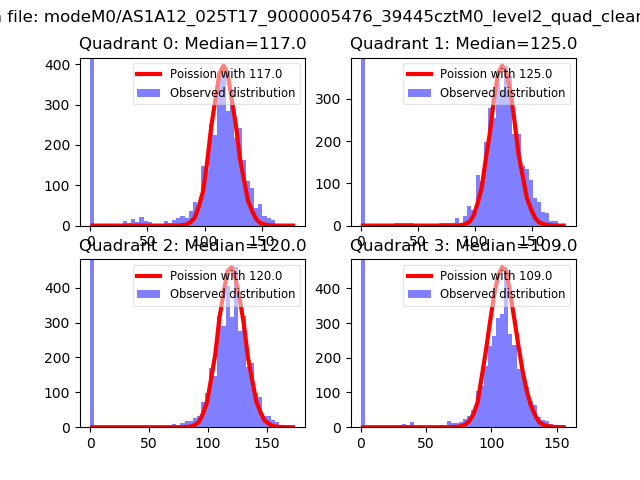 |
 |
| Quadrant-wise count rates Data is divided into 100 sec bins |
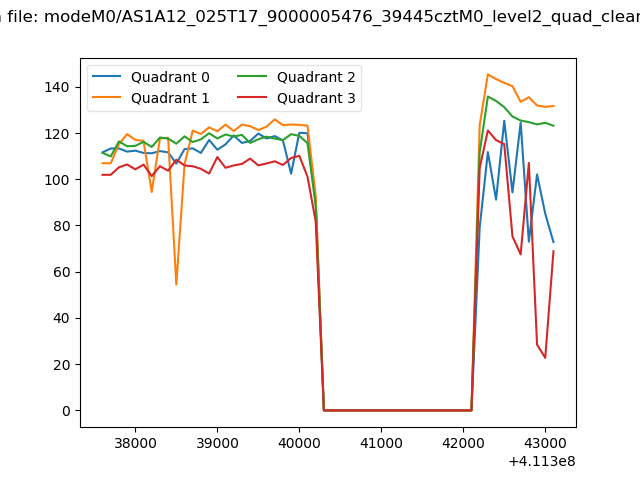 |
|
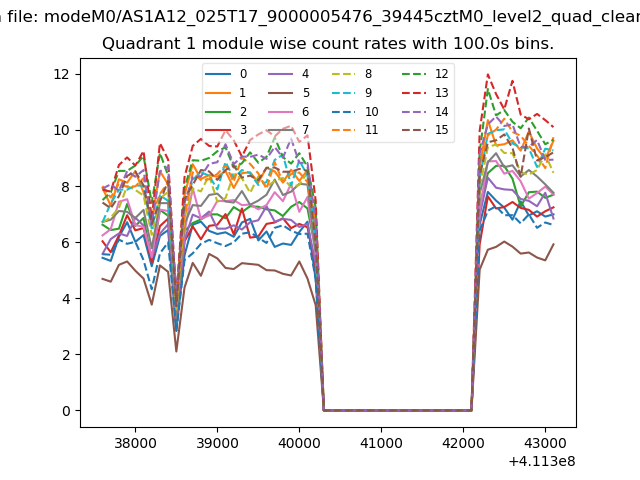
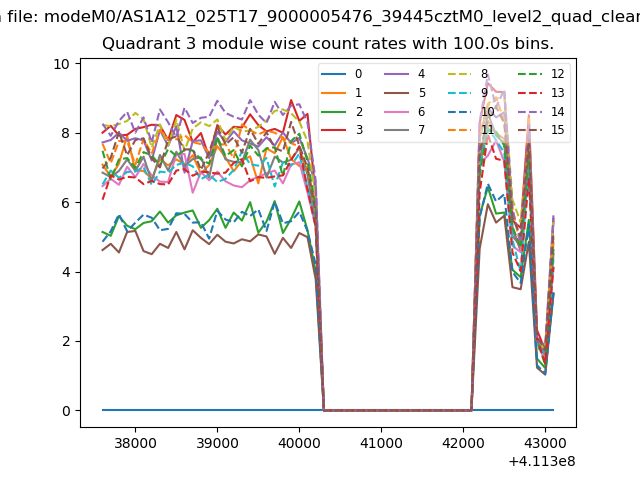
| Module-wise count rates for Quadrant A Data is divided into 100 sec bins |
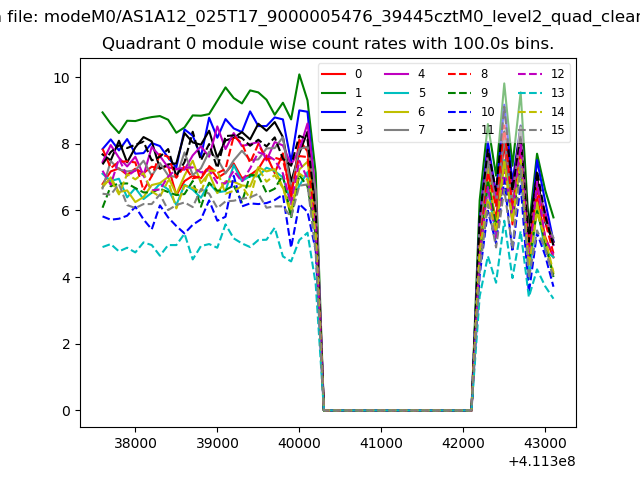 |
 |
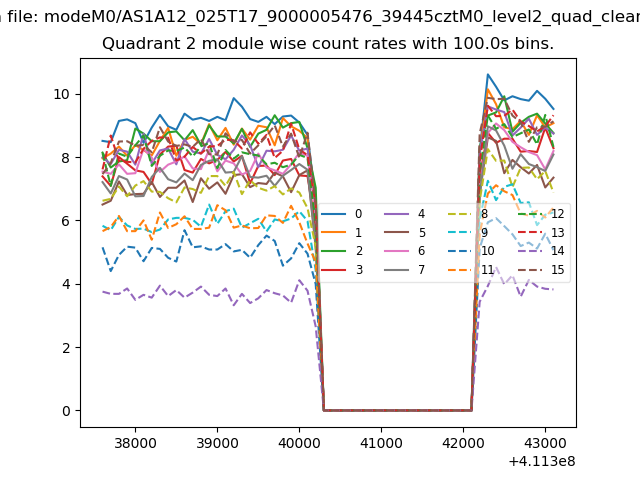
| Module-wise count rates for Quadrant B Data is divided into 100 sec bins |
 |
 |
| Module-wise count rates for Quadrant C Data is divided into 100 sec bins |
 |
 |
| Module-wise count rates for Quadrant D Data is divided into 100 sec bins |
 |
 |
| Parameter | Plot |
|---|---|
| CZT HV Monitor | 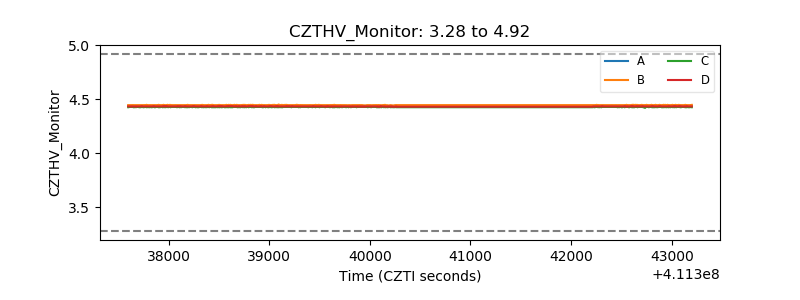 |
| D_VDD | 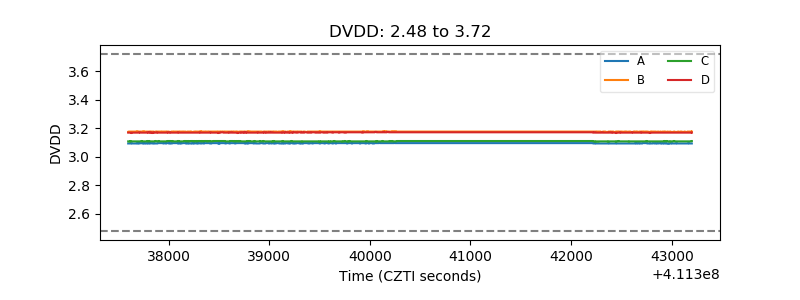 |
| Temperature 1 | 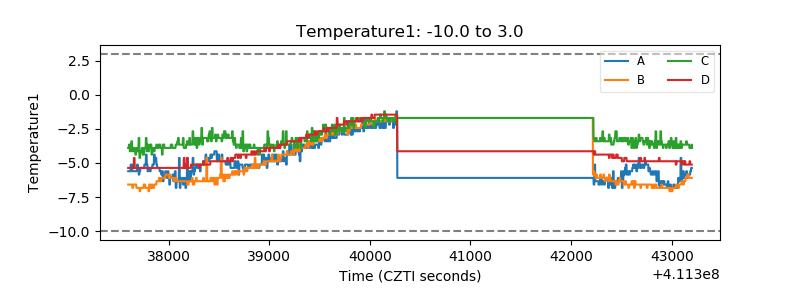 |
| Veto HV Monitor | 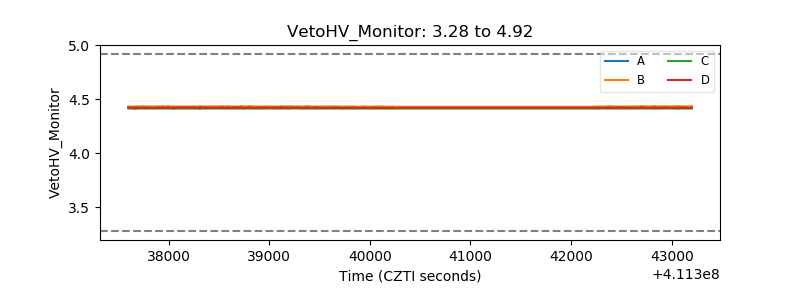 |
| Veto LLD | 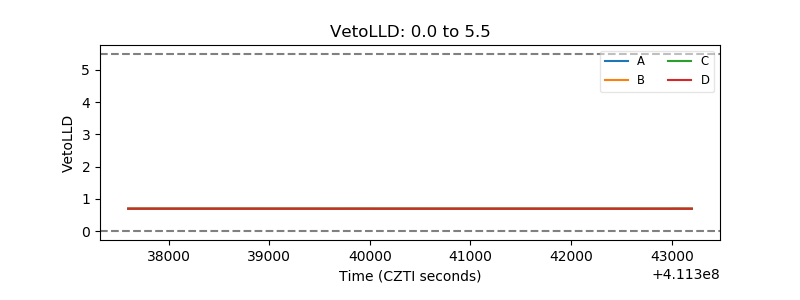 |
| Alpha Counter |  |
| _CPM_Rate | 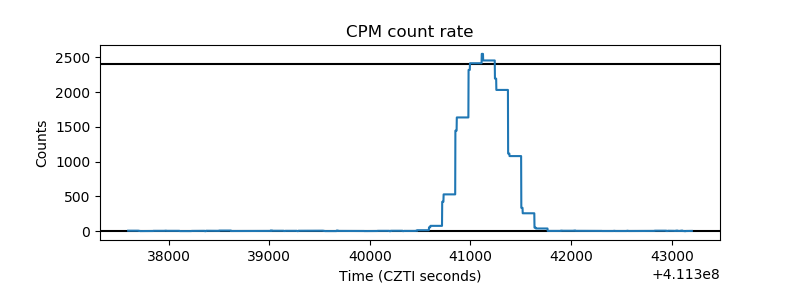 |
| CZT Counter | 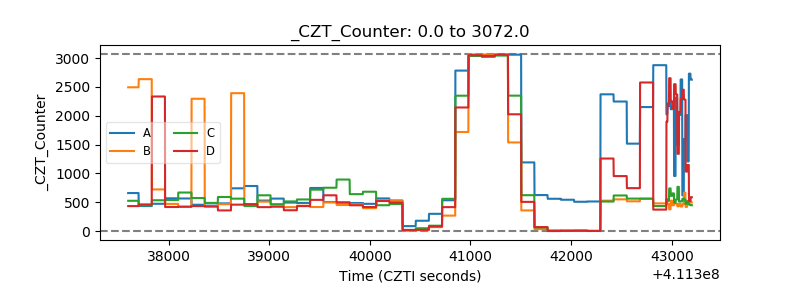 |
| +2.5 Volts monitor | 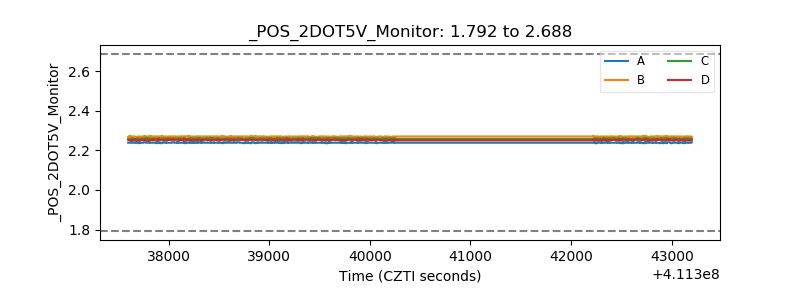 |
| +5 Volts monitor | 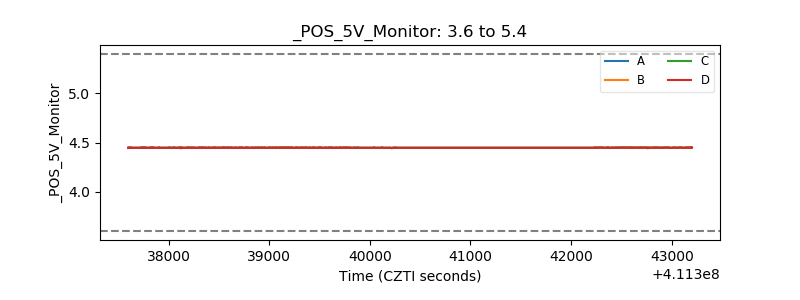 |
| _ROLL_ROT | 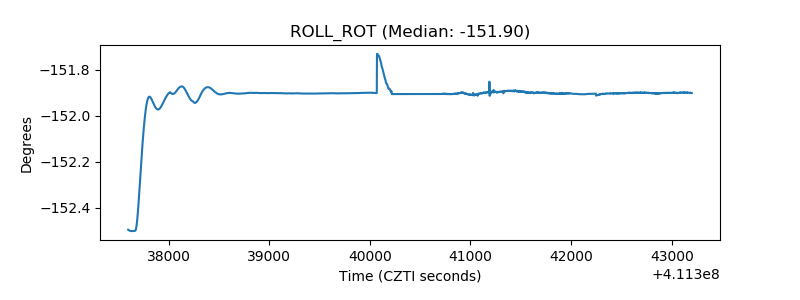 |
| _Roll_DEC | 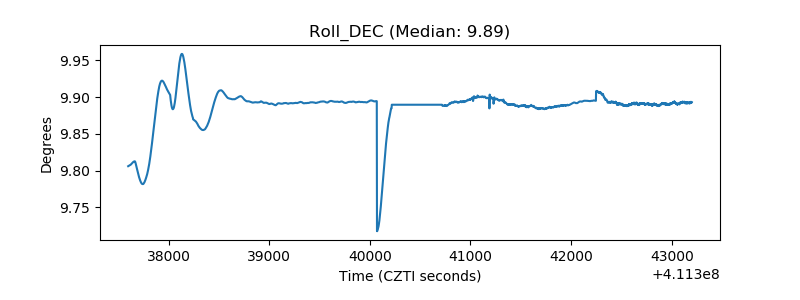 |
| _Roll_RA | 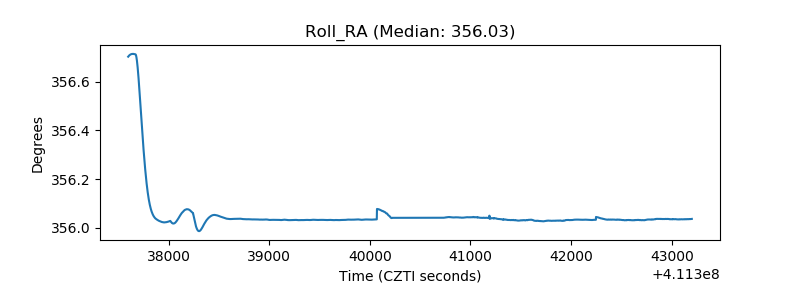 |
| Veto Counter | 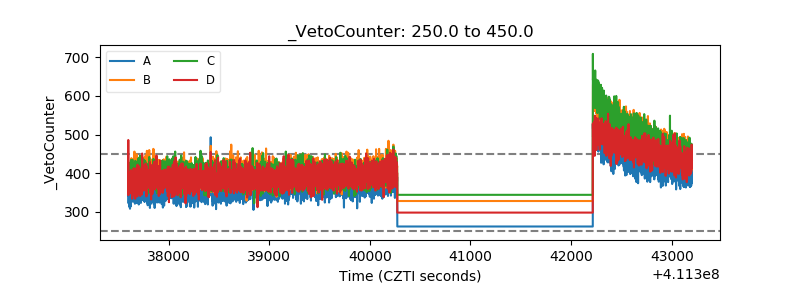 |