| Param | Original file | Final file |
|---|---|---|
| Filename | modeM0/AS1A12_025T17_9000005476_39446cztM0_level2.fits | modeM0/AS1A12_025T17_9000005476_39446cztM0_level2_quad_clean.evt |
| Size (bytes) | 445,930,560 | 91,002,240 |
| Size | 425.3 MB | 86.8 MB |
| Events in quadrant A | 6,683,764 | 529,667 |
| Events in quadrant B | 2,612,844 | 678,186 |
| Events in quadrant C | 3,000,168 | 639,996 |
| Events in quadrant D | 3,804,499 | 542,549 |
| Mode M0 | |||
|---|---|---|---|
| Quadrant | BADHDUFLAG | Total packets | Discarded packets |
| A | 0 | 23377 | 3 |
| B | 0 | 10913 | 2 |
| C | 0 | 11954 | 2 |
| D | 0 | 14698 | 2 |
| Mode SS | |||
|---|---|---|---|
| Quadrant | BADHDUFLAG | Total packets | Discarded packets |
| A | 0 | 106 | 0 |
| B | 0 | 106 | 0 |
| C | 0 | 106 | 0 |
| D | 0 | 106 | 0 |
| Mode M9 | |||
|---|---|---|---|
| Quadrant | BADHDUFLAG | Total packets | Discarded packets |
| A | 0 | 29 | 0 |
| B | 0 | 29 | 0 |
| C | 0 | 29 | 0 |
| D | 0 | 30 | 0 |
| Quadrant | Total seconds | Saturated seconds | Saturation percentage |
|---|---|---|---|
| A | 5215 | 1230 | 23.585810% |
| B | 5215 | 12 | 0.230105% |
| C | 5215 | 39 | 0.747843% |
| D | 5215 | 447 | 8.571429% |
Noise dominated data is calculated using 1-second bins in cleaned event files. If a bin has >2000 counts, and if more than 50% of those come from <1% of pixels, then it is considered to be noise-dominated and hence unusable.
| Quadrant | # 1 sec bins | Bins with >0 counts | Bins with >2000 counts | High rate bins dominated by noise | Noise dominated (total time) | Noise dominated (detector-on time) | Marked lightcurve |
|---|---|---|---|---|---|---|---|
| A | 7248 | 5216 | 1219 | 1219 | 16.82% | 23.37% | 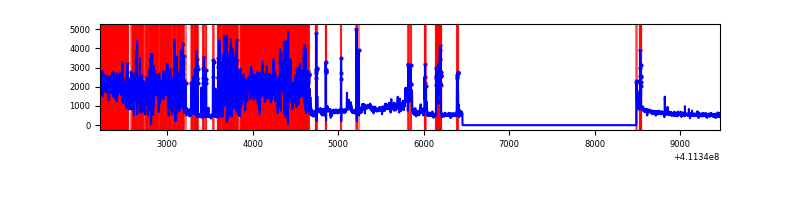 |
| B | 7248 | 5216 | 4 | 4 | 0.06% | 0.08% | 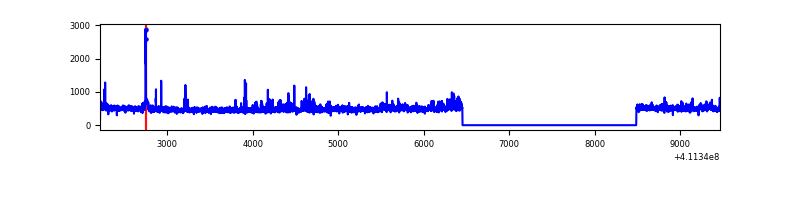 |
| C | 7248 | 5216 | 37 | 37 | 0.51% | 0.71% | 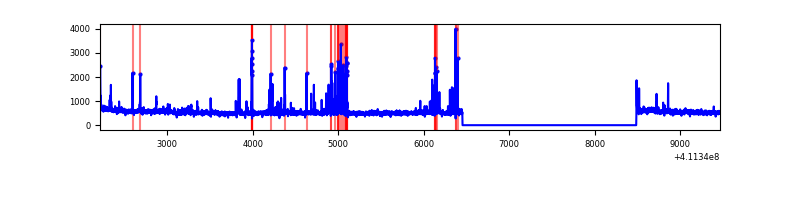 |
| D | 7248 | 5216 | 352 | 352 | 4.86% | 6.75% | 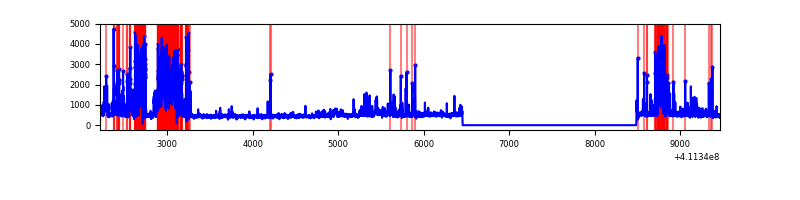 |
Top three noisy pixels from each quadrant. If the there are fewer than three noisy pixels in the level2.evt file, extra rows are filled as -1
| Pixel properties | Quadrant properties | ||||||
|---|---|---|---|---|---|---|---|
| Quadrant | DetID | PixID | Counts | Sigma | Mean | Median | Sigma |
| A | 15 | 222 | 4043213 | 34639.94 | 575 | 565 | 116.7 |
| A | 10 | 83 | 403301 | 3450.89 | 575 | 565 | 116.7 |
| A | 13 | 248 | 7512 | 59.53 | 575 | 565 | 116.7 |
| B | 5 | 172 | 89345 | 734.74 | 626 | 611 | 120.8 |
| B | 8 | 3 | 29020 | 235.23 | 626 | 611 | 120.8 |
| B | 0 | 199 | 27907 | 226.02 | 626 | 611 | 120.8 |
| C | 15 | 214 | 216950 | 1526.2 | 615 | 621 | 141.7 |
| C | 15 | 208 | 198217 | 1394.04 | 615 | 621 | 141.7 |
| C | 3 | 233 | 72668 | 508.29 | 615 | 621 | 141.7 |
| D | 13 | 249 | 893752 | 6296.74 | 581 | 564 | 141.8 |
| D | 2 | 249 | 336238 | 2366.41 | 581 | 564 | 141.8 |
| D | 12 | 227 | 252084 | 1773.15 | 581 | 564 | 141.8 |
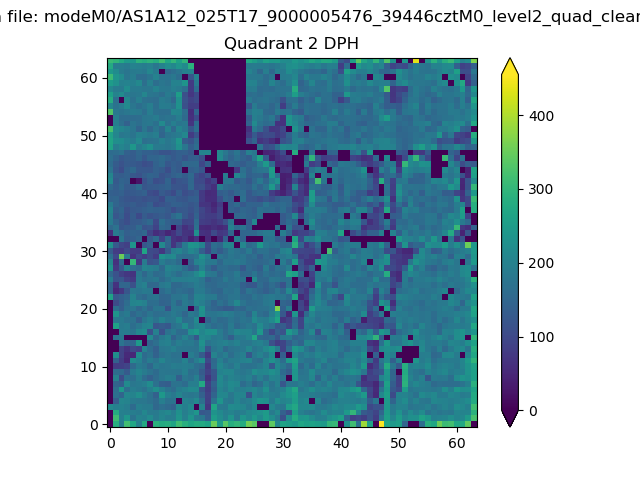
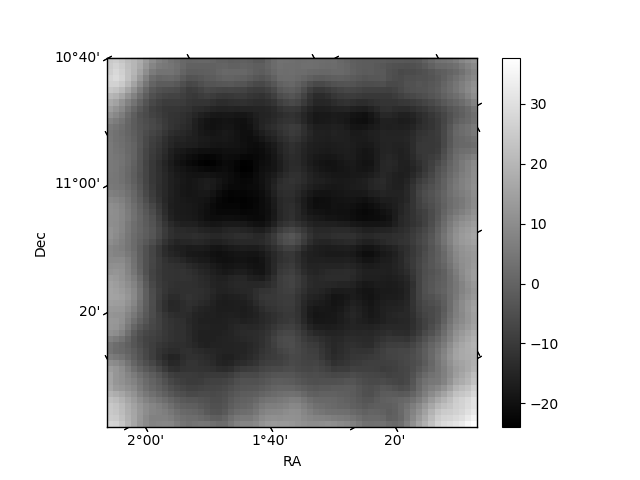
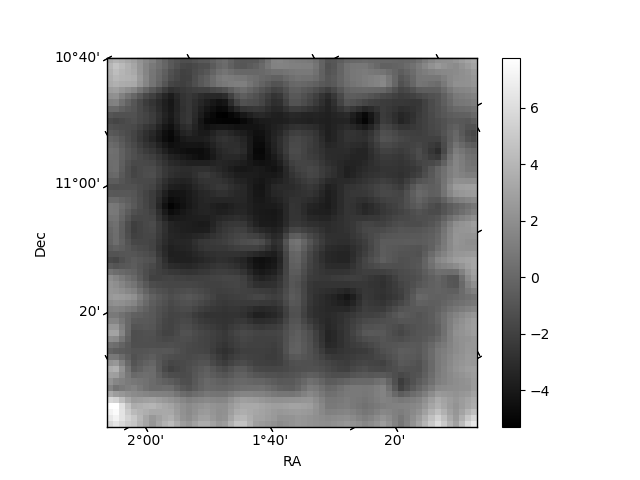
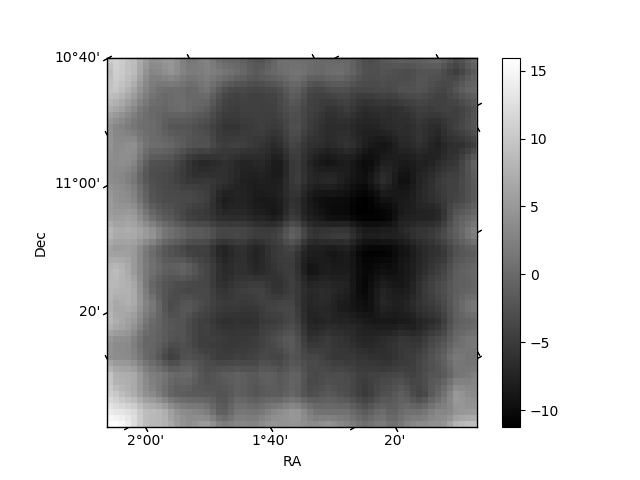
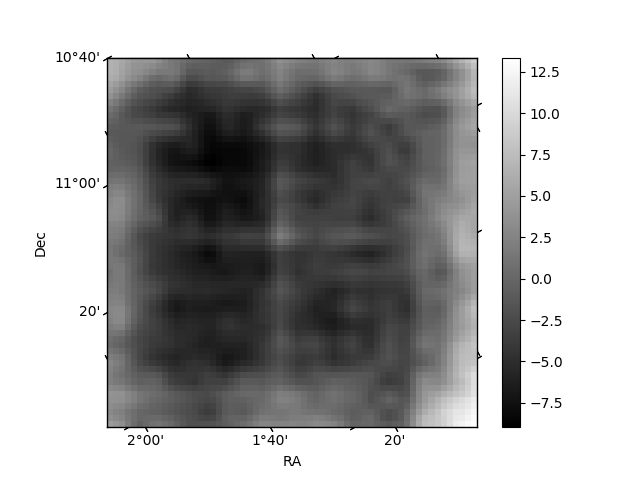
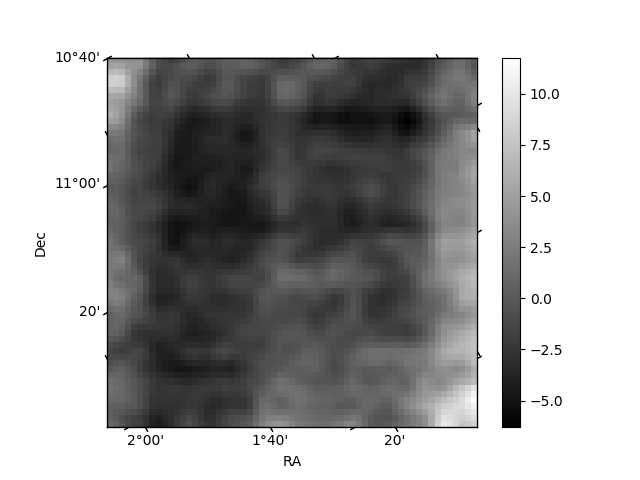
Histogram calculated using DETX and DETY for each event in the final _common_clean file
| Quadrant A | 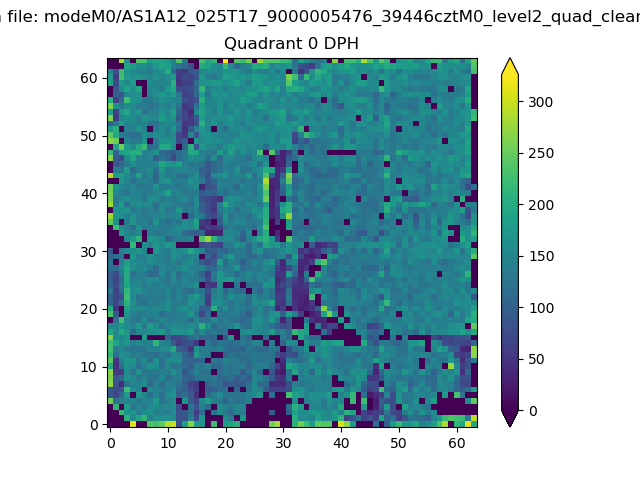 |
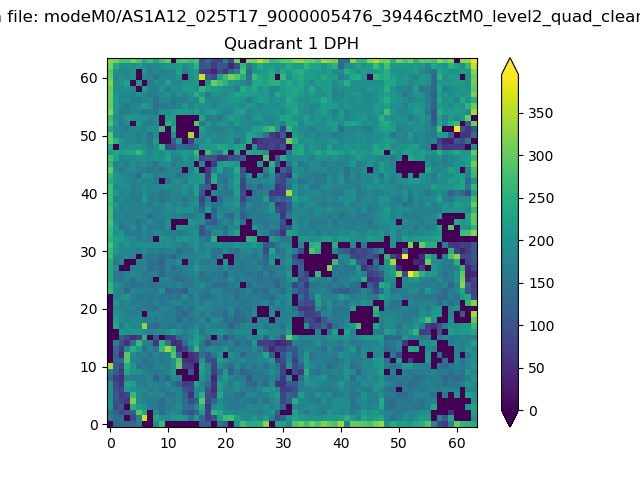 |
Quadrant B |
|---|---|---|---|
| Quadrant D | 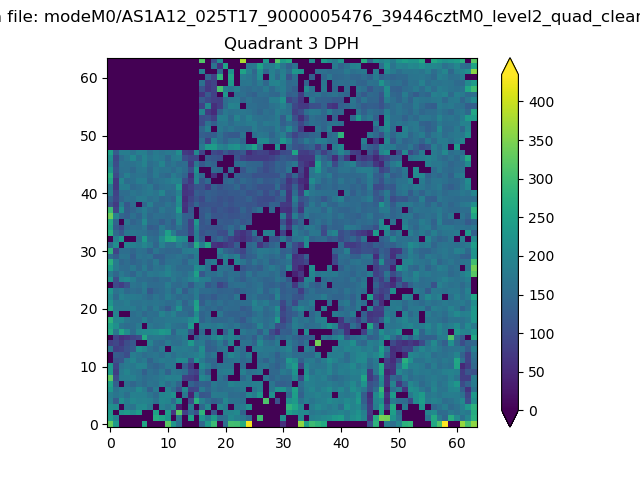 |
 |
Quadrant C |
| Plot type | Count rate plots | Images |
|---|---|---|
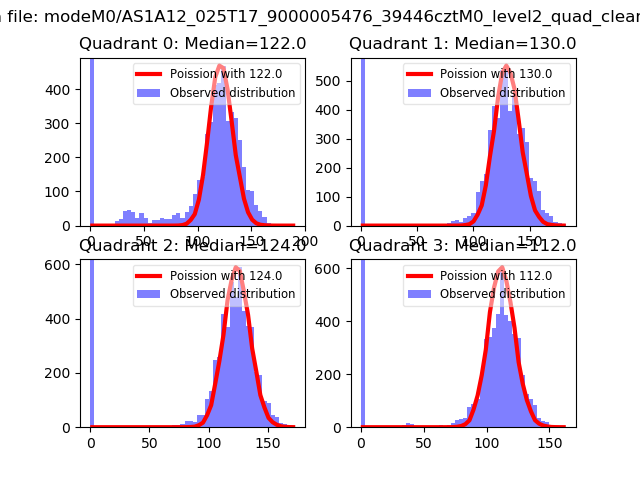
| Comparison with Poisson distribution Blue bars denote a histogram of data divided into 1 sec bins. Red curve is a Poisson curve with rate = median count rate of data. |
 |
 |
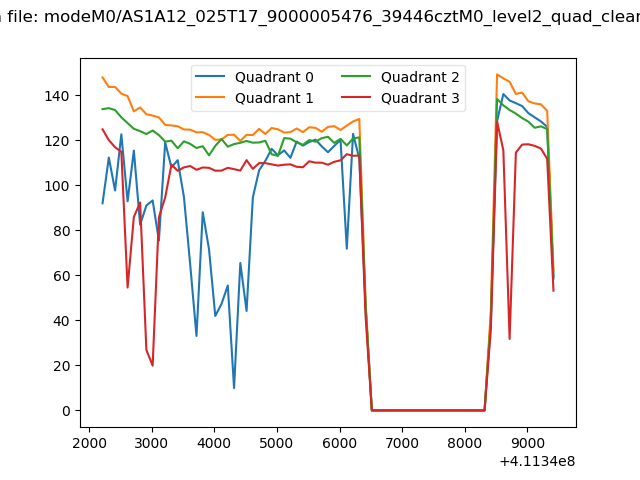
| Quadrant-wise count rates Data is divided into 100 sec bins |
 |
|
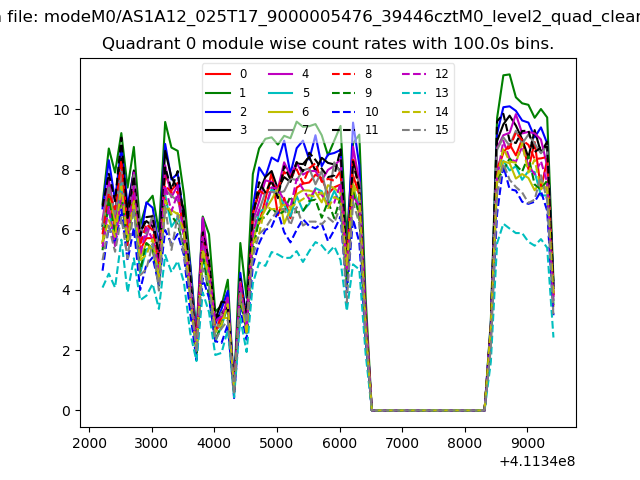
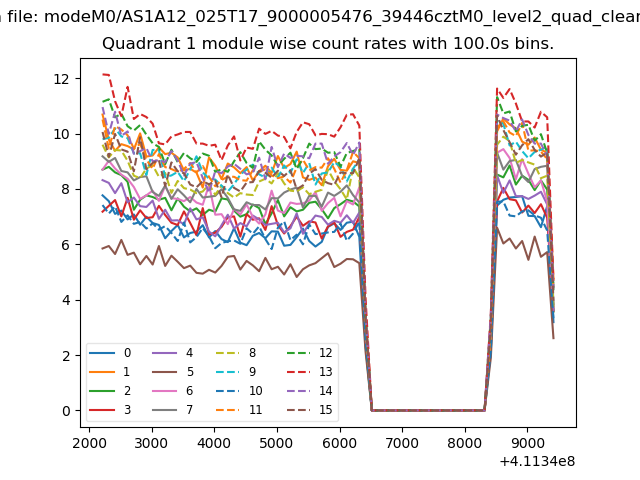
| Module-wise count rates for Quadrant A Data is divided into 100 sec bins |
 |
 |
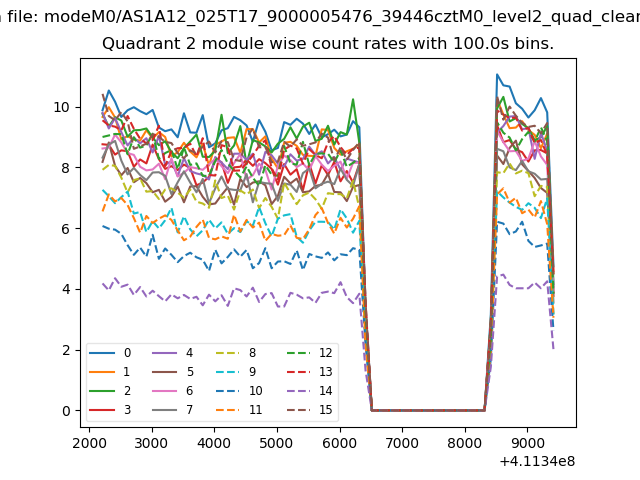
| Module-wise count rates for Quadrant B Data is divided into 100 sec bins |
 |
 |
| Module-wise count rates for Quadrant C Data is divided into 100 sec bins |
 |
 |
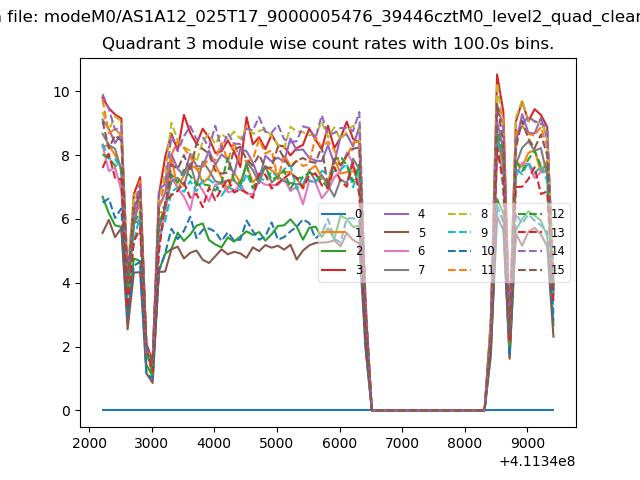
| Module-wise count rates for Quadrant D Data is divided into 100 sec bins |
 |
 |
| Parameter | Plot |
|---|---|
| CZT HV Monitor |  |
| D_VDD | 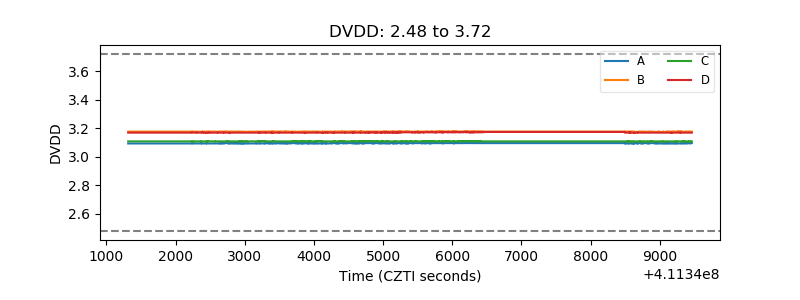 |
| Temperature 1 | 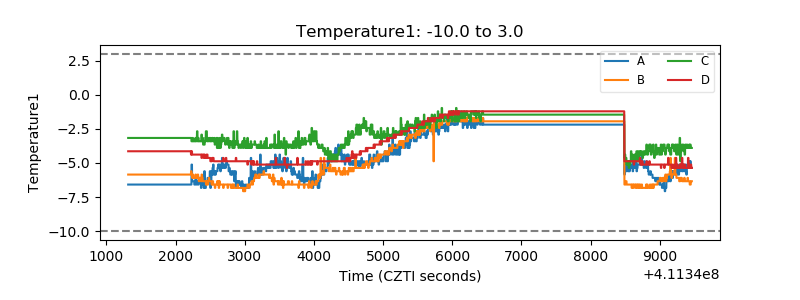 |
| Veto HV Monitor | 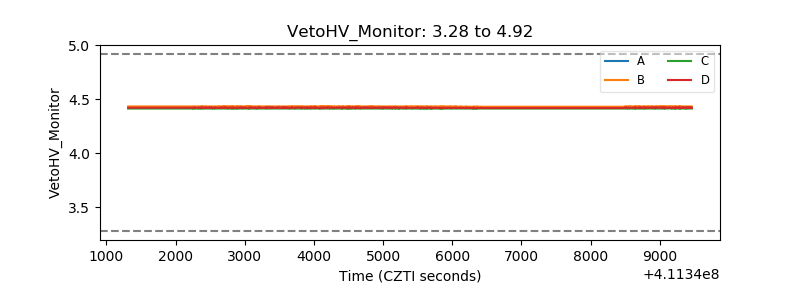 |
| Veto LLD | 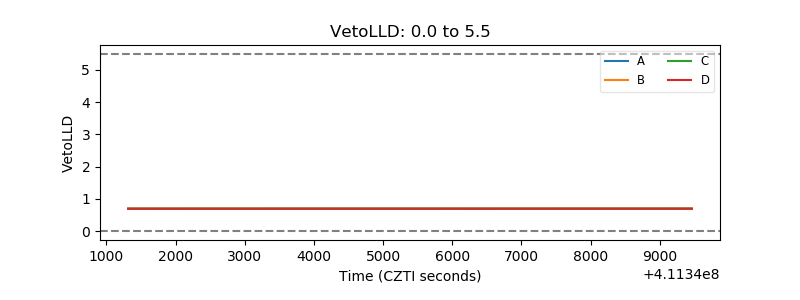 |
| Alpha Counter | 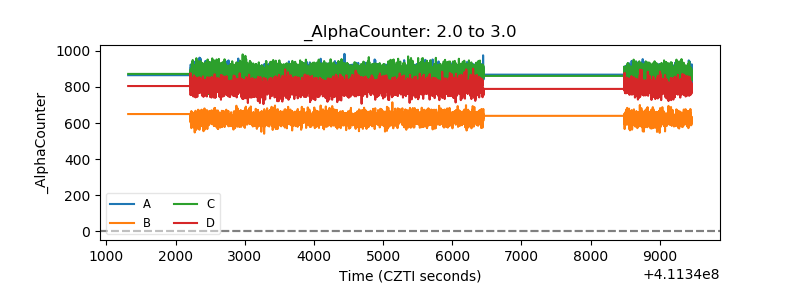 |
| _CPM_Rate | 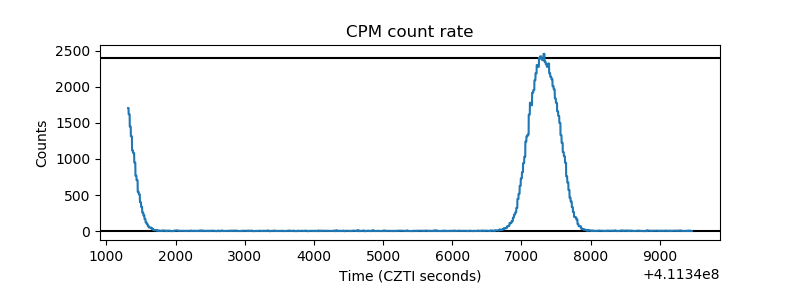 |
| CZT Counter | 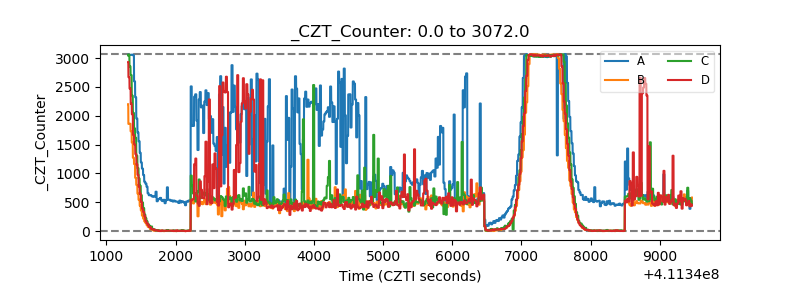 |
| +2.5 Volts monitor | 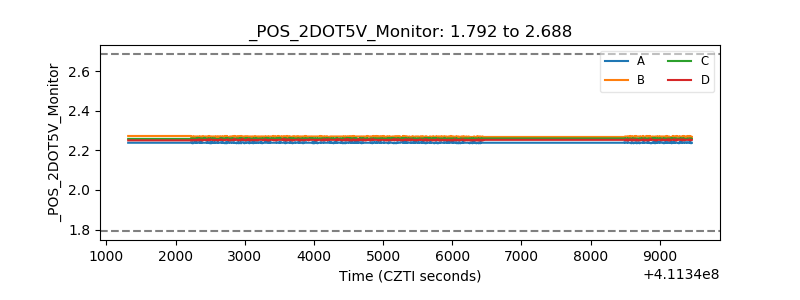 |
| +5 Volts monitor | 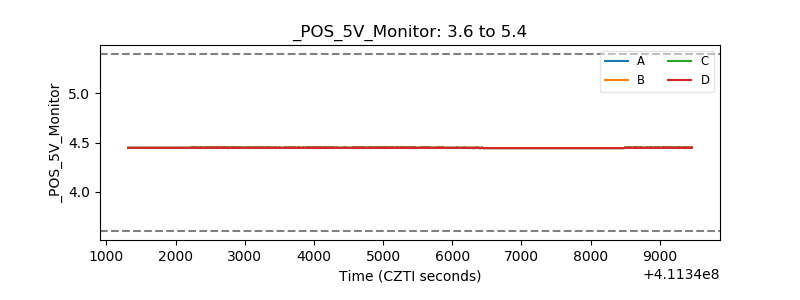 |
| _ROLL_ROT | 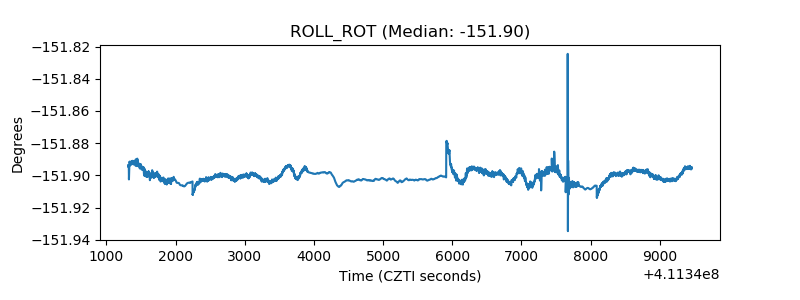 |
| _Roll_DEC | 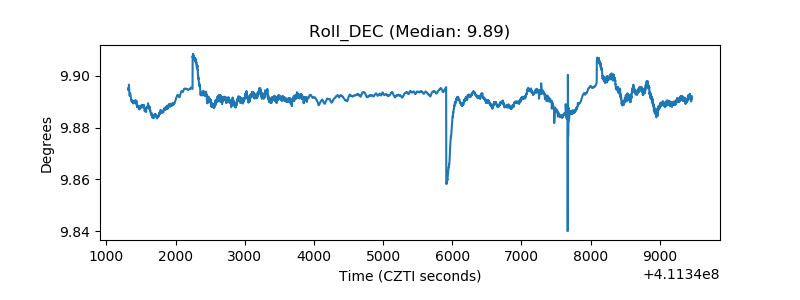 |
| _Roll_RA | 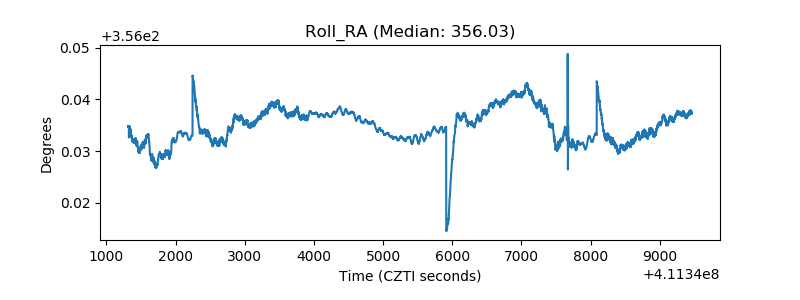 |
| Veto Counter | 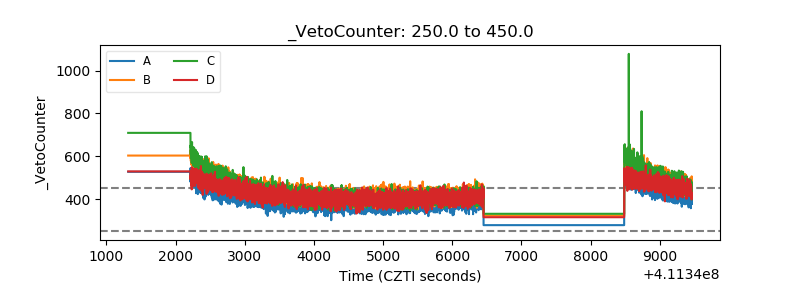 |