| Param | Original file | Final file |
|---|---|---|
| Filename | modeM0/AS1A12_025T17_9000005476_39447cztM0_level2.fits | modeM0/AS1A12_025T17_9000005476_39447cztM0_level2_quad_clean.evt |
| Size (bytes) | 340,675,200 | 93,611,520 |
| Size | 324.9 MB | 89.3 MB |
| Events in quadrant A | 3,260,217 | 630,867 |
| Events in quadrant B | 2,625,531 | 663,684 |
| Events in quadrant C | 3,213,617 | 618,405 |
| Events in quadrant D | 3,115,254 | 565,362 |
| Mode M0 | |||
|---|---|---|---|
| Quadrant | BADHDUFLAG | Total packets | Discarded packets |
| A | 0 | 12831 | 3 |
| B | 0 | 10866 | 2 |
| C | 0 | 12526 | 2 |
| D | 0 | 12575 | 2 |
| Mode SS | |||
|---|---|---|---|
| Quadrant | BADHDUFLAG | Total packets | Discarded packets |
| A | 0 | 104 | 0 |
| B | 0 | 104 | 0 |
| C | 0 | 104 | 0 |
| D | 0 | 104 | 0 |
| Mode M9 | |||
|---|---|---|---|
| Quadrant | BADHDUFLAG | Total packets | Discarded packets |
| A | 0 | 33 | 0 |
| B | 0 | 33 | 0 |
| C | 0 | 33 | 0 |
| D | 0 | 34 | 0 |
| Quadrant | Total seconds | Saturated seconds | Saturation percentage |
|---|---|---|---|
| A | 5086 | 56 | 1.101062% |
| B | 5086 | 26 | 0.511207% |
| C | 5086 | 134 | 2.634683% |
| D | 5086 | 157 | 3.086905% |
Noise dominated data is calculated using 1-second bins in cleaned event files. If a bin has >2000 counts, and if more than 50% of those come from <1% of pixels, then it is considered to be noise-dominated and hence unusable.
| Quadrant | # 1 sec bins | Bins with >0 counts | Bins with >2000 counts | High rate bins dominated by noise | Noise dominated (total time) | Noise dominated (detector-on time) | Marked lightcurve |
|---|---|---|---|---|---|---|---|
| A | 7209 | 5087 | 38 | 38 | 0.53% | 0.75% | 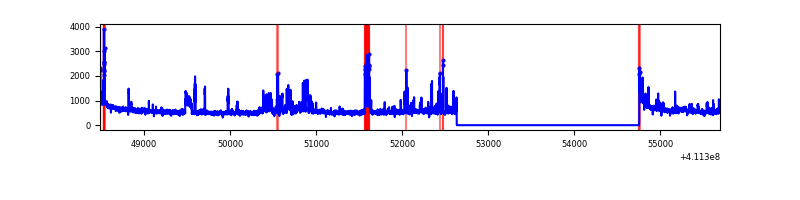 |
| B | 7209 | 5087 | 8 | 8 | 0.11% | 0.16% | 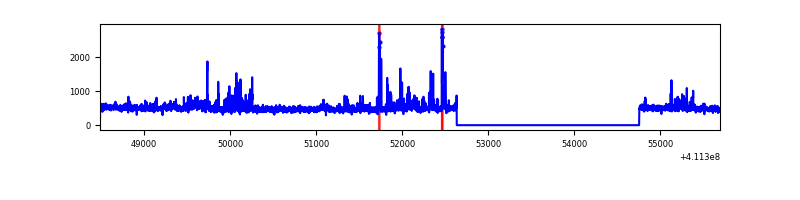 |
| C | 7209 | 5087 | 109 | 109 | 1.51% | 2.14% | 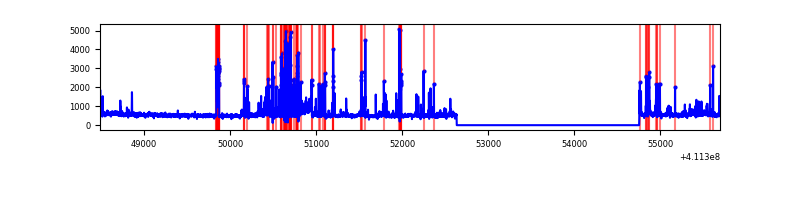 |
| D | 7209 | 5087 | 121 | 121 | 1.68% | 2.38% | 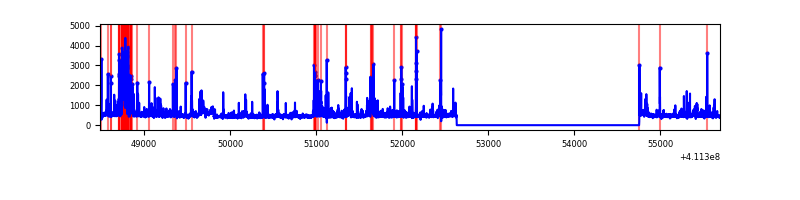 |
Top three noisy pixels from each quadrant. If the there are fewer than three noisy pixels in the level2.evt file, extra rows are filled as -1
| Pixel properties | Quadrant properties | ||||||
|---|---|---|---|---|---|---|---|
| Quadrant | DetID | PixID | Counts | Sigma | Mean | Median | Sigma |
| A | 15 | 222 | 468487 | 3788.6 | 610 | 598 | 123.5 |
| A | 10 | 83 | 415995 | 3363.56 | 610 | 598 | 123.5 |
| A | 13 | 248 | 8360 | 62.85 | 610 | 598 | 123.5 |
| B | 5 | 172 | 119094 | 1007.68 | 613 | 599 | 117.6 |
| B | 8 | 3 | 52142 | 438.32 | 613 | 599 | 117.6 |
| B | 5 | 255 | 46602 | 391.21 | 613 | 599 | 117.6 |
| C | 15 | 208 | 537322 | 3909.35 | 594 | 601 | 137.3 |
| C | 15 | 214 | 210299 | 1527.39 | 594 | 601 | 137.3 |
| C | 14 | 254 | 97866 | 708.46 | 594 | 601 | 137.3 |
| D | 2 | 249 | 536877 | 3746.99 | 588 | 571 | 143.1 |
| D | 12 | 227 | 134754 | 937.49 | 588 | 571 | 143.1 |
| D | 13 | 249 | 94343 | 655.15 | 588 | 571 | 143.1 |
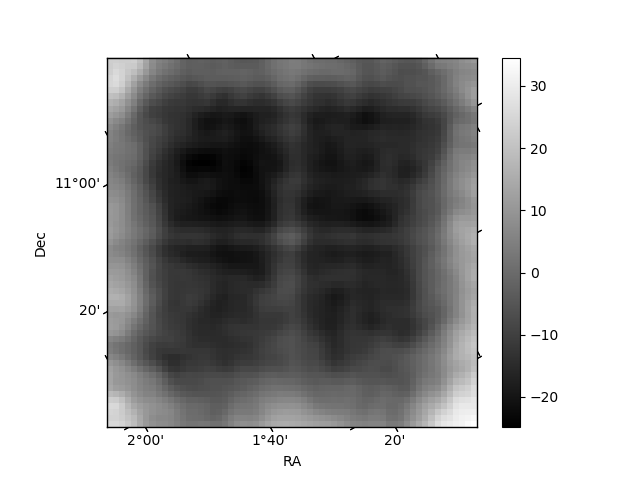
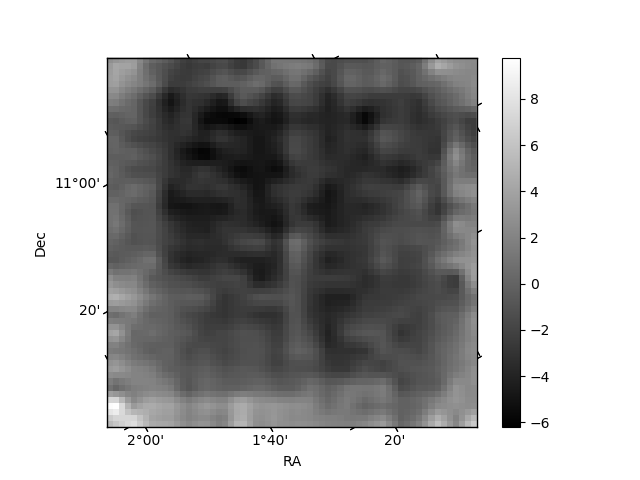
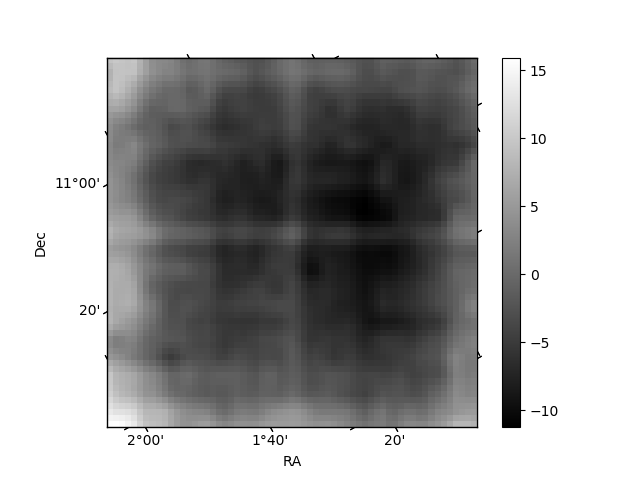
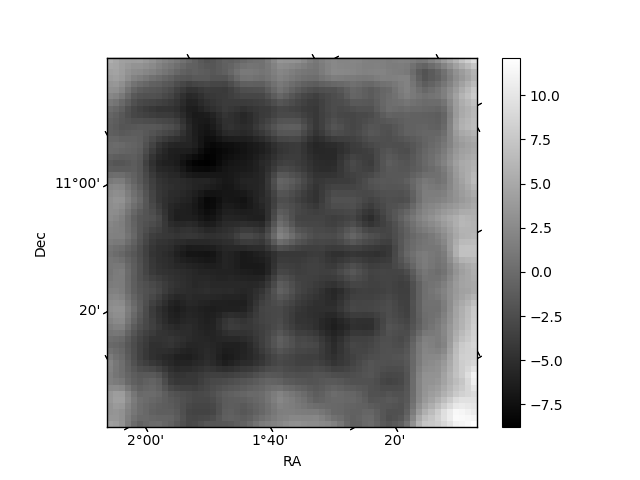
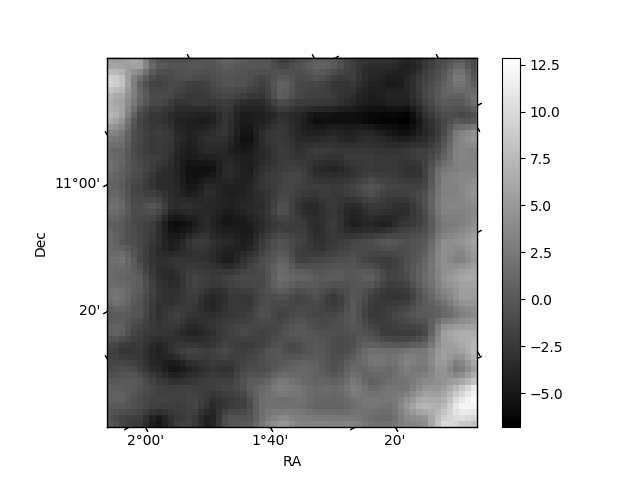
Histogram calculated using DETX and DETY for each event in the final _common_clean file
| Quadrant A | 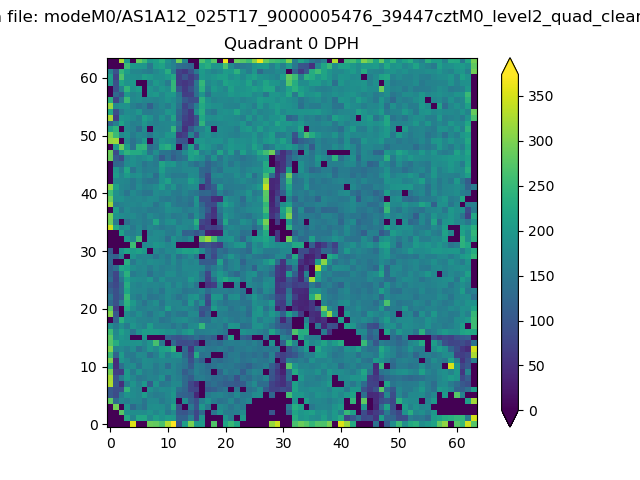 |
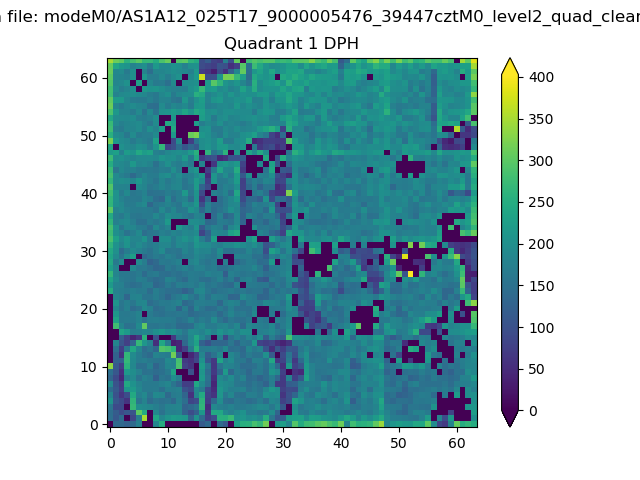 |
Quadrant B |
|---|---|---|---|
| Quadrant D | 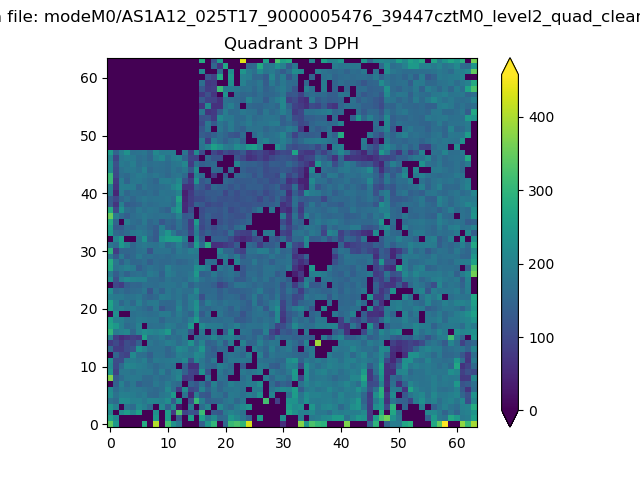 |
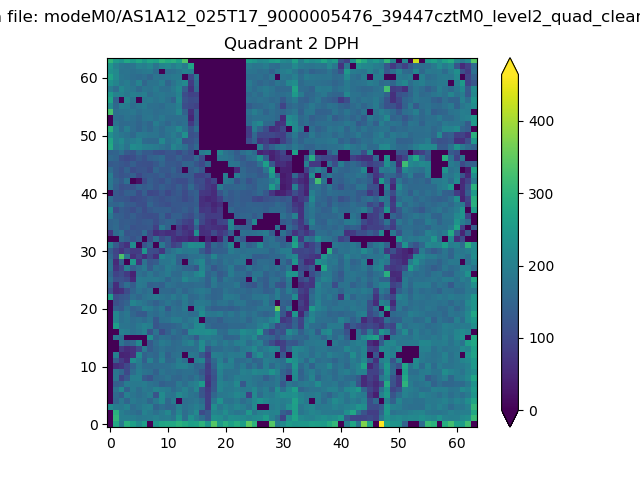 |
Quadrant C |
| Plot type | Count rate plots | Images |
|---|---|---|
| Comparison with Poisson distribution Blue bars denote a histogram of data divided into 1 sec bins. Red curve is a Poisson curve with rate = median count rate of data. |
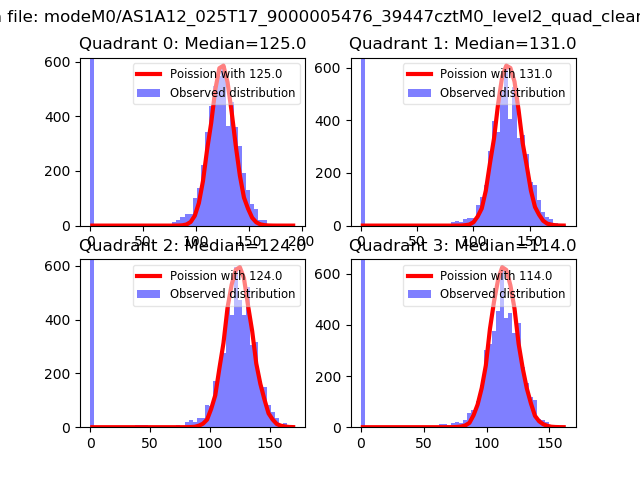 |
 |
| Quadrant-wise count rates Data is divided into 100 sec bins |
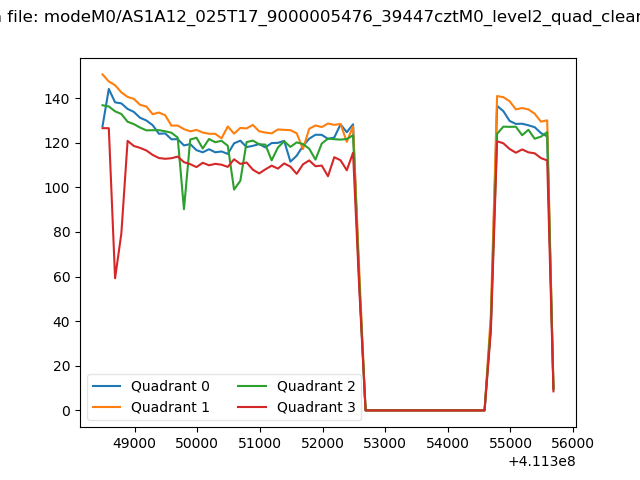 |
|
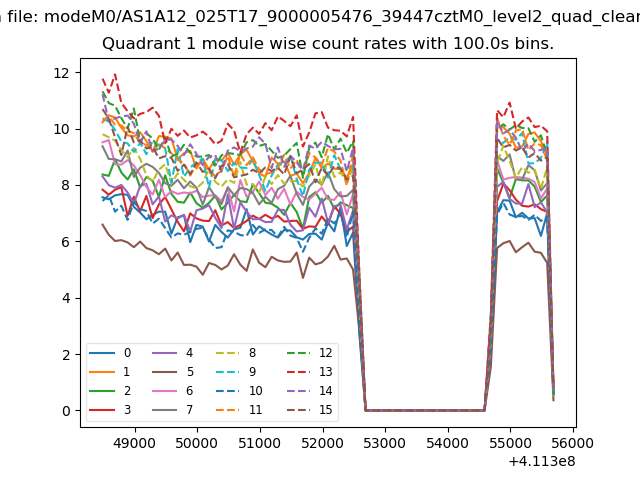
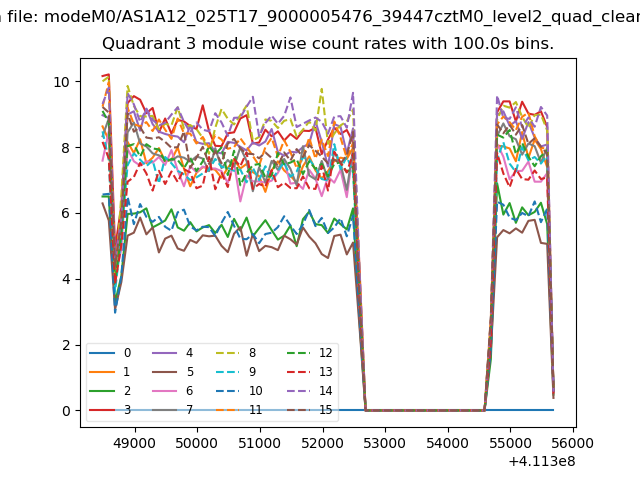
| Module-wise count rates for Quadrant A Data is divided into 100 sec bins |
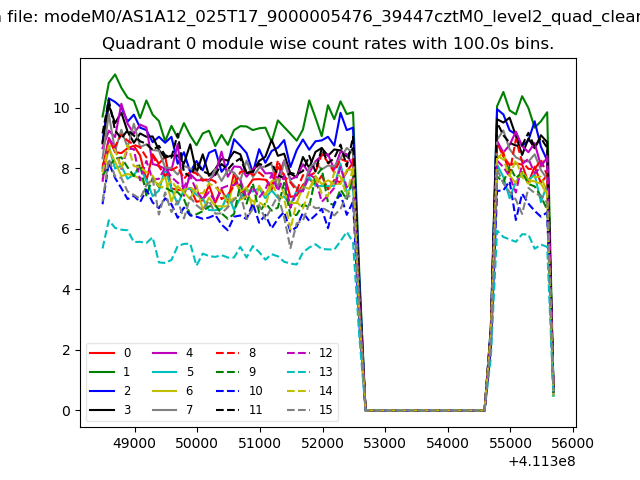 |
 |
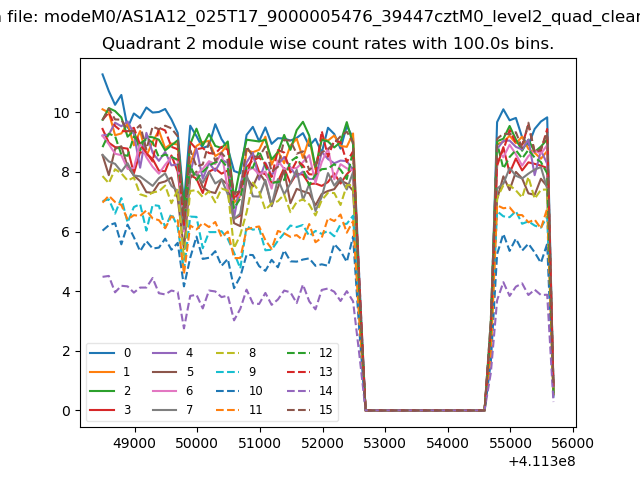
| Module-wise count rates for Quadrant B Data is divided into 100 sec bins |
 |
 |
| Module-wise count rates for Quadrant C Data is divided into 100 sec bins |
 |
 |
| Module-wise count rates for Quadrant D Data is divided into 100 sec bins |
 |
 |
| Parameter | Plot |
|---|---|
| CZT HV Monitor | 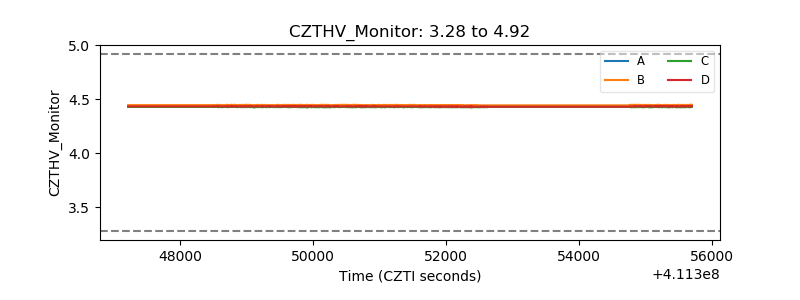 |
| D_VDD | 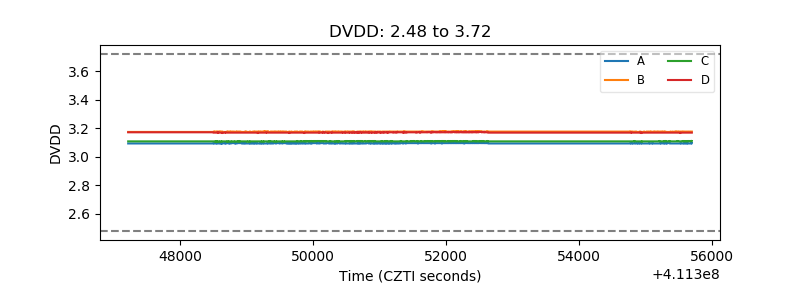 |
| Temperature 1 | 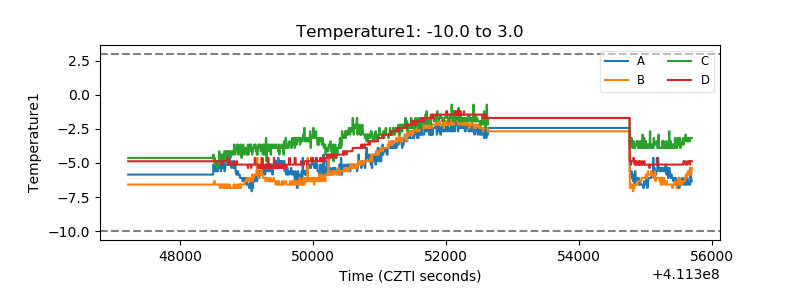 |
| Veto HV Monitor | 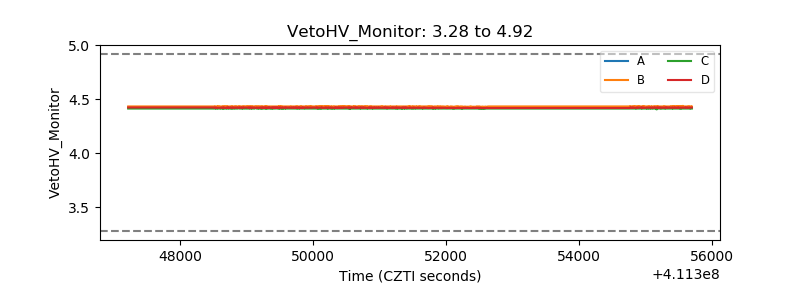 |
| Veto LLD | 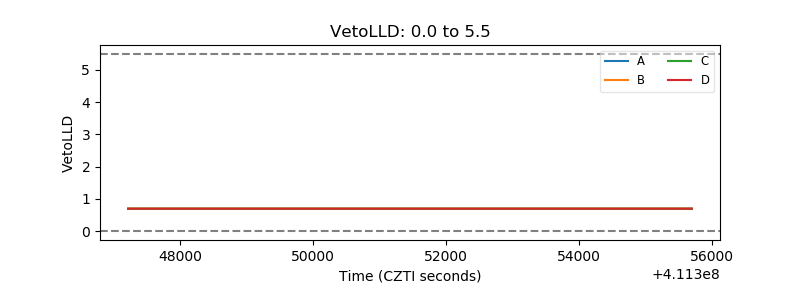 |
| Alpha Counter | 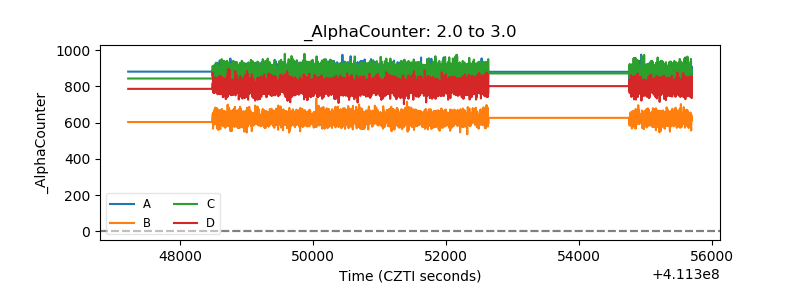 |
| _CPM_Rate | 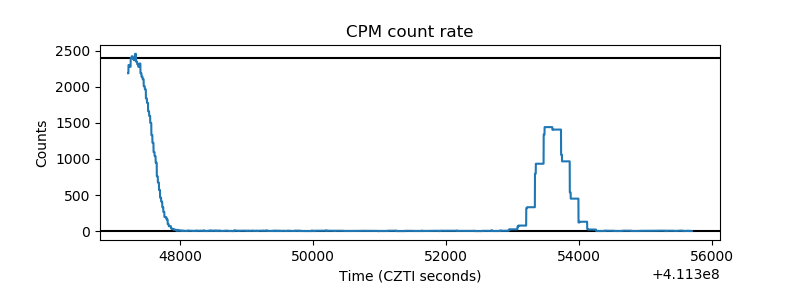 |
| CZT Counter | 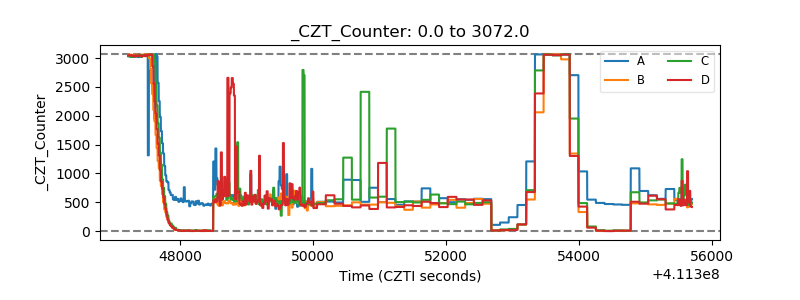 |
| +2.5 Volts monitor | 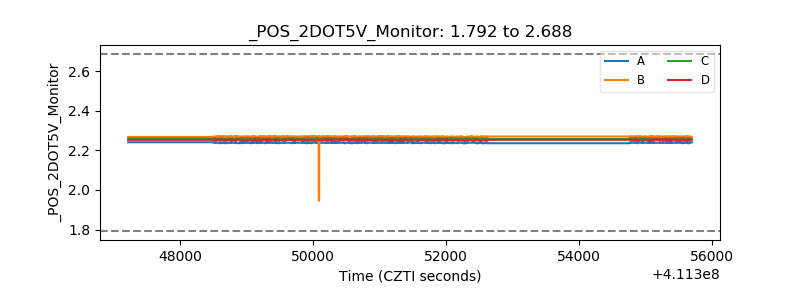 |
| +5 Volts monitor | 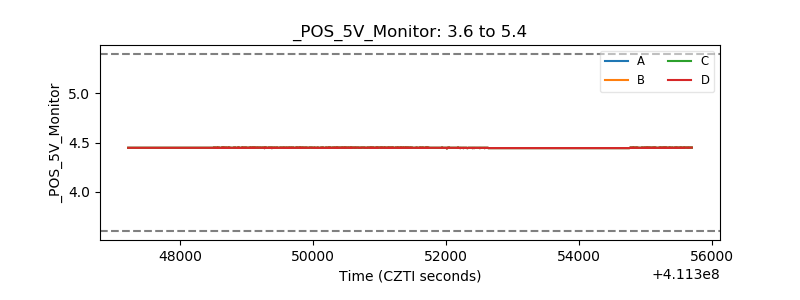 |
| _ROLL_ROT | 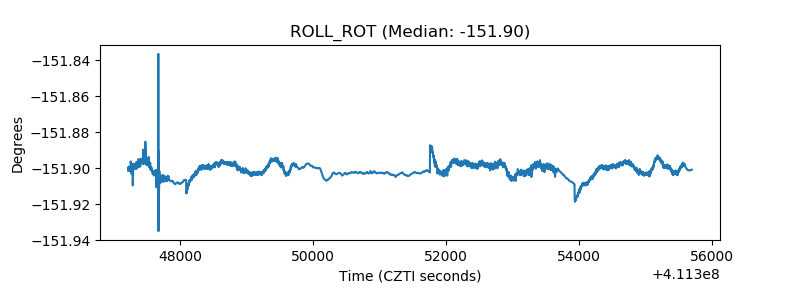 |
| _Roll_DEC | 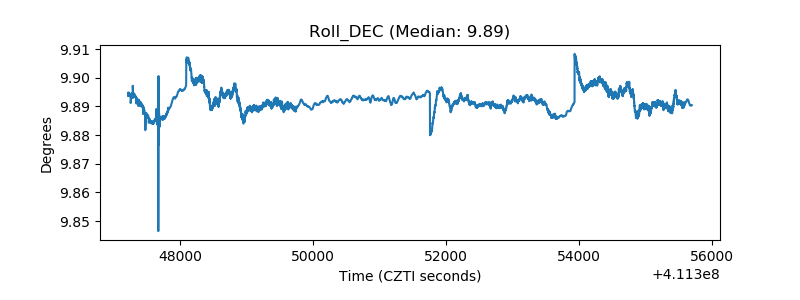 |
| _Roll_RA | 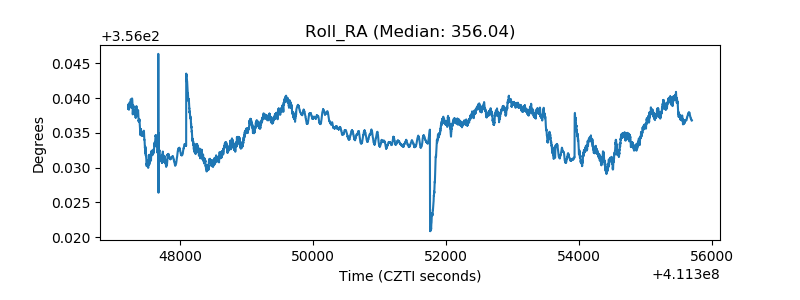 |
| Veto Counter | 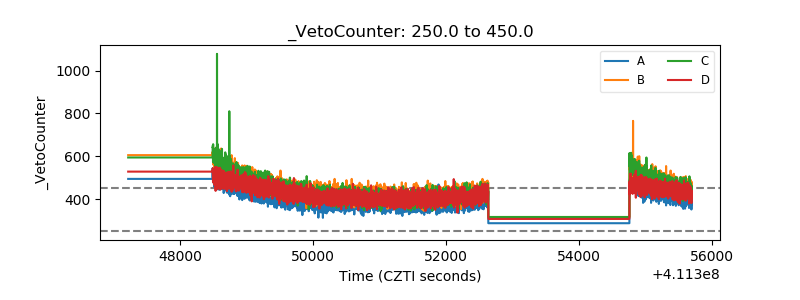 |