| Param | Original file | Final file |
|---|---|---|
| Filename | modeM0/AS1A12_025T17_9000005476_39448cztM0_level2.fits | modeM0/AS1A12_025T17_9000005476_39448cztM0_level2_quad_clean.evt |
| Size (bytes) | 369,322,560 | 89,795,520 |
| Size | 352.2 MB | 85.6 MB |
| Events in quadrant A | 4,174,736 | 597,196 |
| Events in quadrant B | 2,532,788 | 635,806 |
| Events in quadrant C | 3,948,799 | 586,167 |
| Events in quadrant D | 2,626,203 | 549,961 |
| Mode M0 | |||
|---|---|---|---|
| Quadrant | BADHDUFLAG | Total packets | Discarded packets |
| A | 0 | 15884 | 3 |
| B | 0 | 10637 | 2 |
| C | 0 | 14845 | 2 |
| D | 0 | 11087 | 2 |
| Mode SS | |||
|---|---|---|---|
| Quadrant | BADHDUFLAG | Total packets | Discarded packets |
| A | 0 | 100 | 0 |
| B | 0 | 100 | 0 |
| C | 0 | 100 | 0 |
| D | 0 | 100 | 0 |
| Mode M9 | |||
|---|---|---|---|
| Quadrant | BADHDUFLAG | Total packets | Discarded packets |
| A | 0 | 35 | 0 |
| B | 0 | 35 | 0 |
| C | 0 | 35 | 0 |
| D | 0 | 36 | 0 |
| Quadrant | Total seconds | Saturated seconds | Saturation percentage |
|---|---|---|---|
| A | 4999 | 163 | 3.260652% |
| B | 4999 | 6 | 0.120024% |
| C | 4999 | 203 | 4.060812% |
| D | 4999 | 36 | 0.720144% |
Noise dominated data is calculated using 1-second bins in cleaned event files. If a bin has >2000 counts, and if more than 50% of those come from <1% of pixels, then it is considered to be noise-dominated and hence unusable.
| Quadrant | # 1 sec bins | Bins with >0 counts | Bins with >2000 counts | High rate bins dominated by noise | Noise dominated (total time) | Noise dominated (detector-on time) | Marked lightcurve |
|---|---|---|---|---|---|---|---|
| A | 7122 | 5000 | 99 | 99 | 1.39% | 1.98% | 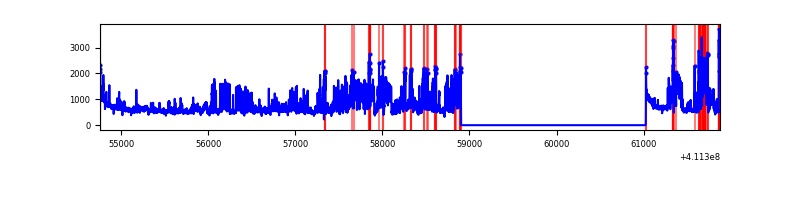 |
| B | 7122 | 5000 | 2 | 2 | 0.03% | 0.04% | 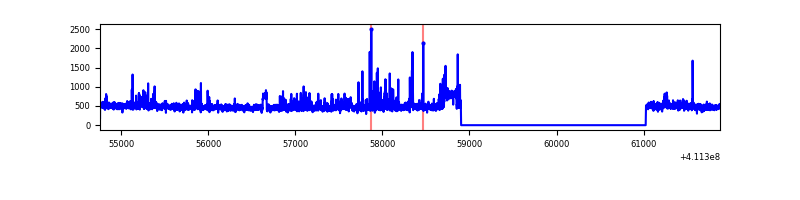 |
| C | 7122 | 5000 | 193 | 193 | 2.71% | 3.86% | 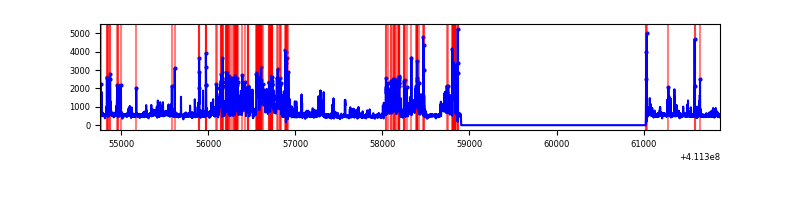 |
| D | 7122 | 5000 | 25 | 25 | 0.35% | 0.50% | 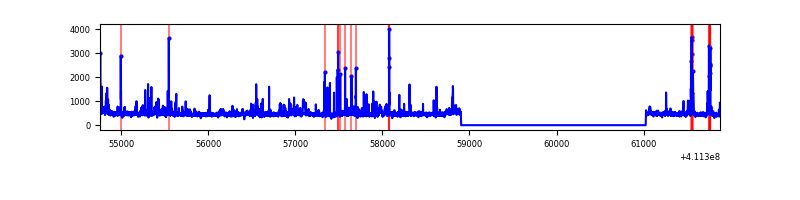 |
Top three noisy pixels from each quadrant. If the there are fewer than three noisy pixels in the level2.evt file, extra rows are filled as -1
| Pixel properties | Quadrant properties | ||||||
|---|---|---|---|---|---|---|---|
| Quadrant | DetID | PixID | Counts | Sigma | Mean | Median | Sigma |
| A | 15 | 222 | 1154420 | 9678.25 | 586 | 576 | 119.2 |
| A | 10 | 83 | 421084 | 3527.15 | 586 | 576 | 119.2 |
| A | 15 | 174 | 312254 | 2614.3 | 586 | 576 | 119.2 |
| B | 5 | 172 | 166907 | 1468.33 | 591 | 576 | 113.3 |
| B | 8 | 3 | 23395 | 201.44 | 591 | 576 | 113.3 |
| B | 12 | 111 | 14160 | 119.92 | 591 | 576 | 113.3 |
| C | 15 | 208 | 1305811 | 9935.78 | 569 | 573 | 131.4 |
| C | 15 | 214 | 208631 | 1583.79 | 569 | 573 | 131.4 |
| C | 9 | 187 | 131045 | 993.18 | 569 | 573 | 131.4 |
| D | 2 | 249 | 118134 | 835.48 | 574 | 558 | 140.7 |
| D | 7 | 38 | 68204 | 480.68 | 574 | 558 | 140.7 |
| D | 13 | 249 | 60632 | 426.88 | 574 | 558 | 140.7 |
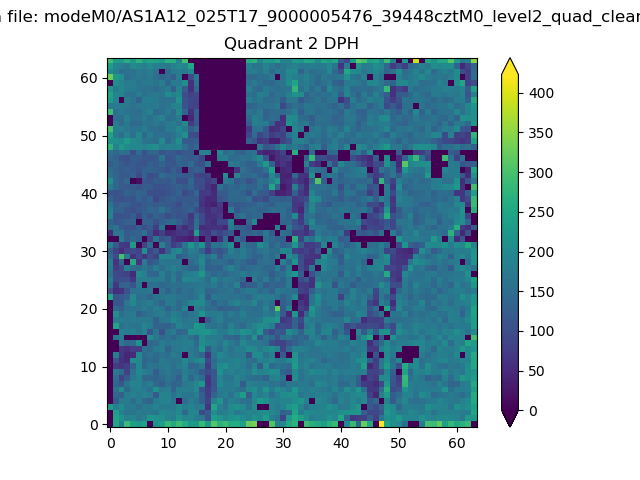
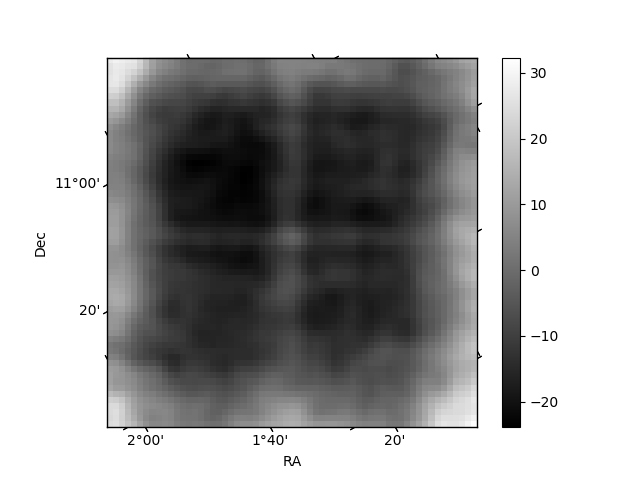
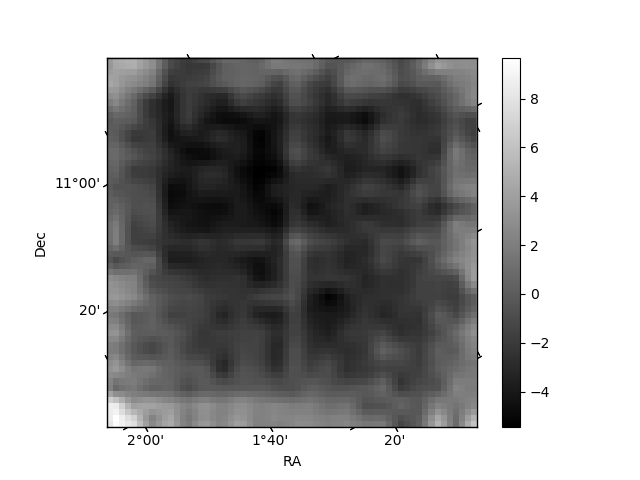
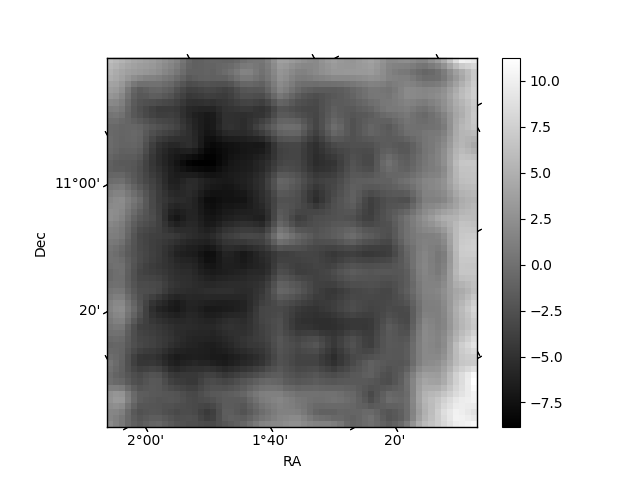
Histogram calculated using DETX and DETY for each event in the final _common_clean file
| Quadrant A | 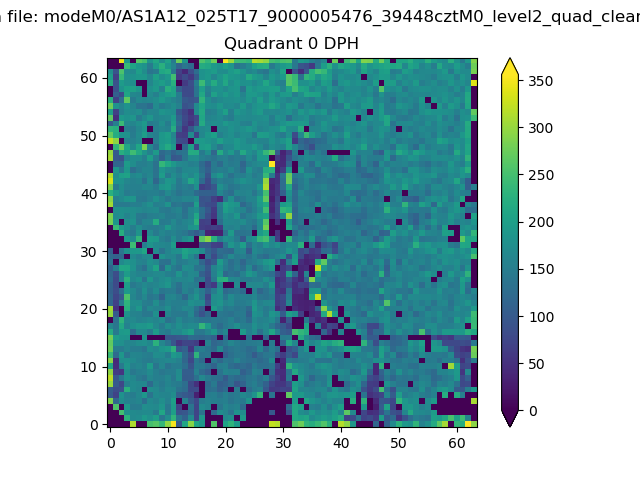 |
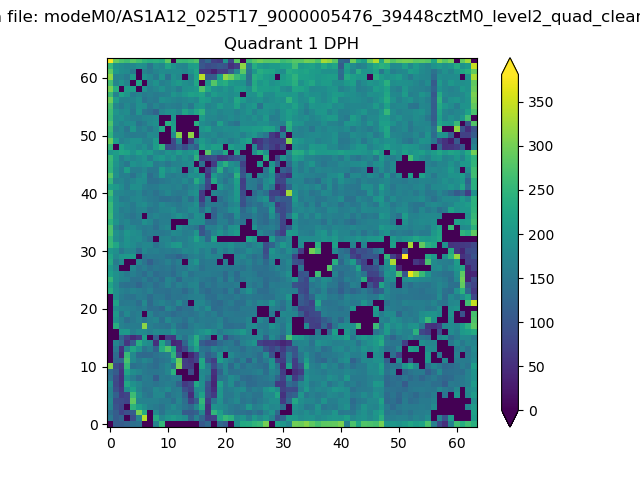 |
Quadrant B |
|---|---|---|---|
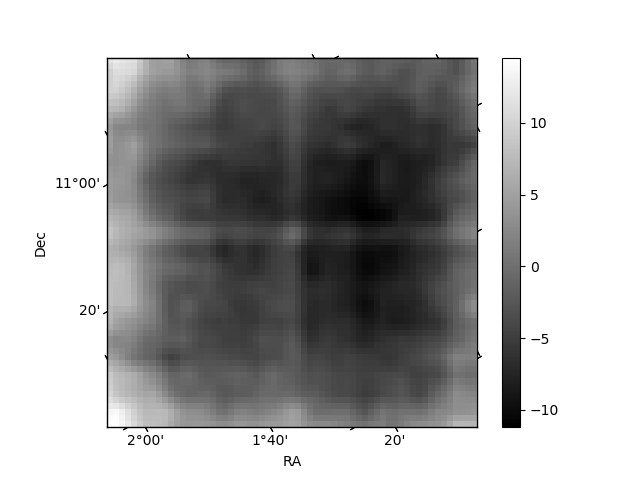
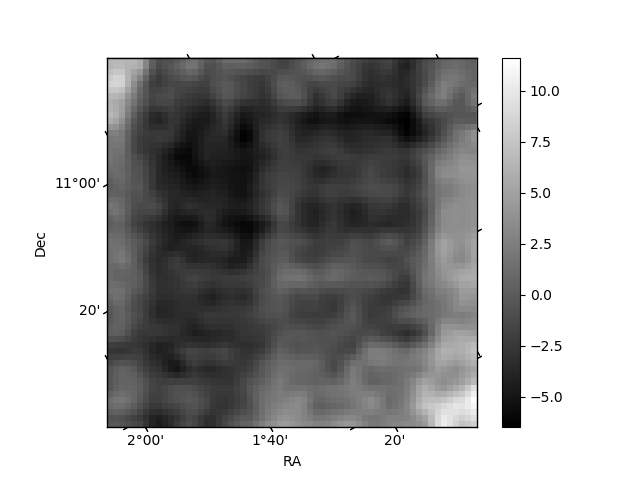
| Quadrant D | 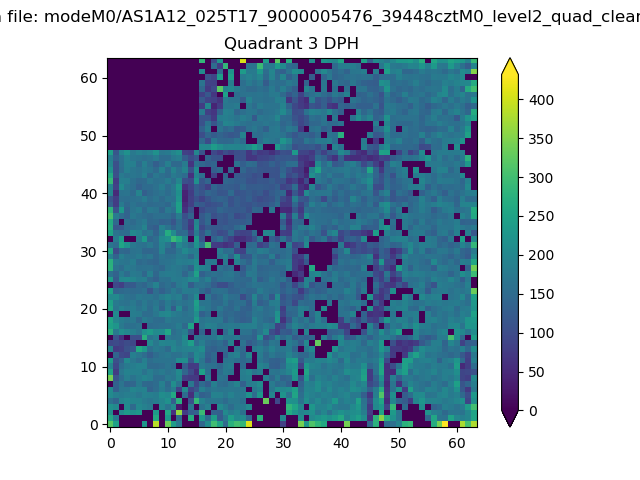 |
 |
Quadrant C |
| Plot type | Count rate plots | Images |
|---|---|---|
| Comparison with Poisson distribution Blue bars denote a histogram of data divided into 1 sec bins. Red curve is a Poisson curve with rate = median count rate of data. |
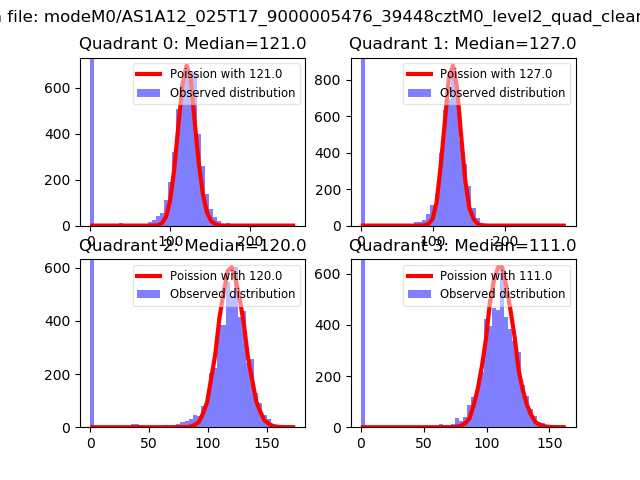 |
 |
| Quadrant-wise count rates Data is divided into 100 sec bins |
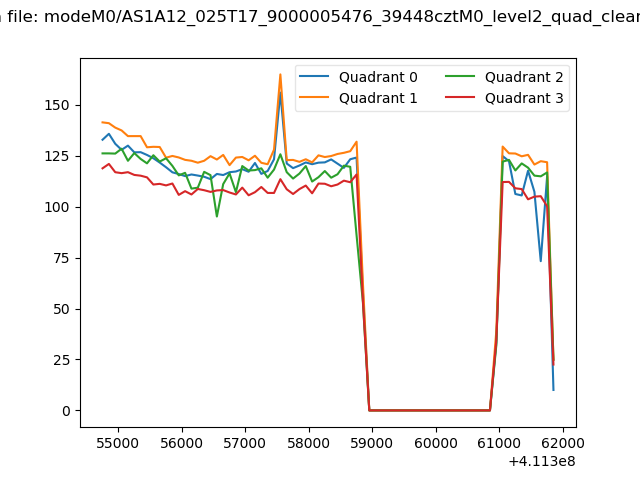 |
|
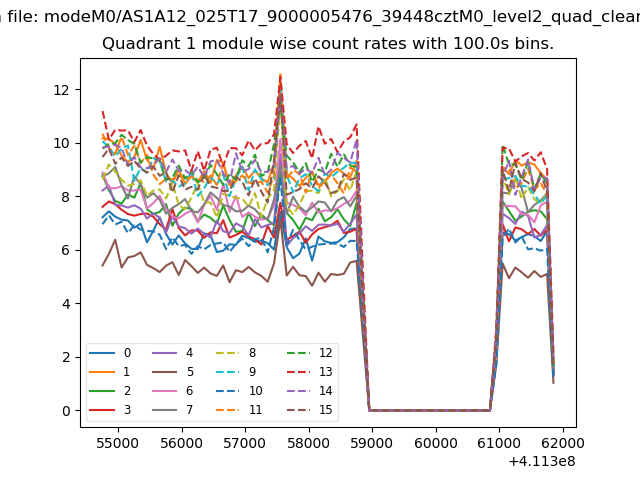
| Module-wise count rates for Quadrant A Data is divided into 100 sec bins |
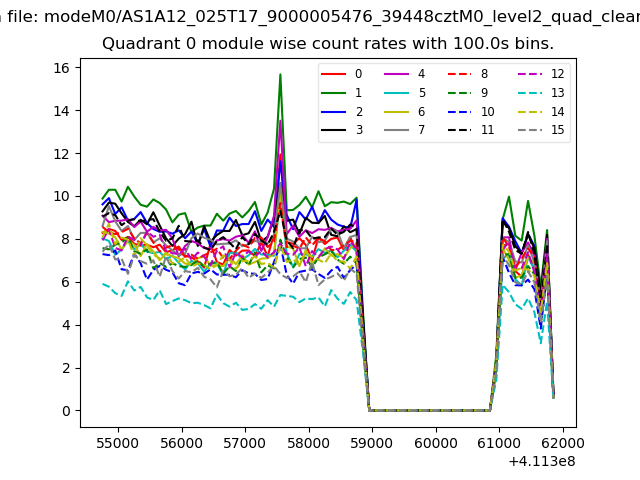 |
 |
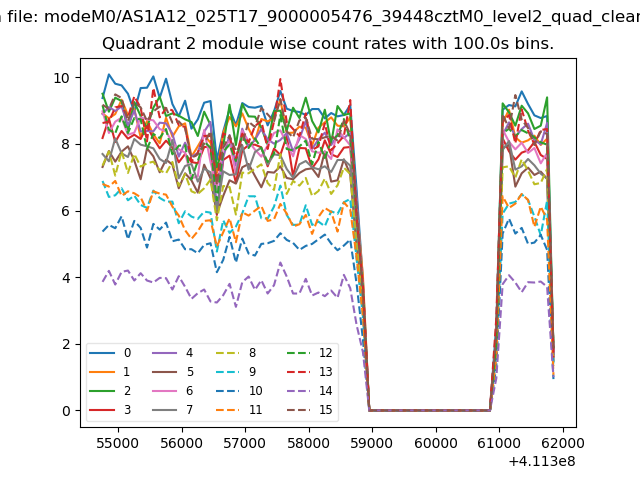
| Module-wise count rates for Quadrant B Data is divided into 100 sec bins |
 |
 |
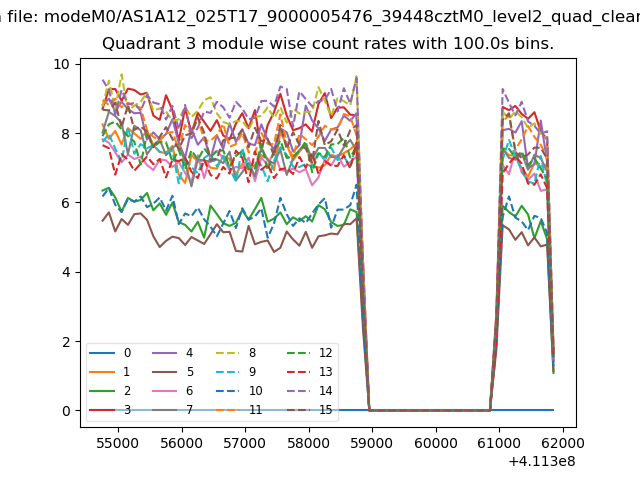
| Module-wise count rates for Quadrant C Data is divided into 100 sec bins |
 |
 |
| Module-wise count rates for Quadrant D Data is divided into 100 sec bins |
 |
 |
| Parameter | Plot |
|---|---|
| CZT HV Monitor | 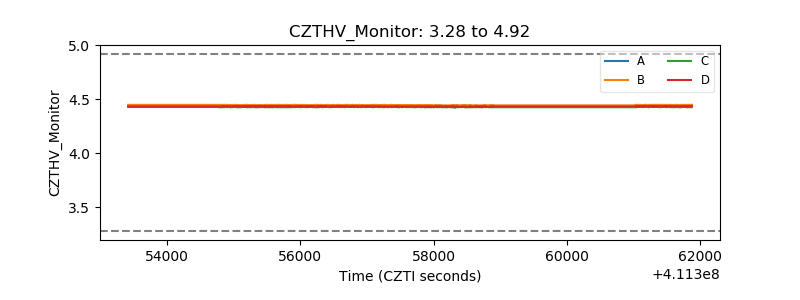 |
| D_VDD | 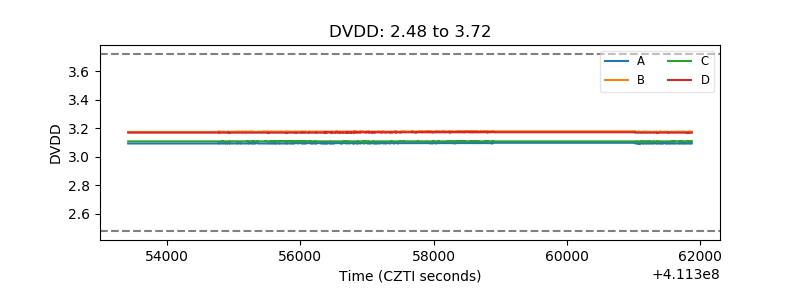 |
| Temperature 1 | 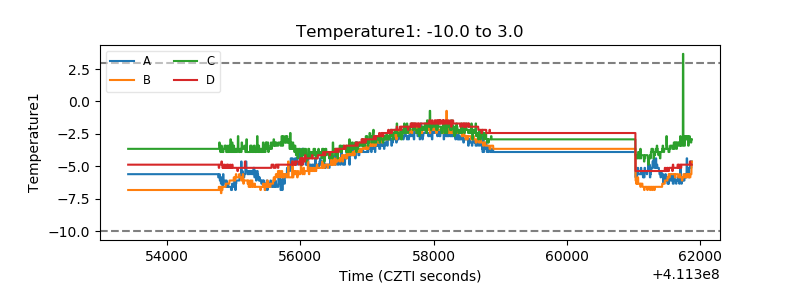 |
| Veto HV Monitor | 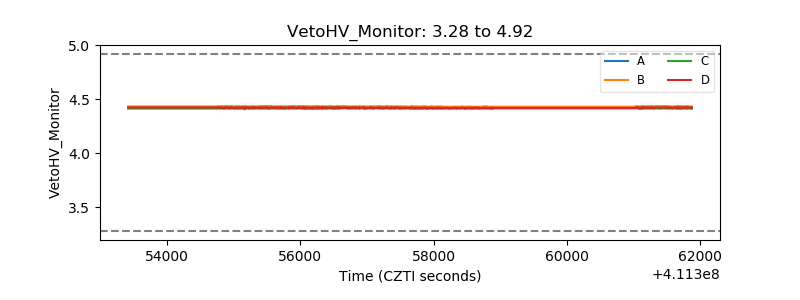 |
| Veto LLD | 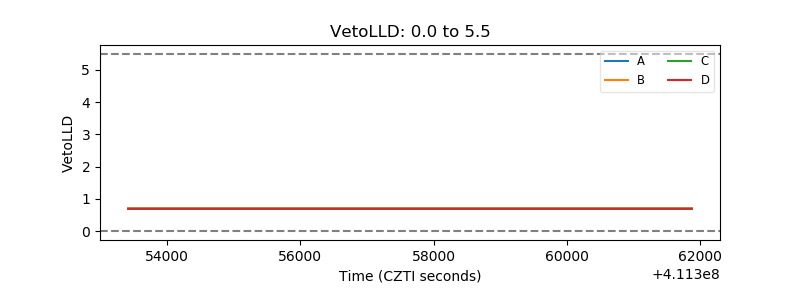 |
| Alpha Counter | 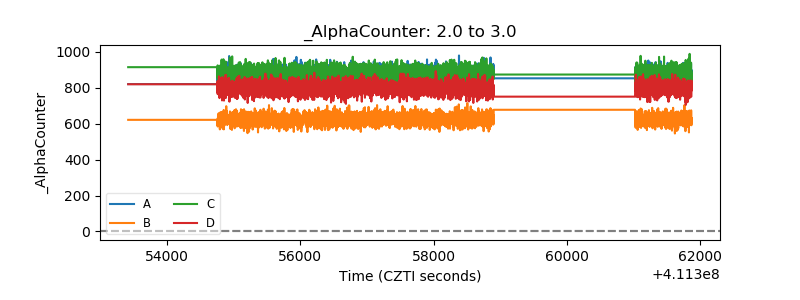 |
| _CPM_Rate | 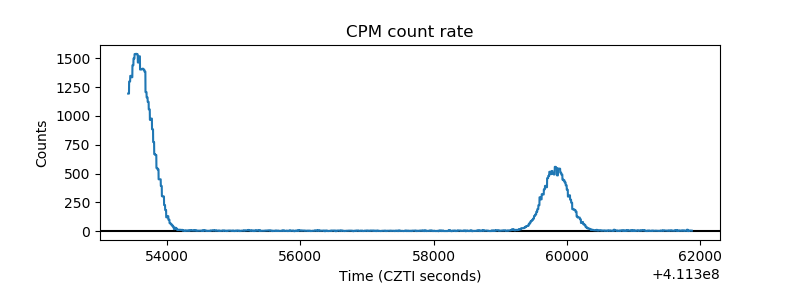 |
| CZT Counter | 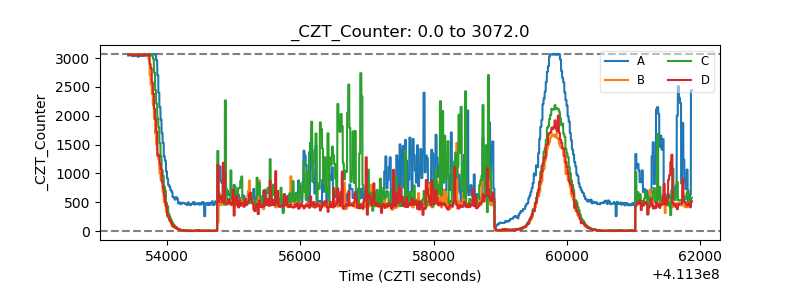 |
| +2.5 Volts monitor | 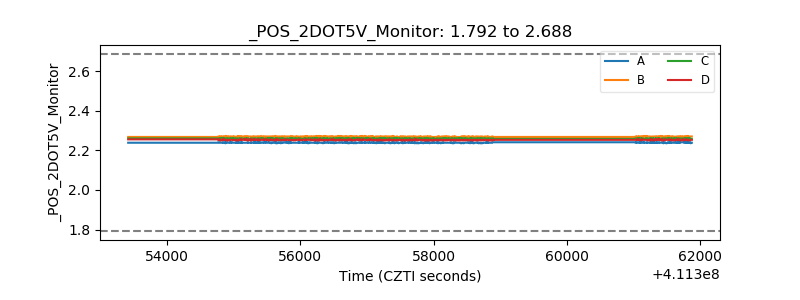 |
| +5 Volts monitor | 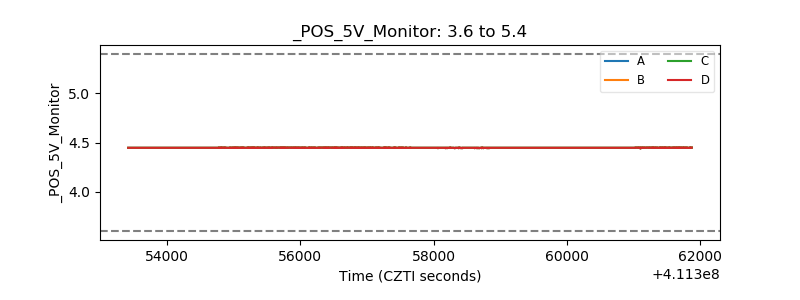 |
| _ROLL_ROT | 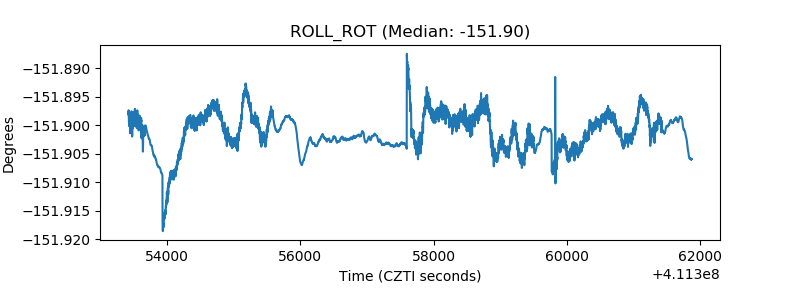 |
| _Roll_DEC | 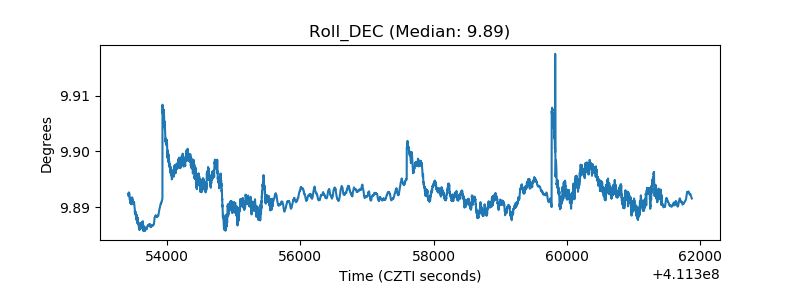 |
| _Roll_RA | 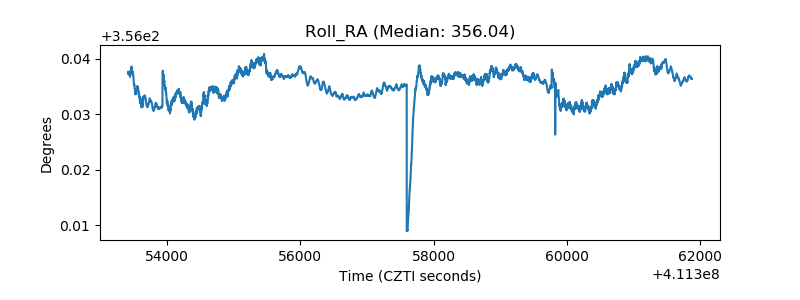 |
| Veto Counter | 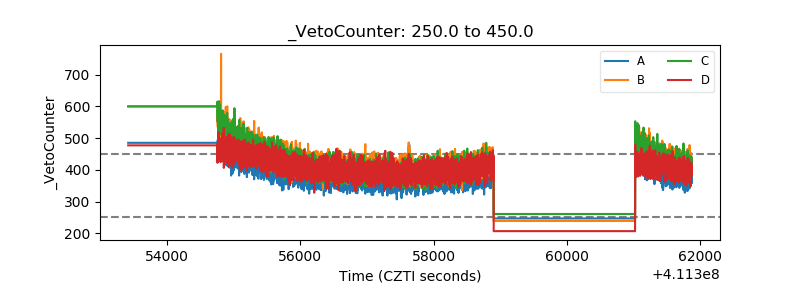 |