| Param | Original file | Final file |
|---|---|---|
| Filename | modeM0/AS1A12_025T17_9000005476_39450cztM0_level2.fits | modeM0/AS1A12_025T17_9000005476_39450cztM0_level2_quad_clean.evt |
| Size (bytes) | 354,211,200 | 90,077,760 |
| Size | 337.8 MB | 85.9 MB |
| Events in quadrant A | 4,162,455 | 588,507 |
| Events in quadrant B | 2,431,260 | 623,959 |
| Events in quadrant C | 3,387,330 | 590,329 |
| Events in quadrant D | 2,709,649 | 546,237 |
| Mode M0 | |||
|---|---|---|---|
| Quadrant | BADHDUFLAG | Total packets | Discarded packets |
| A | 0 | 16036 | 3 |
| B | 0 | 10946 | 2 |
| C | 0 | 13378 | 2 |
| D | 0 | 11869 | 2 |
| Mode SS | |||
|---|---|---|---|
| Quadrant | BADHDUFLAG | Total packets | Discarded packets |
| A | 0 | 110 | 0 |
| B | 0 | 110 | 0 |
| C | 0 | 110 | 0 |
| D | 0 | 110 | 0 |
| Mode M9 | |||
|---|---|---|---|
| Quadrant | BADHDUFLAG | Total packets | Discarded packets |
| A | 0 | 32 | 0 |
| B | 0 | 32 | 0 |
| C | 0 | 32 | 0 |
| D | 0 | 33 | 0 |
| Quadrant | Total seconds | Saturated seconds | Saturation percentage |
|---|---|---|---|
| A | 5407 | 193 | 3.569447% |
| B | 5407 | 16 | 0.295913% |
| C | 5407 | 130 | 2.404291% |
| D | 5407 | 88 | 1.627520% |
Noise dominated data is calculated using 1-second bins in cleaned event files. If a bin has >2000 counts, and if more than 50% of those come from <1% of pixels, then it is considered to be noise-dominated and hence unusable.
| Quadrant | # 1 sec bins | Bins with >0 counts | Bins with >2000 counts | High rate bins dominated by noise | Noise dominated (total time) | Noise dominated (detector-on time) | Marked lightcurve |
|---|---|---|---|---|---|---|---|
| A | 7109 | 5408 | 139 | 139 | 1.96% | 2.57% | 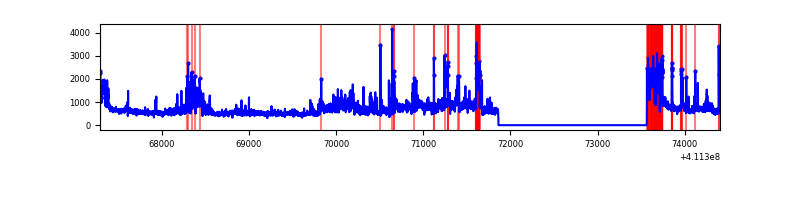 |
| B | 7109 | 5408 | 5 | 5 | 0.07% | 0.09% | 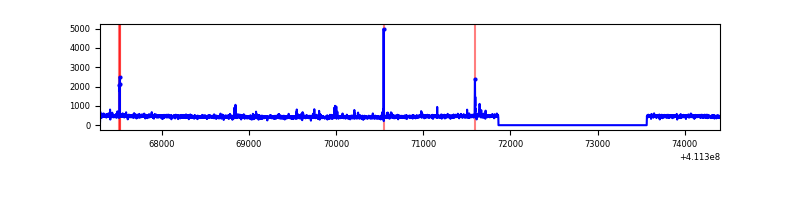 |
| C | 7109 | 5408 | 123 | 123 | 1.73% | 2.27% | 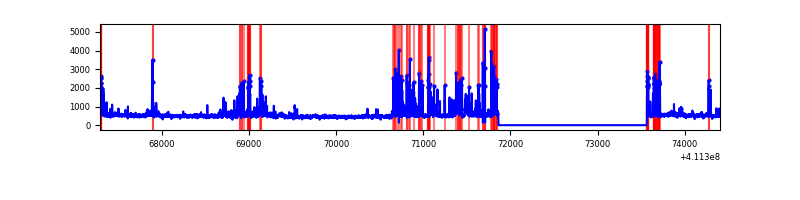 |
| D | 7109 | 5408 | 78 | 78 | 1.10% | 1.44% | 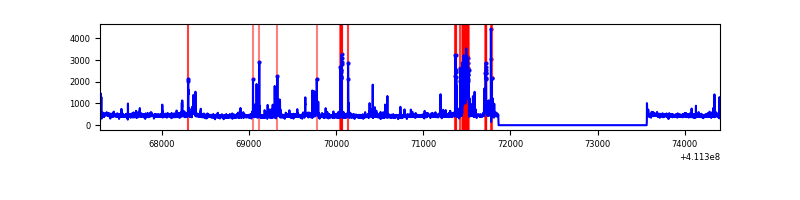 |
Top three noisy pixels from each quadrant. If the there are fewer than three noisy pixels in the level2.evt file, extra rows are filled as -1
| Pixel properties | Quadrant properties | ||||||
|---|---|---|---|---|---|---|---|
| Quadrant | DetID | PixID | Counts | Sigma | Mean | Median | Sigma |
| A | 15 | 222 | 1300017 | 10603.93 | 600 | 589 | 122.5 |
| A | 10 | 83 | 441567 | 3598.58 | 600 | 589 | 122.5 |
| A | 15 | 174 | 79071 | 640.45 | 600 | 589 | 122.5 |
| B | 8 | 3 | 43642 | 365.28 | 602 | 586 | 117.9 |
| B | 5 | 255 | 15863 | 129.61 | 602 | 586 | 117.9 |
| B | 12 | 111 | 15051 | 122.72 | 602 | 586 | 117.9 |
| C | 15 | 208 | 714195 | 5213.9 | 585 | 591 | 136.9 |
| C | 15 | 214 | 226267 | 1648.89 | 585 | 591 | 136.9 |
| C | 9 | 187 | 151591 | 1103.27 | 585 | 591 | 136.9 |
| D | 13 | 249 | 268976 | 1861.01 | 588 | 571 | 144.2 |
| D | 2 | 249 | 80734 | 555.81 | 588 | 571 | 144.2 |
| D | 12 | 227 | 55911 | 383.7 | 588 | 571 | 144.2 |
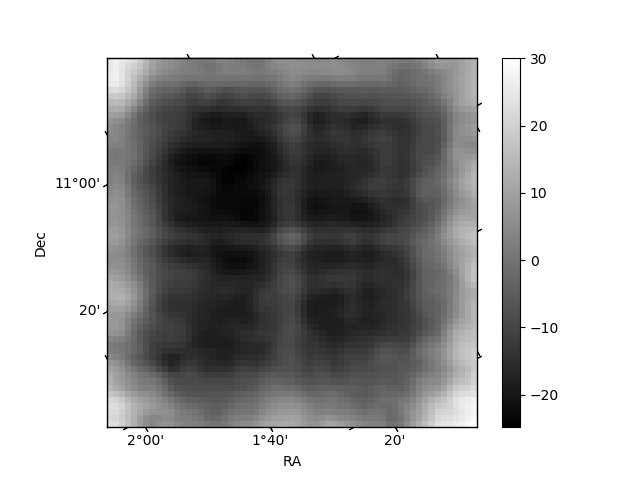
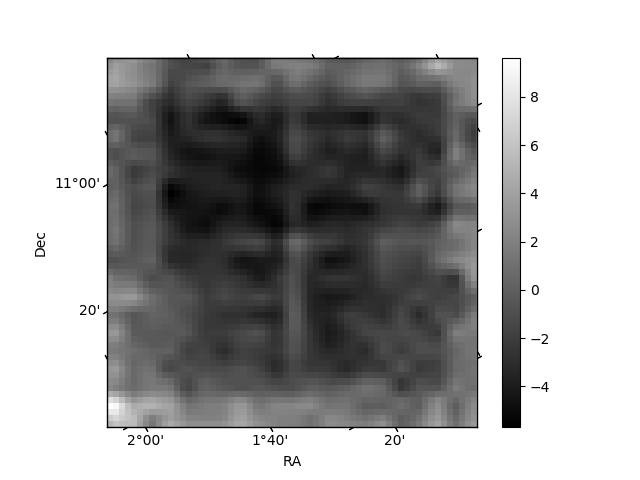
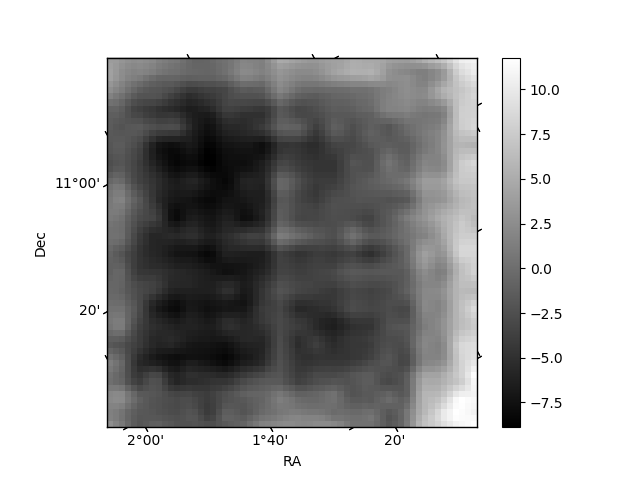
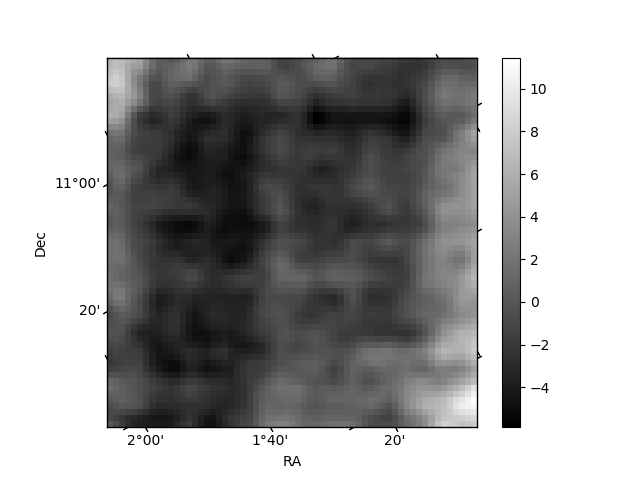
Histogram calculated using DETX and DETY for each event in the final _common_clean file
| Quadrant A | 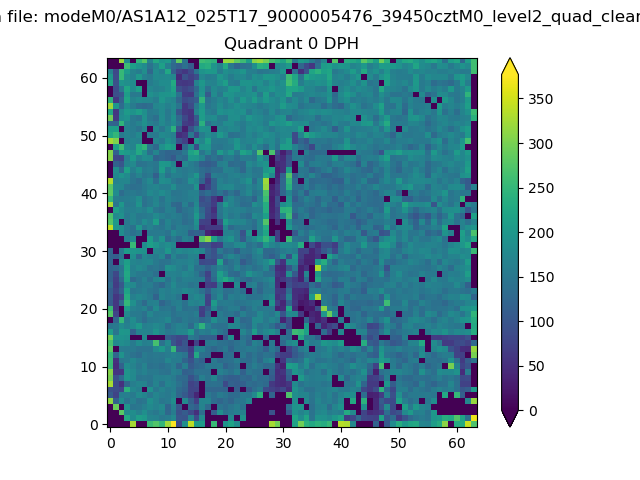 |
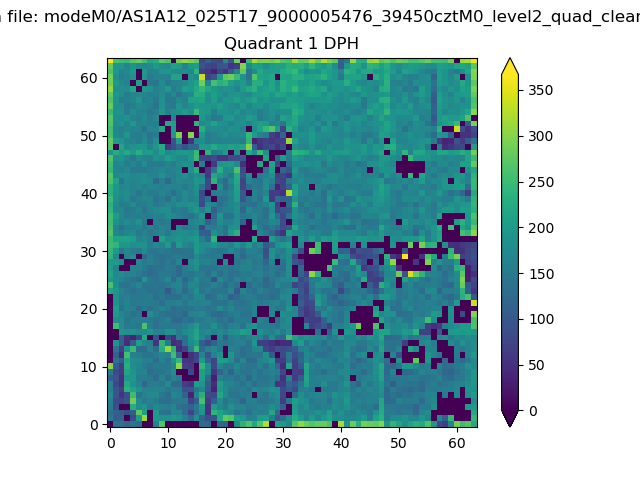 |
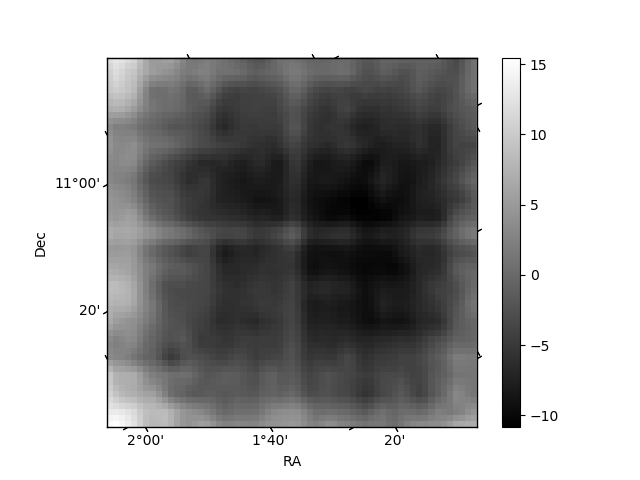
Quadrant B |
|---|---|---|---|
| Quadrant D | 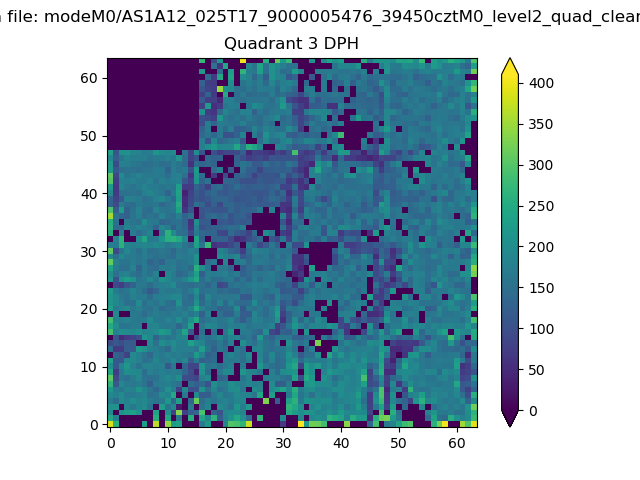 |
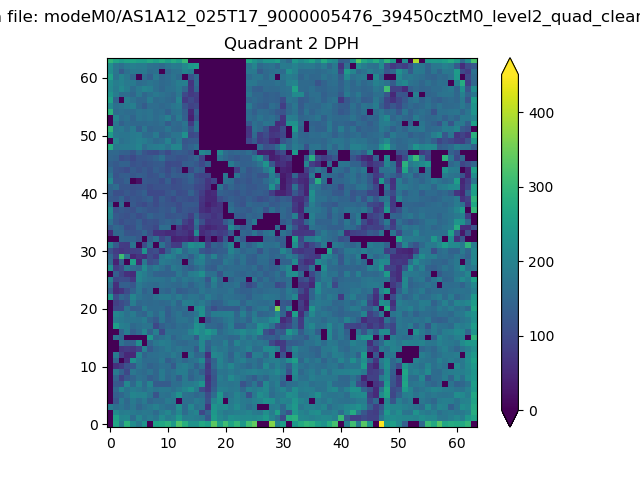 |
Quadrant C |
| Plot type | Count rate plots | Images |
|---|---|---|
| Comparison with Poisson distribution Blue bars denote a histogram of data divided into 1 sec bins. Red curve is a Poisson curve with rate = median count rate of data. |
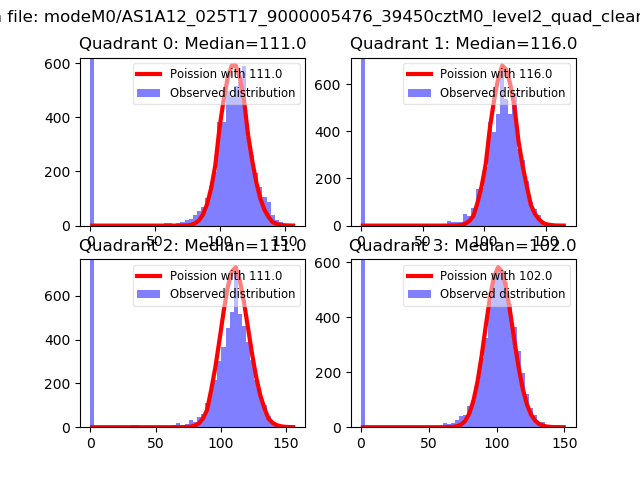 |
 |
| Quadrant-wise count rates Data is divided into 100 sec bins |
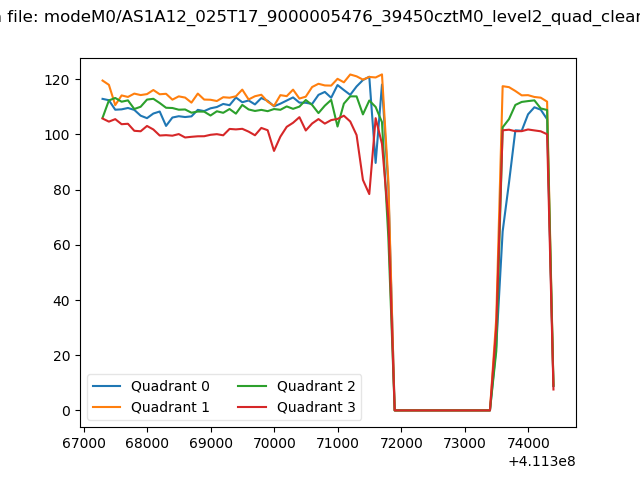 |
|
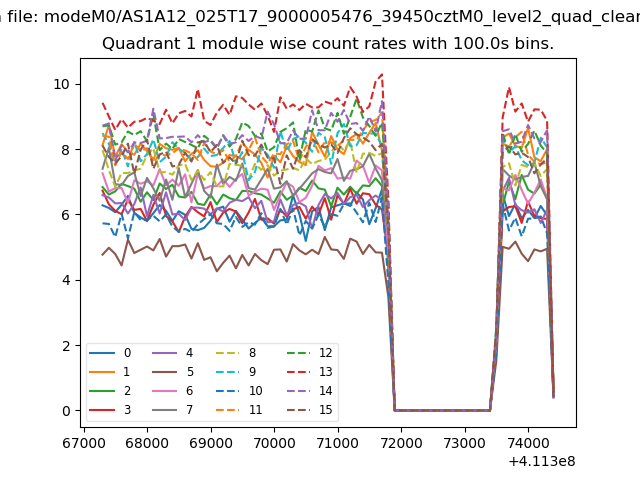
| Module-wise count rates for Quadrant A Data is divided into 100 sec bins |
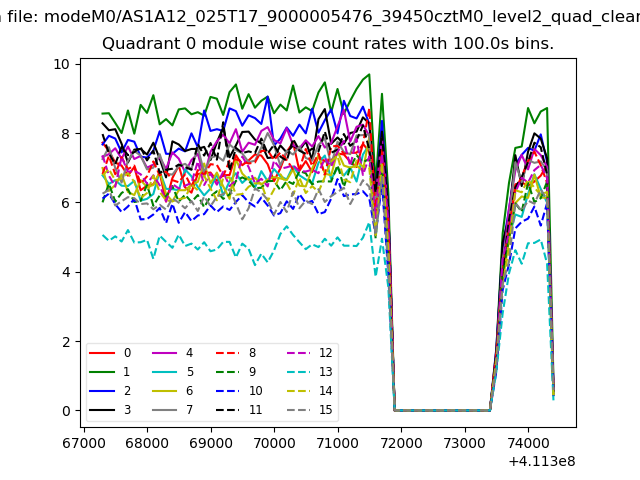 |
 |
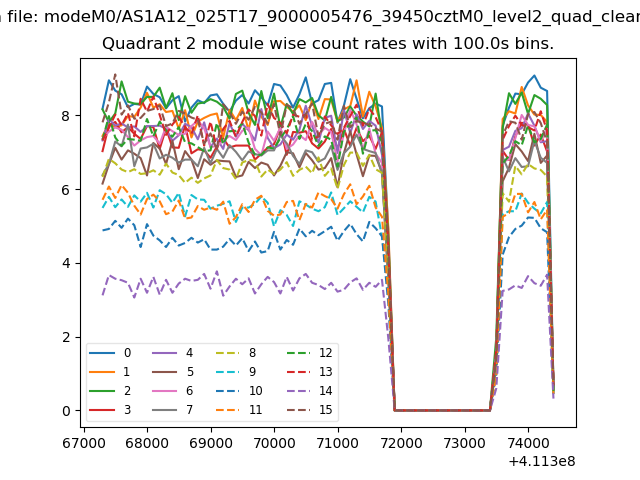
| Module-wise count rates for Quadrant B Data is divided into 100 sec bins |
 |
 |
| Module-wise count rates for Quadrant C Data is divided into 100 sec bins |
 |
 |
| Module-wise count rates for Quadrant D Data is divided into 100 sec bins |
 |
 |
| Parameter | Plot |
|---|---|
| CZT HV Monitor | 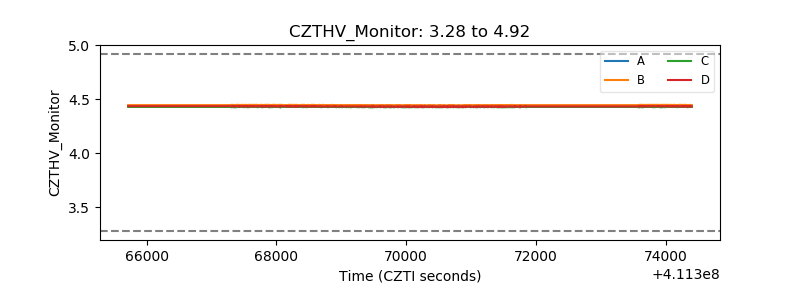 |
| D_VDD | 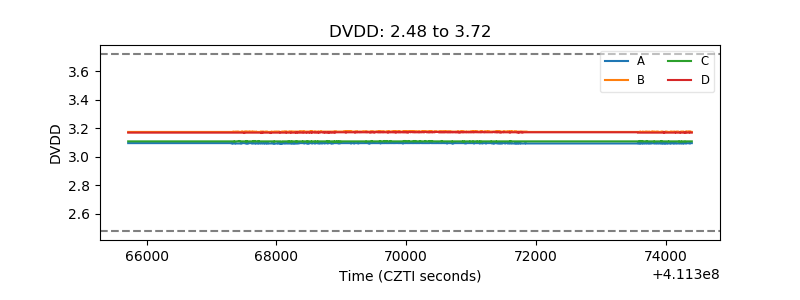 |
| Temperature 1 | 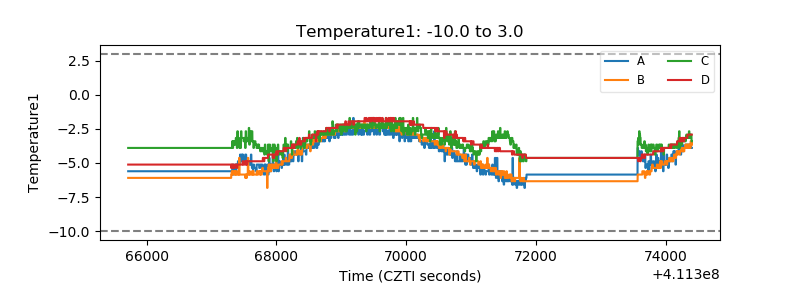 |
| Veto HV Monitor | 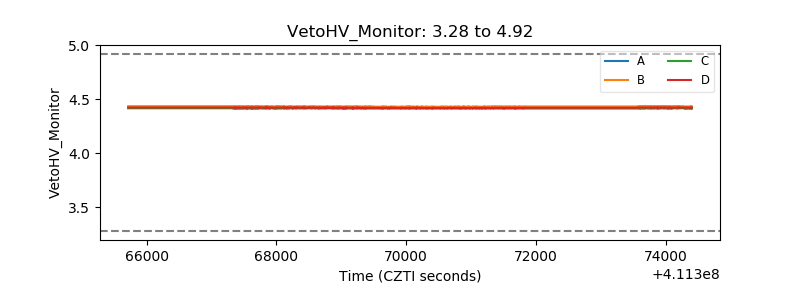 |
| Veto LLD | 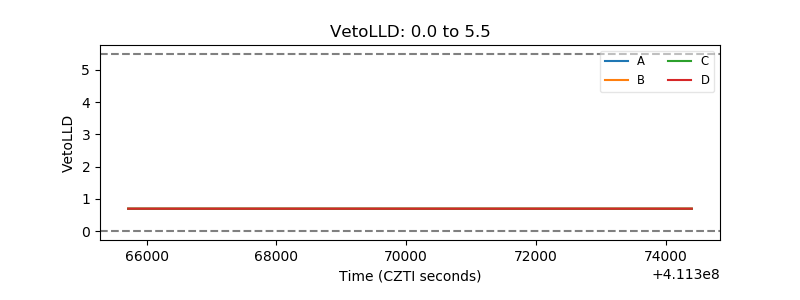 |
| Alpha Counter | 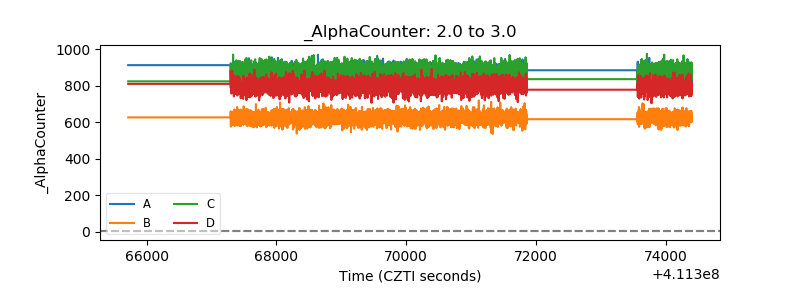 |
| _CPM_Rate | 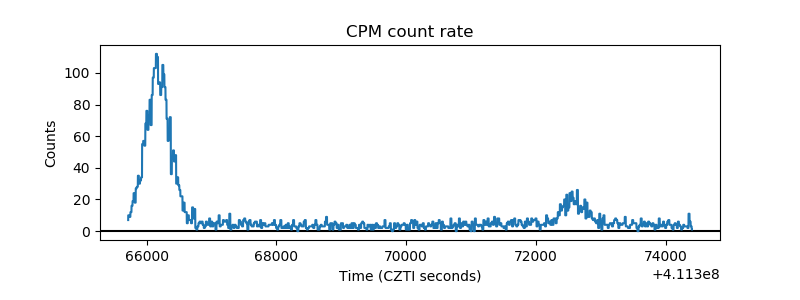 |
| CZT Counter | 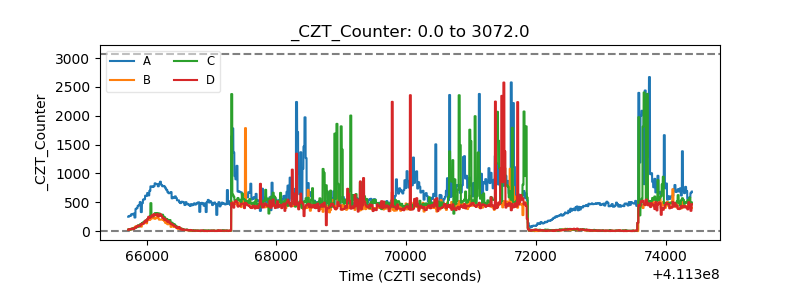 |
| +2.5 Volts monitor | 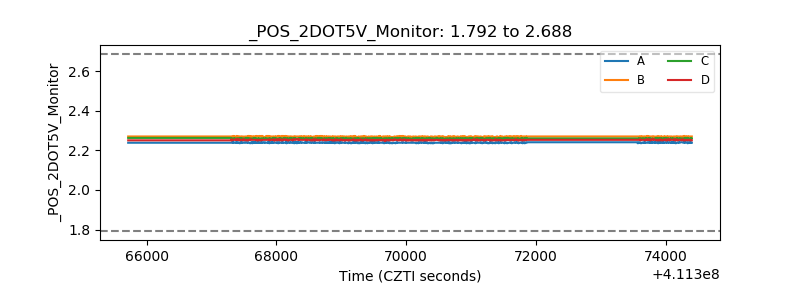 |
| +5 Volts monitor | 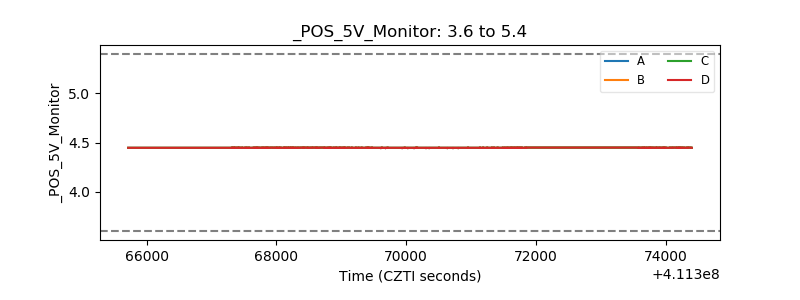 |
| _ROLL_ROT | 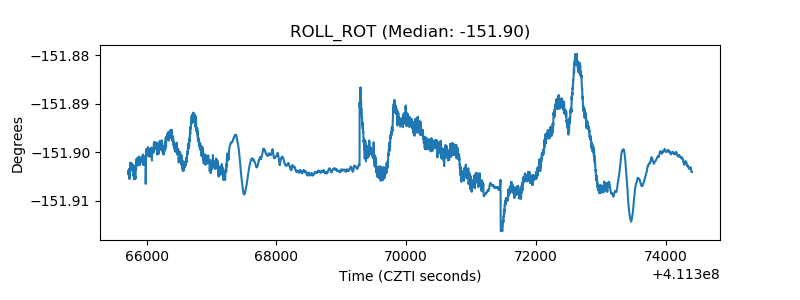 |
| _Roll_DEC | 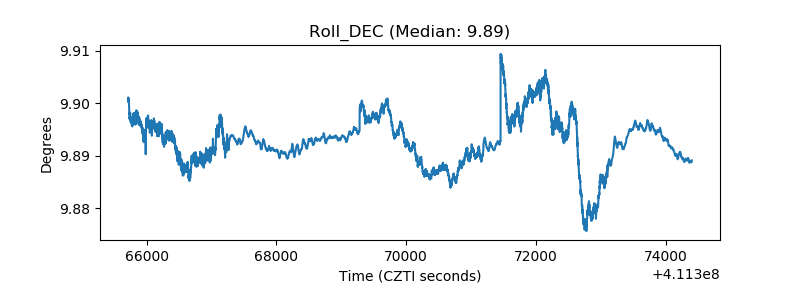 |
| _Roll_RA | 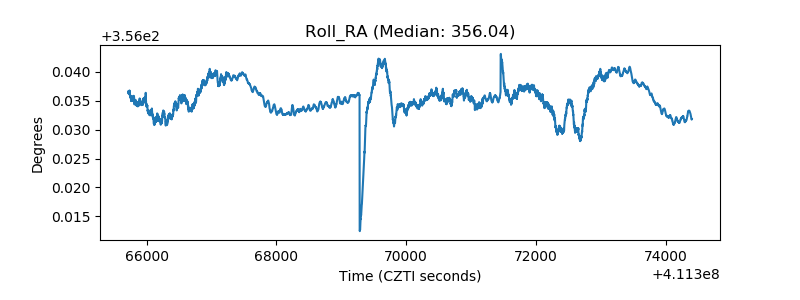 |
| Veto Counter | 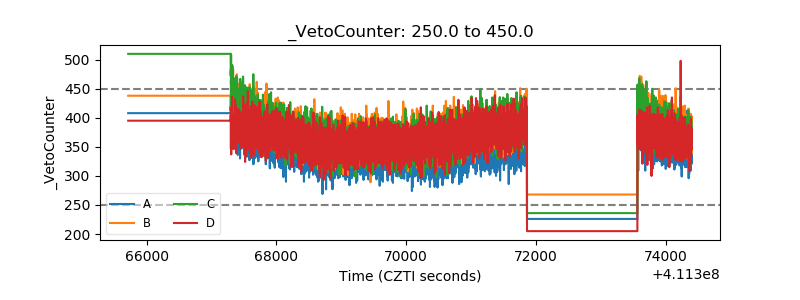 |