| Param | Original file | Final file |
|---|---|---|
| Filename | modeM0/AS1A12_025T17_9000005476_39451cztM0_level2.fits | modeM0/AS1A12_025T17_9000005476_39451cztM0_level2_quad_clean.evt |
| Size (bytes) | 495,040,320 | 89,208,000 |
| Size | 472.1 MB | 85.1 MB |
| Events in quadrant A | 6,667,430 | 567,505 |
| Events in quadrant B | 2,596,101 | 647,465 |
| Events in quadrant C | 3,998,891 | 603,720 |
| Events in quadrant D | 4,619,373 | 484,066 |
| Mode M0 | |||
|---|---|---|---|
| Quadrant | BADHDUFLAG | Total packets | Discarded packets |
| A | 0 | 23769 | 3 |
| B | 0 | 11645 | 2 |
| C | 0 | 15535 | 2 |
| D | 0 | 17777 | 2 |
| Mode SS | |||
|---|---|---|---|
| Quadrant | BADHDUFLAG | Total packets | Discarded packets |
| A | 0 | 114 | 0 |
| B | 0 | 114 | 0 |
| C | 0 | 114 | 0 |
| D | 0 | 114 | 0 |
| Mode M9 | |||
|---|---|---|---|
| Quadrant | BADHDUFLAG | Total packets | Discarded packets |
| A | 0 | 26 | 0 |
| B | 0 | 26 | 0 |
| C | 0 | 26 | 0 |
| D | 0 | 27 | 0 |
| Quadrant | Total seconds | Saturated seconds | Saturation percentage |
|---|---|---|---|
| A | 5703 | 757 | 13.273716% |
| B | 5703 | 20 | 0.350693% |
| C | 5703 | 247 | 4.331054% |
| D | 5703 | 909 | 15.938979% |
Noise dominated data is calculated using 1-second bins in cleaned event files. If a bin has >2000 counts, and if more than 50% of those come from <1% of pixels, then it is considered to be noise-dominated and hence unusable.
| Quadrant | # 1 sec bins | Bins with >0 counts | Bins with >2000 counts | High rate bins dominated by noise | Noise dominated (total time) | Noise dominated (detector-on time) | Marked lightcurve |
|---|---|---|---|---|---|---|---|
| A | 7136 | 5703 | 678 | 678 | 9.50% | 11.89% | 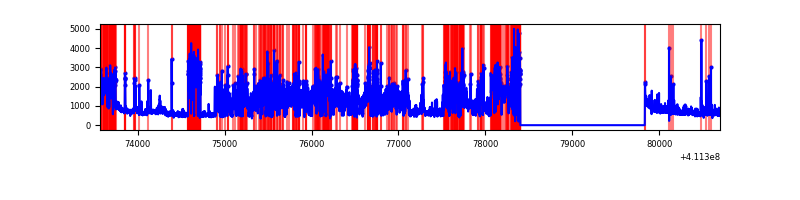 |
| B | 7136 | 5704 | 11 | 11 | 0.15% | 0.19% | 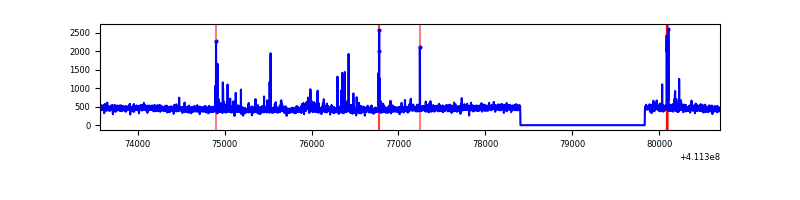 |
| C | 7136 | 5704 | 212 | 212 | 2.97% | 3.72% | 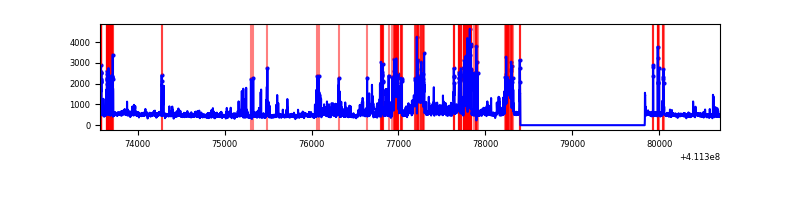 |
| D | 7136 | 5704 | 708 | 708 | 9.92% | 12.41% | 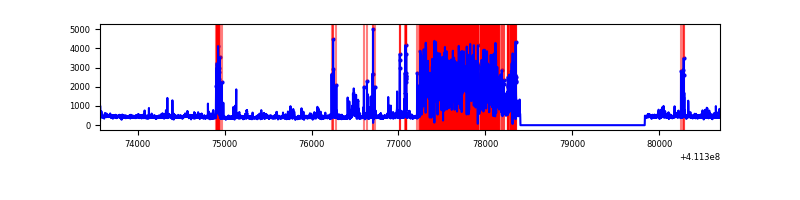 |
Top three noisy pixels from each quadrant. If the there are fewer than three noisy pixels in the level2.evt file, extra rows are filled as -1
| Pixel properties | Quadrant properties | ||||||
|---|---|---|---|---|---|---|---|
| Quadrant | DetID | PixID | Counts | Sigma | Mean | Median | Sigma |
| A | 15 | 222 | 3721606 | 30189.43 | 603 | 590 | 123.3 |
| A | 10 | 83 | 450499 | 3650.21 | 603 | 590 | 123.3 |
| A | 15 | 174 | 114511 | 924.27 | 603 | 590 | 123.3 |
| B | 8 | 3 | 80947 | 651.17 | 630 | 613 | 123.4 |
| B | 12 | 111 | 15510 | 120.75 | 630 | 613 | 123.4 |
| B | 0 | 230 | 14540 | 112.89 | 630 | 613 | 123.4 |
| C | 15 | 208 | 1005841 | 6984.23 | 608 | 610 | 143.9 |
| C | 9 | 187 | 373953 | 2593.94 | 608 | 610 | 143.9 |
| C | 15 | 214 | 234087 | 1622.17 | 608 | 610 | 143.9 |
| D | 2 | 249 | 1932212 | 13932.18 | 563 | 546 | 138.6 |
| D | 12 | 227 | 249015 | 1792.09 | 563 | 546 | 138.6 |
| D | 13 | 249 | 137405 | 987.1 | 563 | 546 | 138.6 |
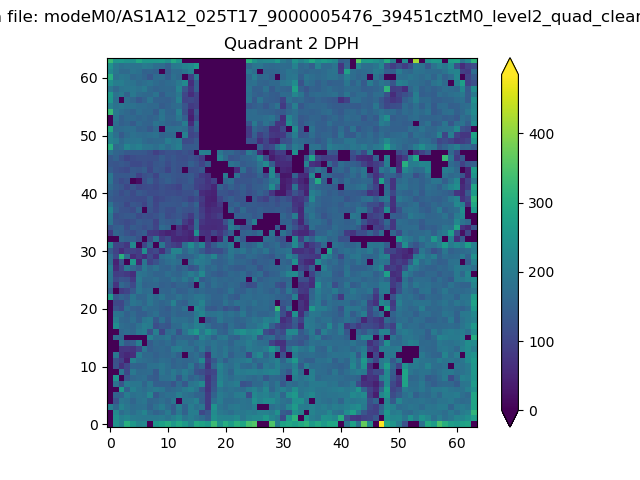
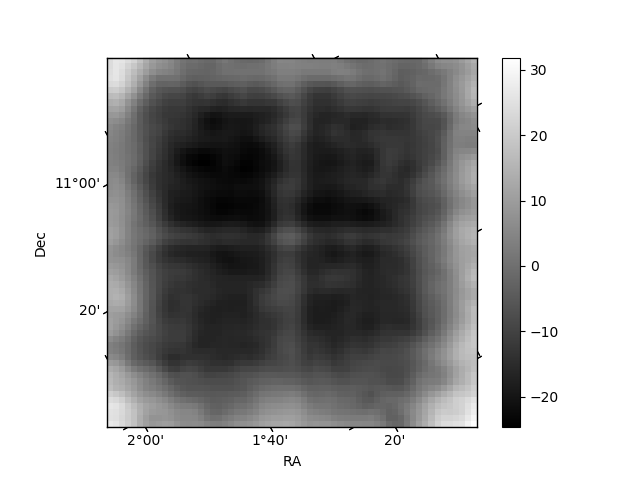
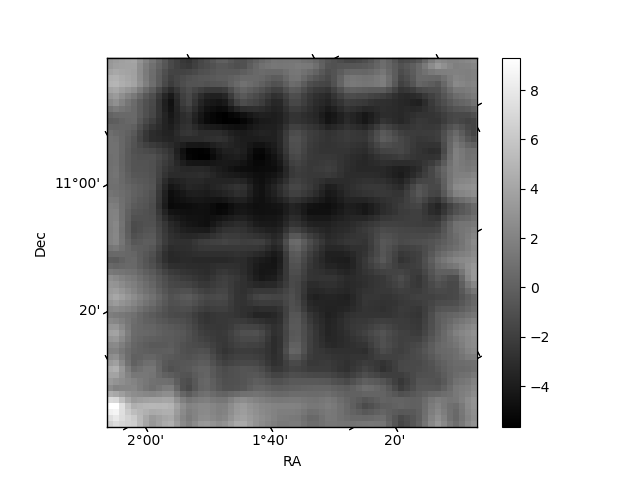
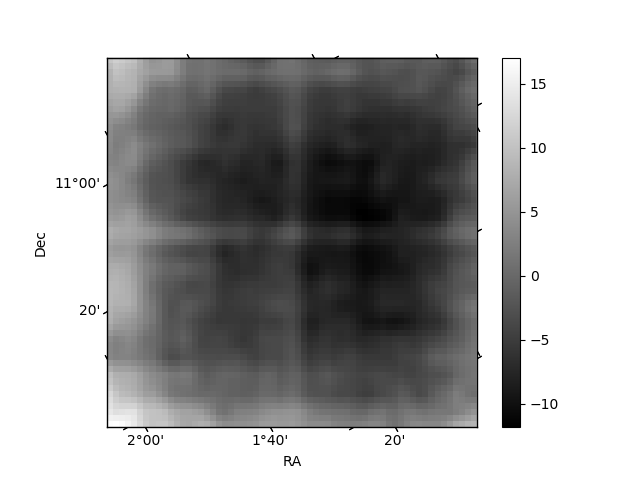
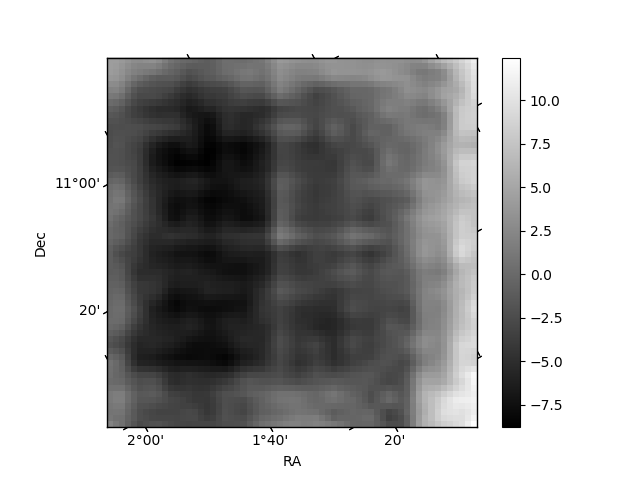
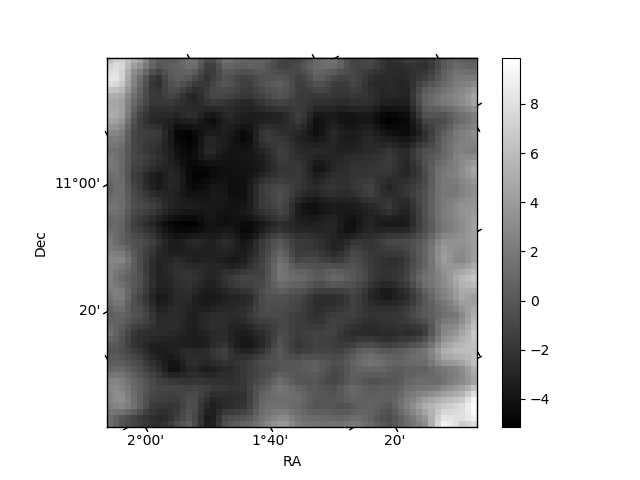
Histogram calculated using DETX and DETY for each event in the final _common_clean file
| Quadrant A | 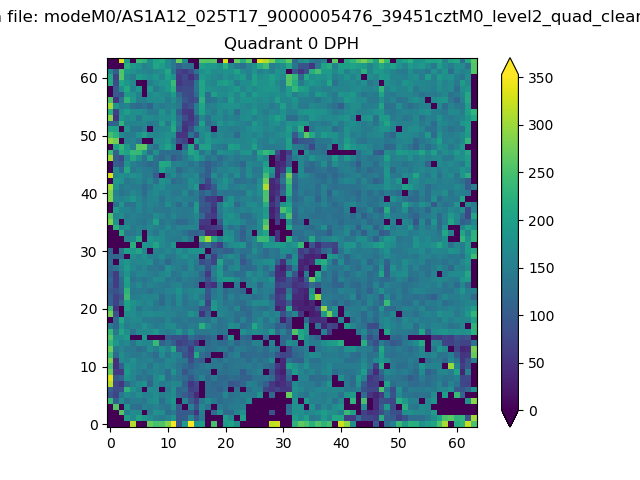 |
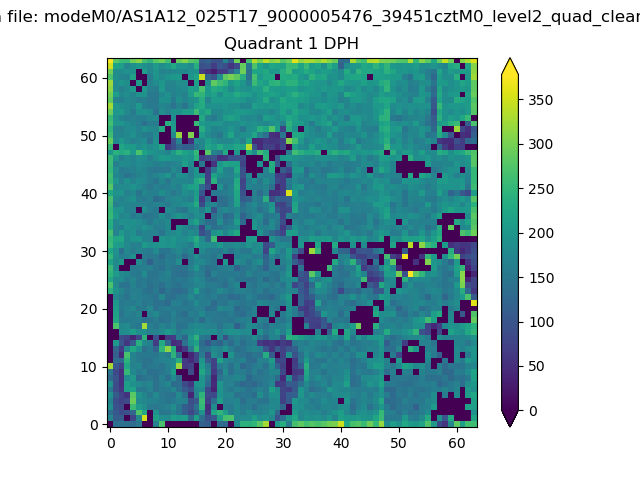 |
Quadrant B |
|---|---|---|---|
| Quadrant D | 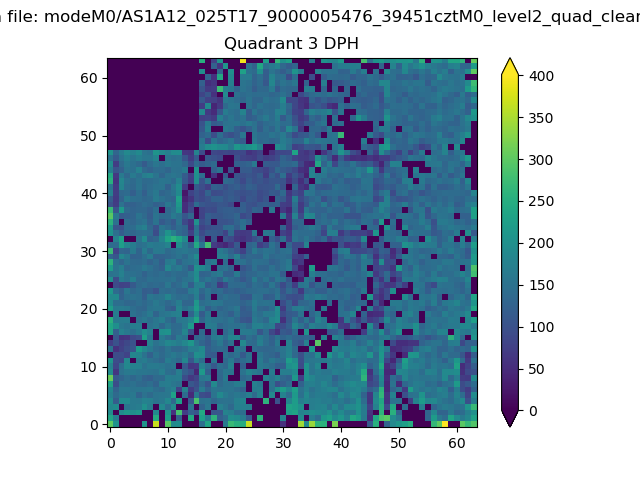 |
 |
Quadrant C |
| Plot type | Count rate plots | Images |
|---|---|---|
| Comparison with Poisson distribution Blue bars denote a histogram of data divided into 1 sec bins. Red curve is a Poisson curve with rate = median count rate of data. |
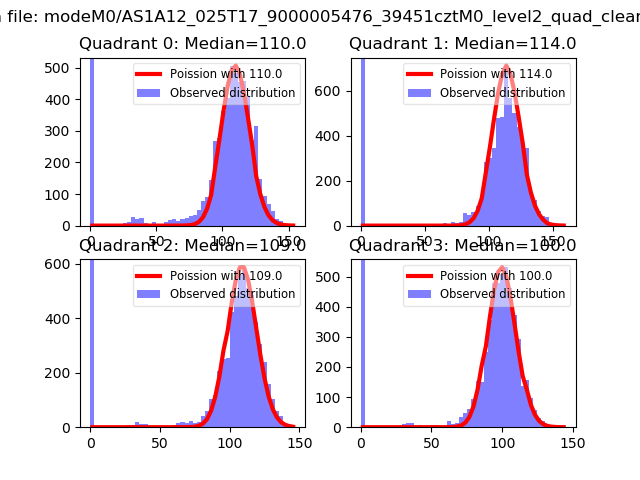 |
 |
| Quadrant-wise count rates Data is divided into 100 sec bins |
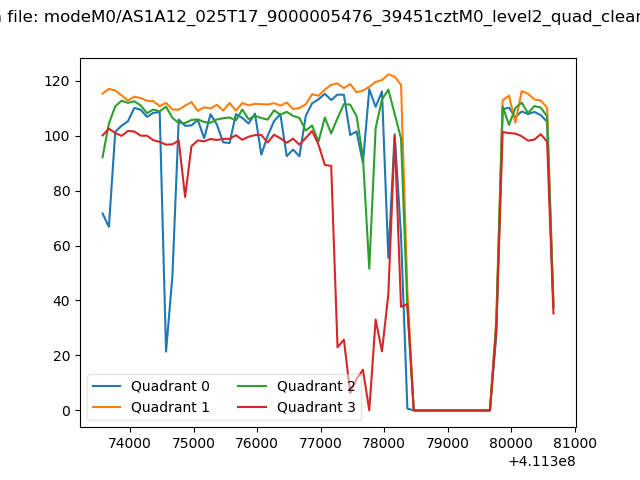 |
|
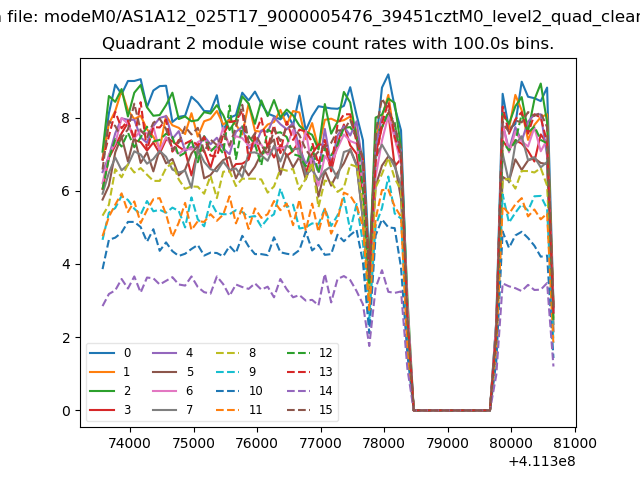
| Module-wise count rates for Quadrant A Data is divided into 100 sec bins |
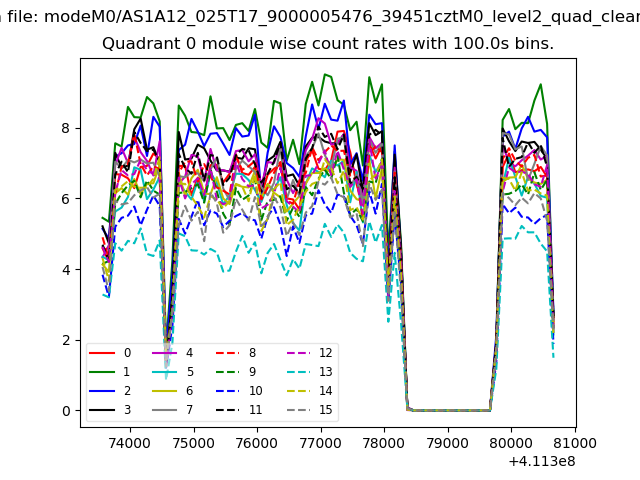 |
 |
| Module-wise count rates for Quadrant B Data is divided into 100 sec bins |
 |
 |
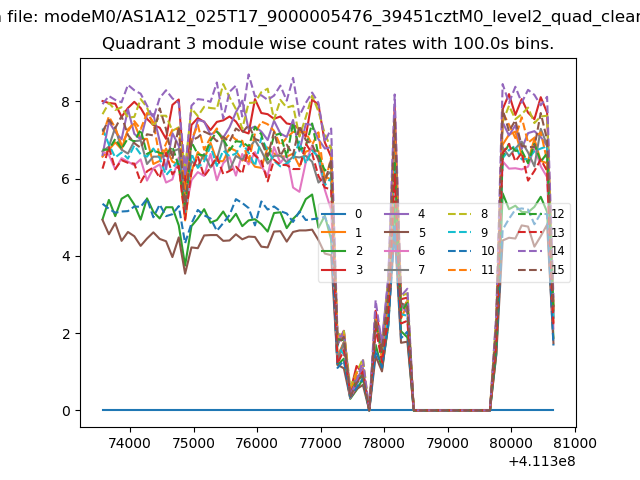
| Module-wise count rates for Quadrant C Data is divided into 100 sec bins |
 |
 |
| Module-wise count rates for Quadrant D Data is divided into 100 sec bins |
 |
 |
| Parameter | Plot |
|---|---|
| CZT HV Monitor | 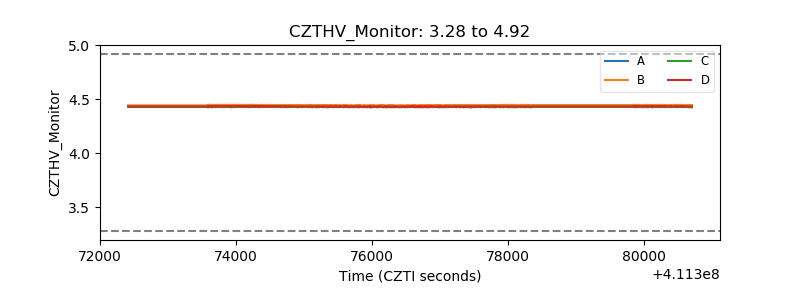 |
| D_VDD | 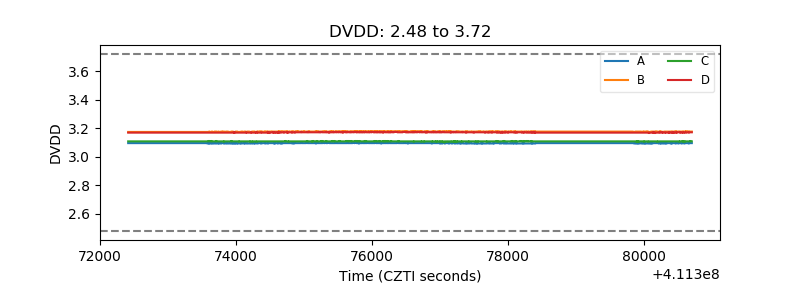 |
| Temperature 1 | 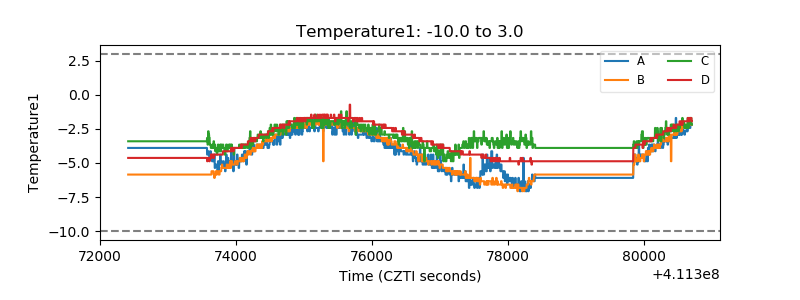 |
| Veto HV Monitor | 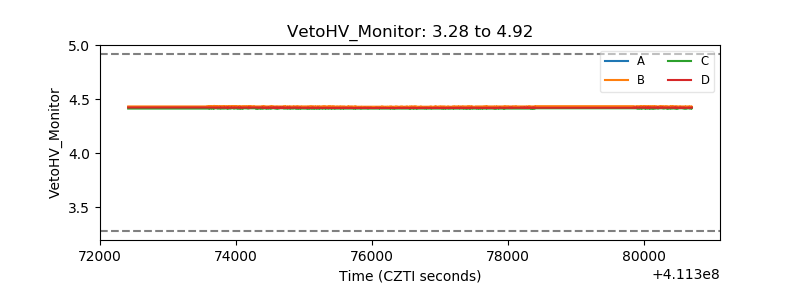 |
| Veto LLD | 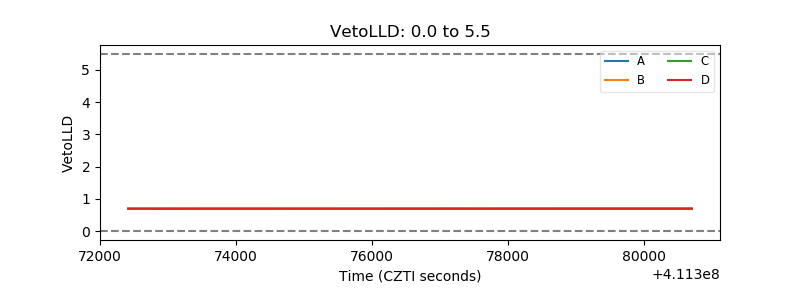 |
| Alpha Counter | 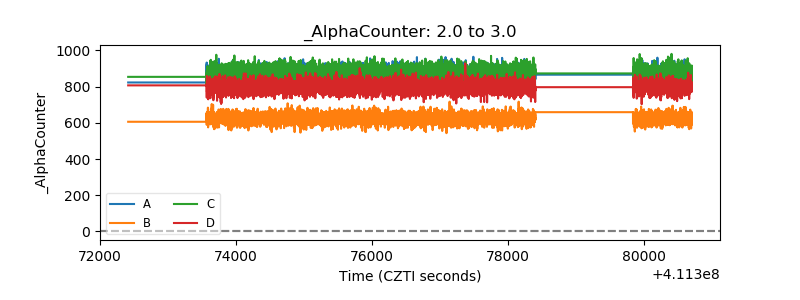 |
| _CPM_Rate | 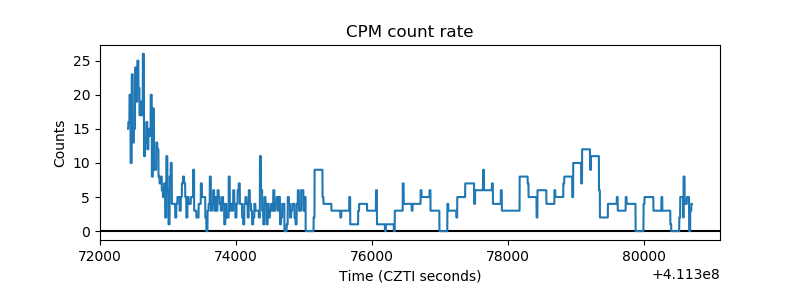 |
| CZT Counter | 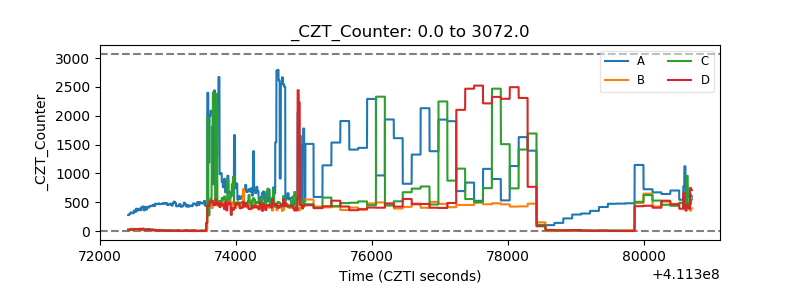 |
| +2.5 Volts monitor | 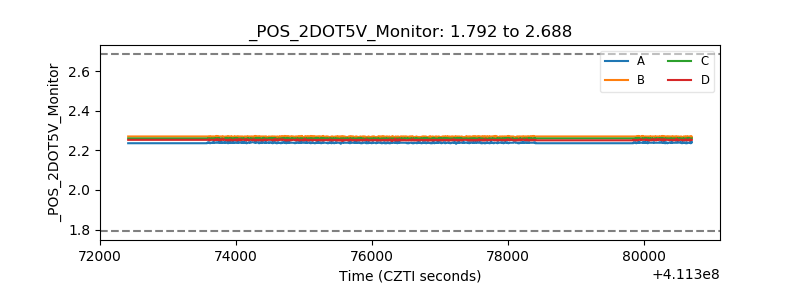 |
| +5 Volts monitor | 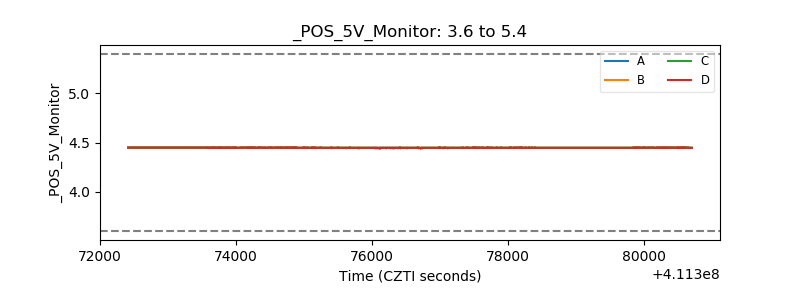 |
| _ROLL_ROT | 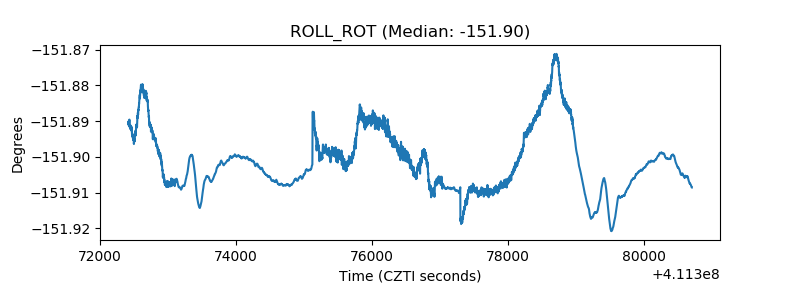 |
| _Roll_DEC | 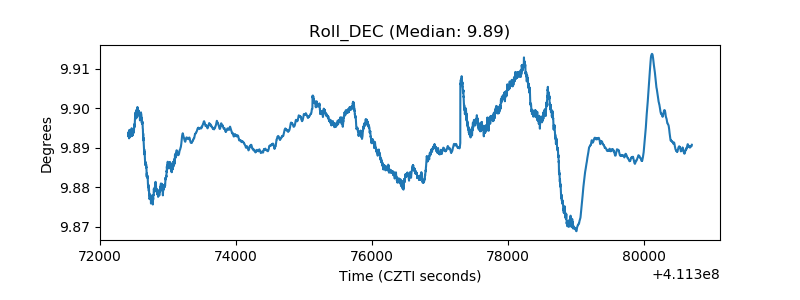 |
| _Roll_RA | 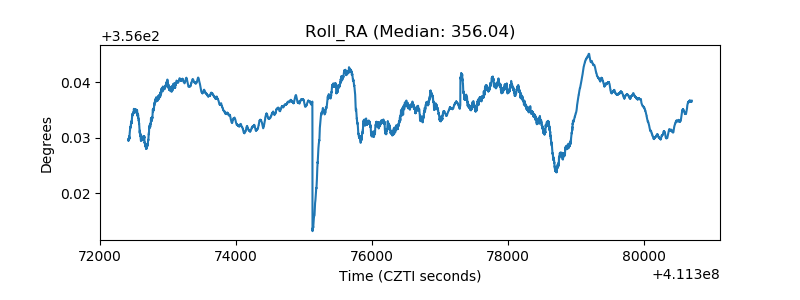 |
| Veto Counter | 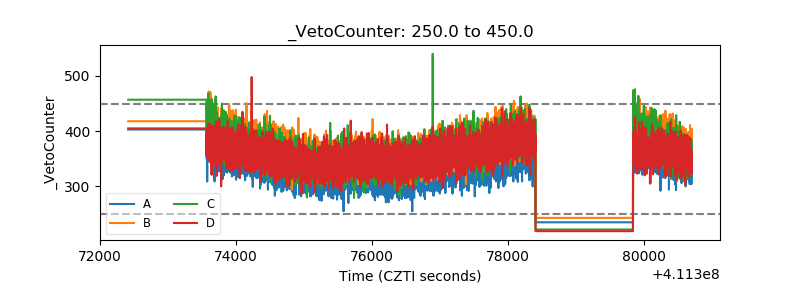 |