| Param | Original file | Final file |
|---|---|---|
| Filename | modeM0/AS1A12_025T17_9000005476_39452cztM0_level2.fits | modeM0/AS1A12_025T17_9000005476_39452cztM0_level2_quad_clean.evt |
| Size (bytes) | 536,440,320 | 93,009,600 |
| Size | 511.6 MB | 88.7 MB |
| Events in quadrant A | 8,738,515 | 518,415 |
| Events in quadrant B | 3,093,662 | 666,834 |
| Events in quadrant C | 3,923,635 | 631,977 |
| Events in quadrant D | 3,639,373 | 582,897 |
| Mode M0 | |||
|---|---|---|---|
| Quadrant | BADHDUFLAG | Total packets | Discarded packets |
| A | 0 | 30068 | 3 |
| B | 0 | 13141 | 2 |
| C | 0 | 15341 | 2 |
| D | 0 | 14949 | 2 |
| Mode SS | |||
|---|---|---|---|
| Quadrant | BADHDUFLAG | Total packets | Discarded packets |
| A | 0 | 120 | 0 |
| B | 0 | 120 | 0 |
| C | 0 | 120 | 0 |
| D | 0 | 120 | 0 |
| Mode M9 | |||
|---|---|---|---|
| Quadrant | BADHDUFLAG | Total packets | Discarded packets |
| A | 0 | 13 | 0 |
| B | 0 | 13 | 0 |
| C | 0 | 13 | 0 |
| D | 0 | 14 | 0 |
| Quadrant | Total seconds | Saturated seconds | Saturation percentage |
|---|---|---|---|
| A | 5955 | 1563 | 26.246851% |
| B | 5955 | 61 | 1.024349% |
| C | 5955 | 169 | 2.837951% |
| D | 5955 | 177 | 2.972292% |
Noise dominated data is calculated using 1-second bins in cleaned event files. If a bin has >2000 counts, and if more than 50% of those come from <1% of pixels, then it is considered to be noise-dominated and hence unusable.
| Quadrant | # 1 sec bins | Bins with >0 counts | Bins with >2000 counts | High rate bins dominated by noise | Noise dominated (total time) | Noise dominated (detector-on time) | Marked lightcurve |
|---|---|---|---|---|---|---|---|
| A | 7266 | 5955 | 1471 | 1471 | 20.24% | 24.70% | 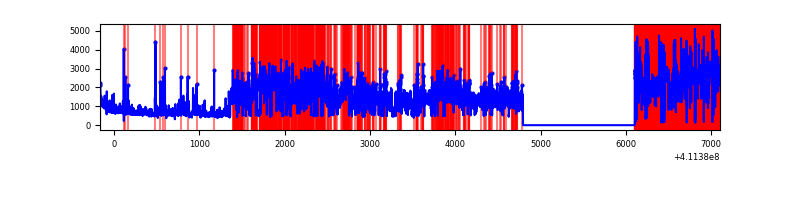 |
| B | 7267 | 5956 | 49 | 49 | 0.67% | 0.82% | 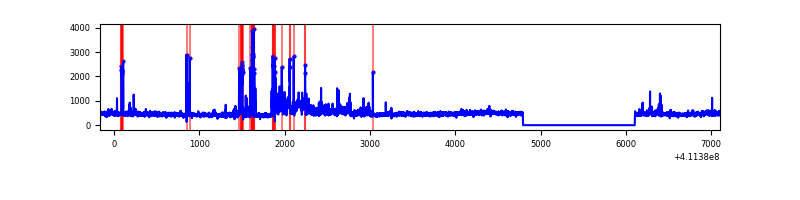 |
| C | 7267 | 5956 | 156 | 156 | 2.15% | 2.62% | 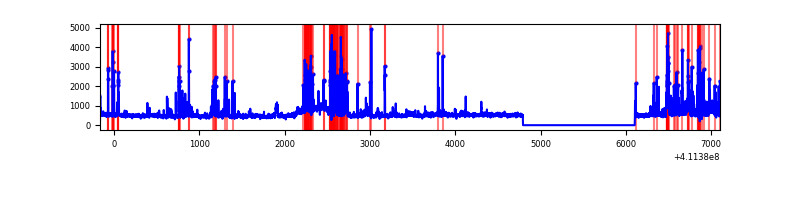 |
| D | 7267 | 5956 | 166 | 166 | 2.28% | 2.79% | 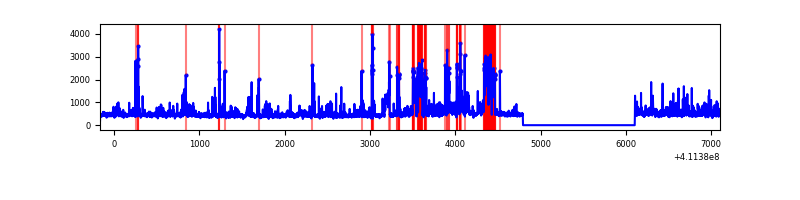 |
Top three noisy pixels from each quadrant. If the there are fewer than three noisy pixels in the level2.evt file, extra rows are filled as -1
| Pixel properties | Quadrant properties | ||||||
|---|---|---|---|---|---|---|---|
| Quadrant | DetID | PixID | Counts | Sigma | Mean | Median | Sigma |
| A | 15 | 222 | 5944277 | 49788.27 | 586 | 575 | 119.4 |
| A | 10 | 83 | 420858 | 3520.56 | 586 | 575 | 119.4 |
| A | 15 | 174 | 36899 | 304.27 | 586 | 575 | 119.4 |
| B | 8 | 3 | 435744 | 3466.2 | 651 | 634 | 125.5 |
| B | 15 | 85 | 61177 | 482.3 | 651 | 634 | 125.5 |
| B | 0 | 199 | 22556 | 174.64 | 651 | 634 | 125.5 |
| C | 15 | 208 | 754234 | 5070.22 | 633 | 639 | 148.6 |
| C | 9 | 187 | 377891 | 2538.17 | 633 | 639 | 148.6 |
| C | 15 | 214 | 244866 | 1643.17 | 633 | 639 | 148.6 |
| D | 12 | 227 | 820033 | 5273.02 | 637 | 617 | 155.4 |
| D | 13 | 249 | 93014 | 594.58 | 637 | 617 | 155.4 |
| D | 2 | 249 | 85506 | 546.27 | 637 | 617 | 155.4 |
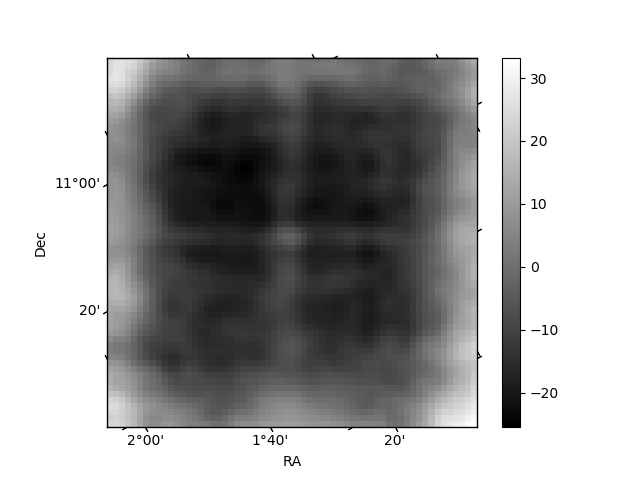
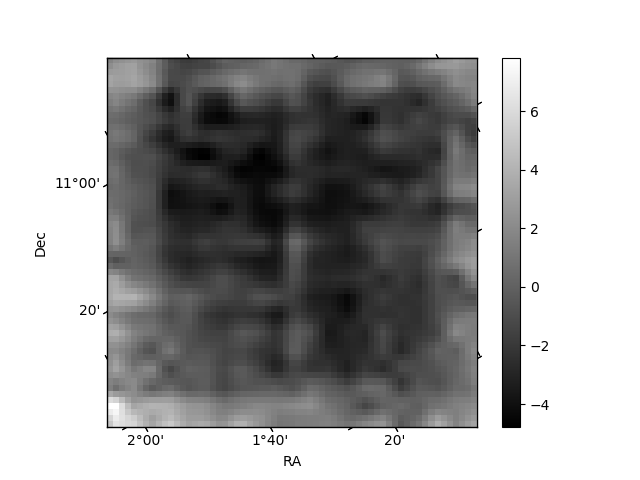
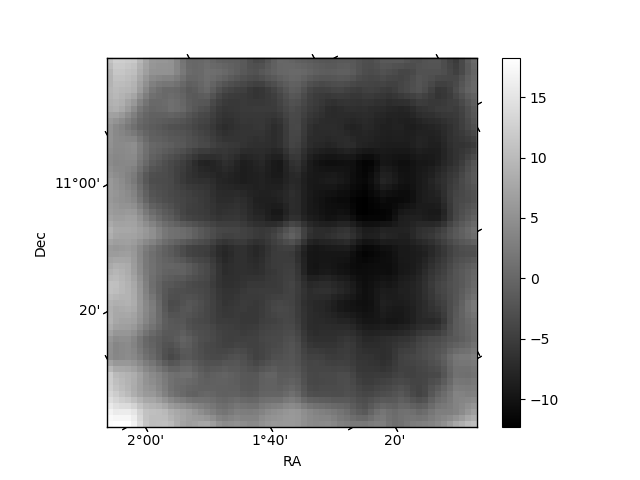
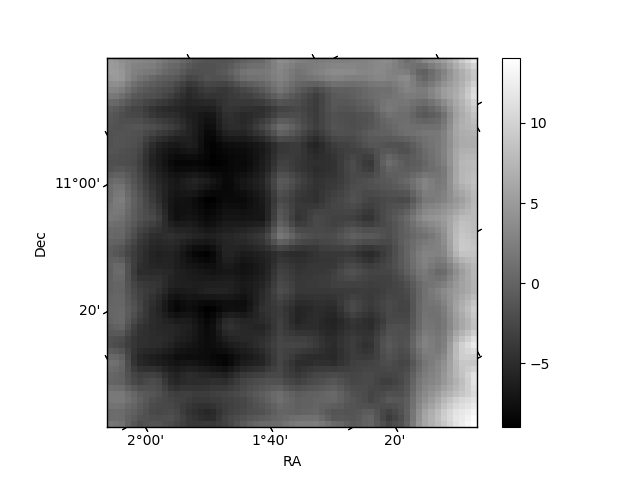
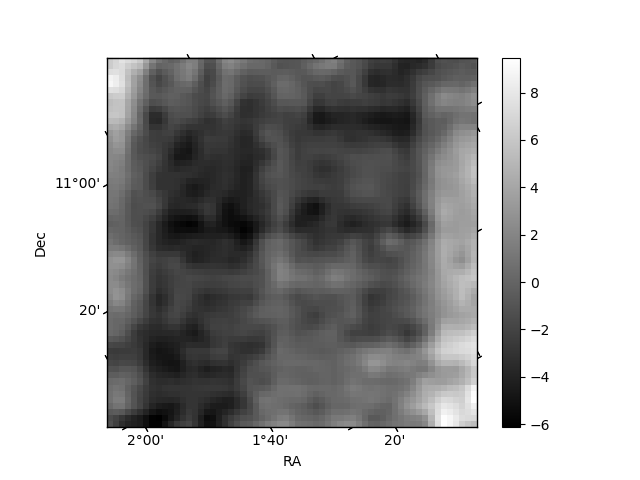
Histogram calculated using DETX and DETY for each event in the final _common_clean file
| Quadrant A | 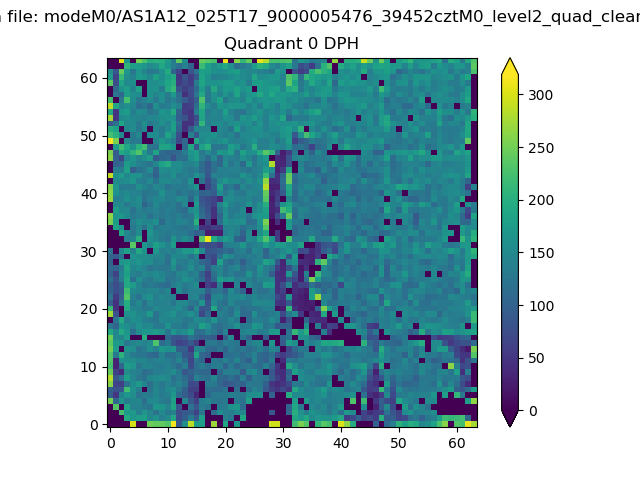 |
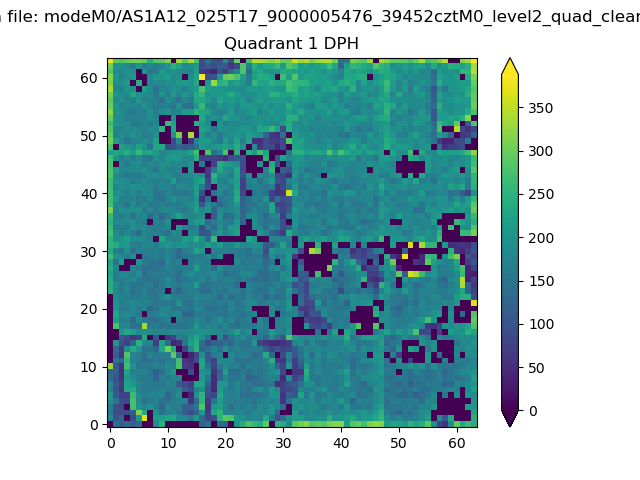 |
Quadrant B |
|---|---|---|---|
| Quadrant D | 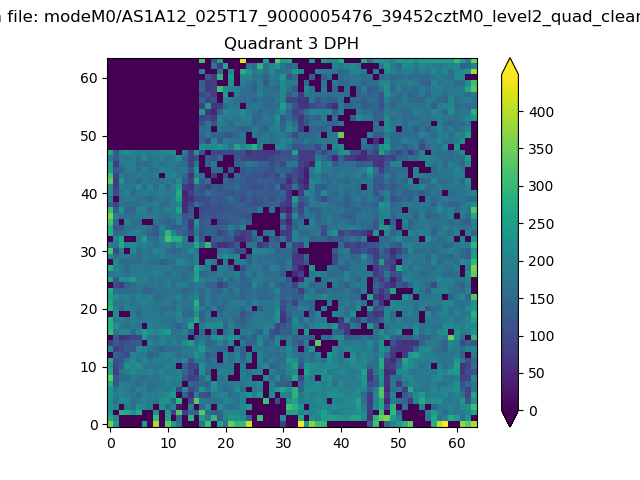 |
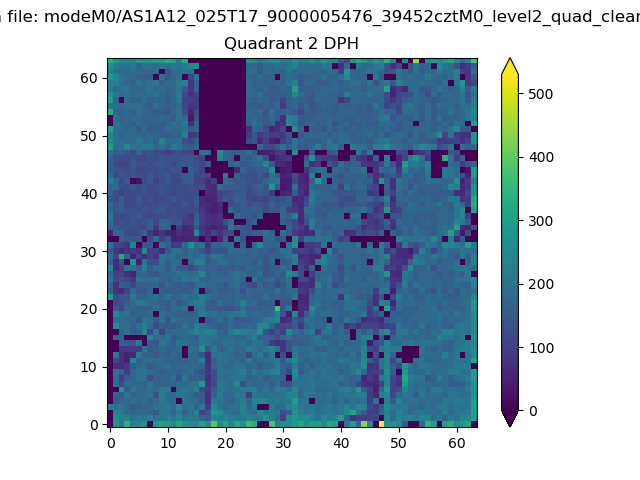 |
Quadrant C |
| Plot type | Count rate plots | Images |
|---|---|---|
| Comparison with Poisson distribution Blue bars denote a histogram of data divided into 1 sec bins. Red curve is a Poisson curve with rate = median count rate of data. |
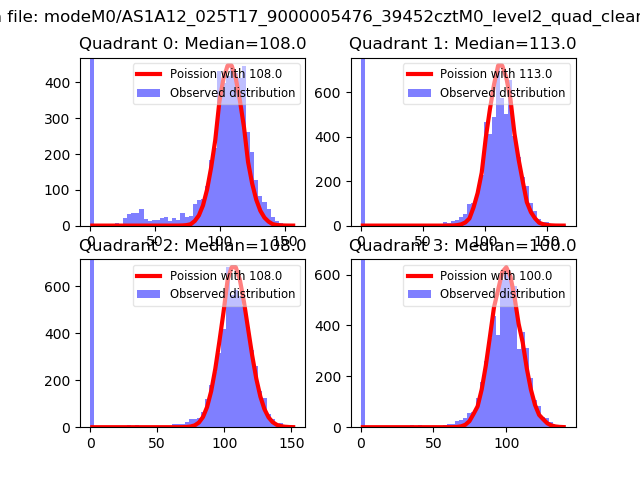 |
 |
| Quadrant-wise count rates Data is divided into 100 sec bins |
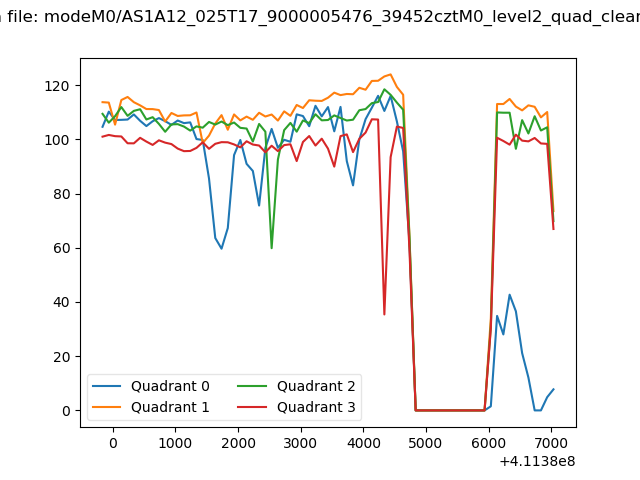 |
|
| Module-wise count rates for Quadrant A Data is divided into 100 sec bins |
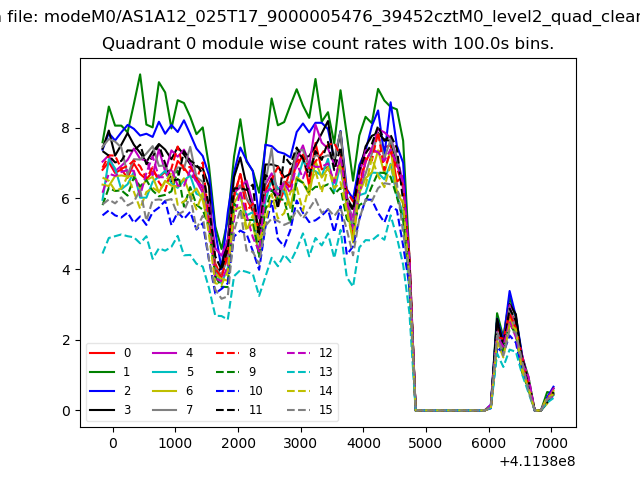 |
 |
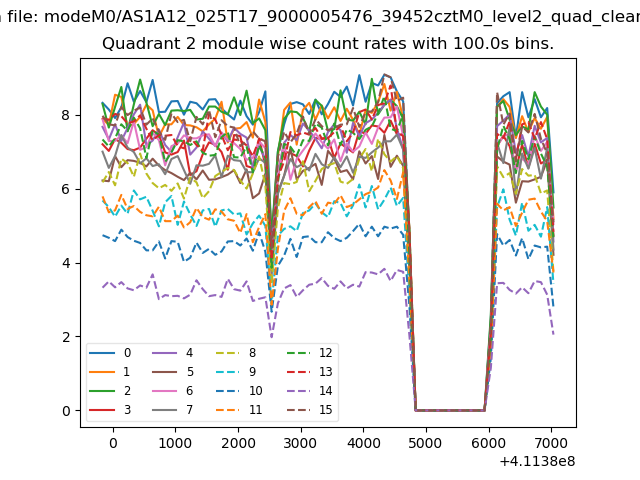
| Module-wise count rates for Quadrant B Data is divided into 100 sec bins |
 |
 |
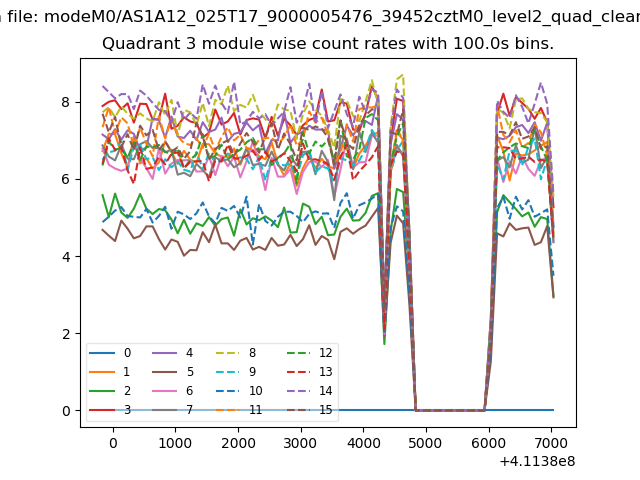
| Module-wise count rates for Quadrant C Data is divided into 100 sec bins |
 |
 |
| Module-wise count rates for Quadrant D Data is divided into 100 sec bins |
 |
 |
| Parameter | Plot |
|---|---|
| CZT HV Monitor |  |
| D_VDD | 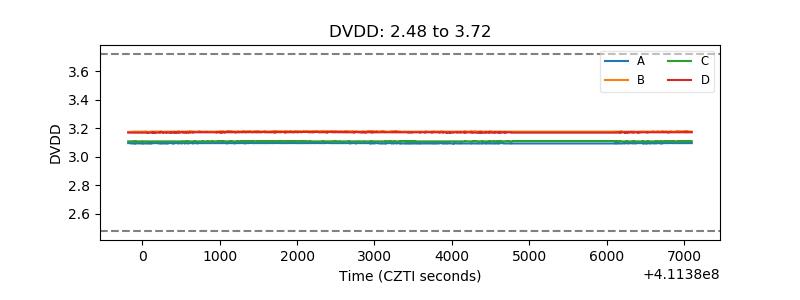 |
| Temperature 1 | 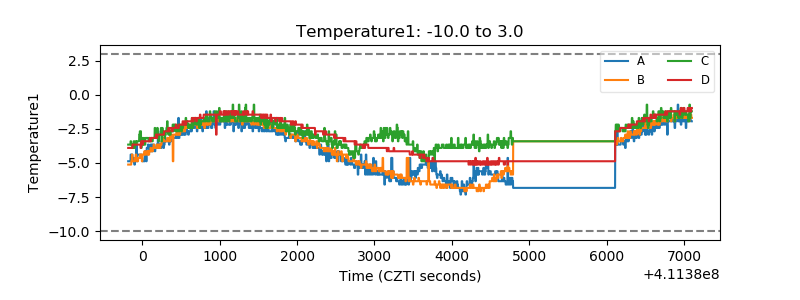 |
| Veto HV Monitor | 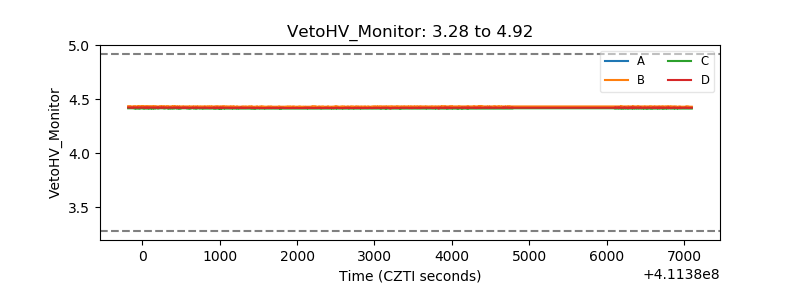 |
| Veto LLD | 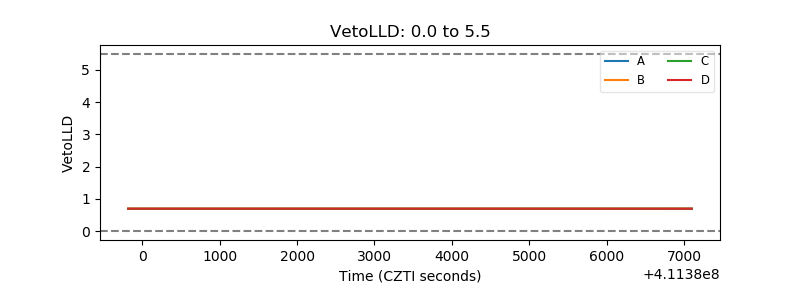 |
| Alpha Counter | 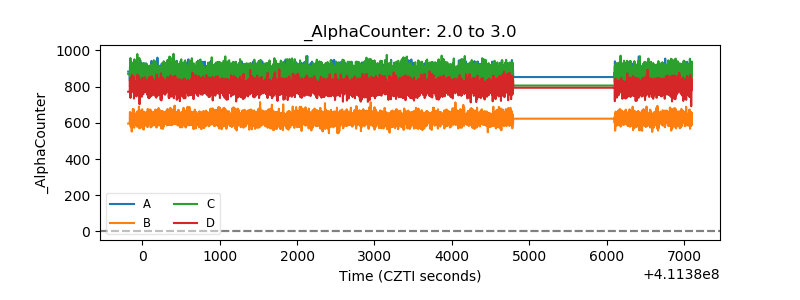 |
| _CPM_Rate | 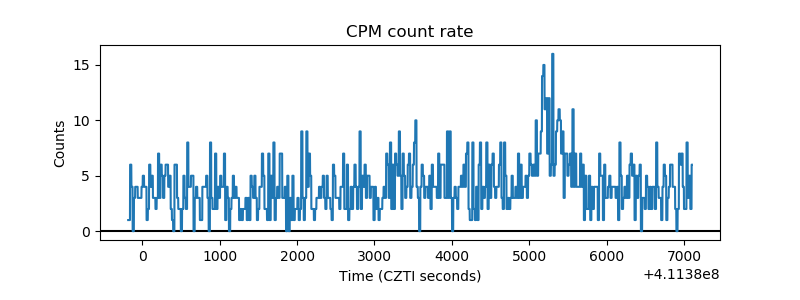 |
| CZT Counter | 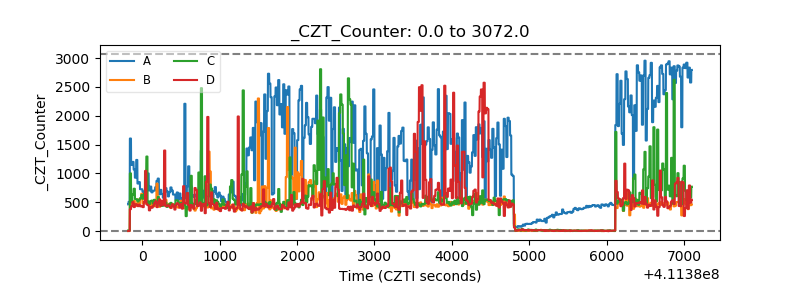 |
| +2.5 Volts monitor | 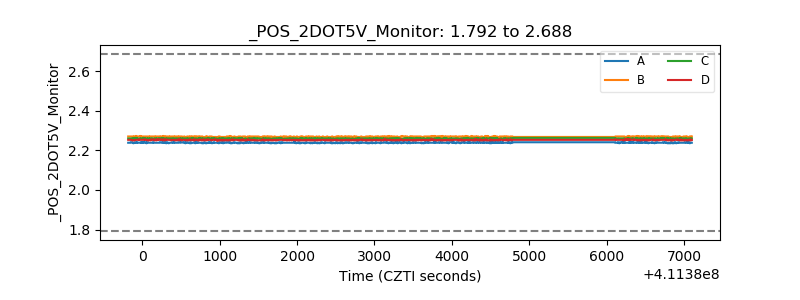 |
| +5 Volts monitor | 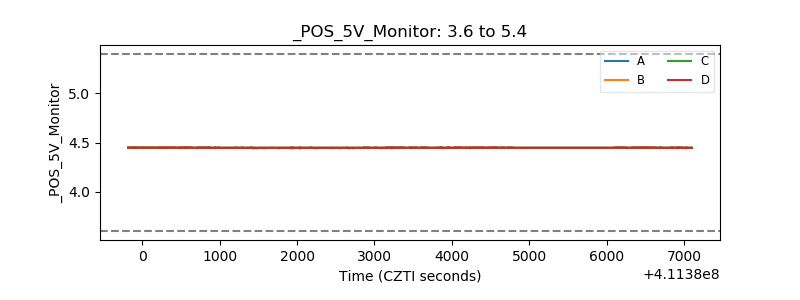 |
| _ROLL_ROT | 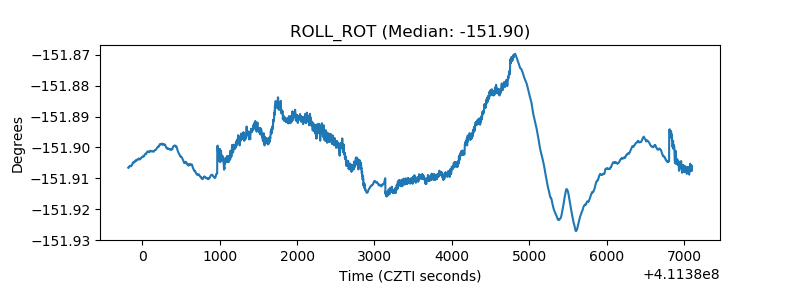 |
| _Roll_DEC | 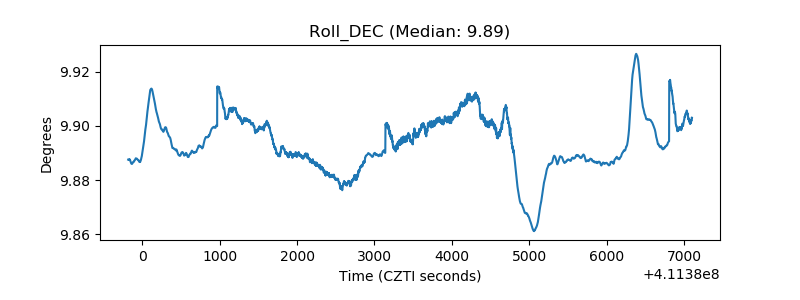 |
| _Roll_RA | 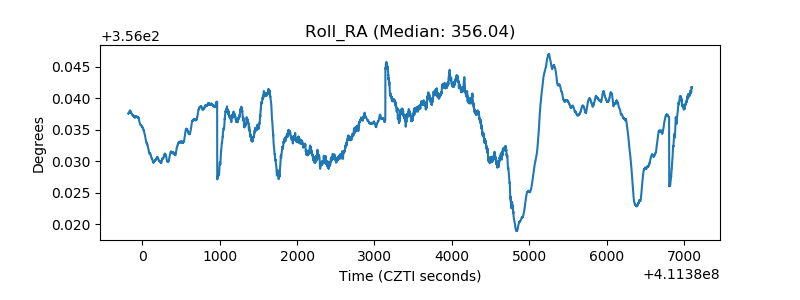 |
| Veto Counter | 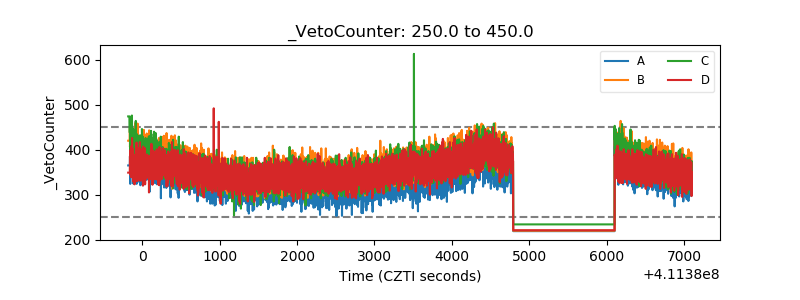 |