| Param | Original file | Final file |
|---|---|---|
| Filename | modeM0/AS1A12_025T17_9000005476_39455cztM0_level2.fits | modeM0/AS1A12_025T17_9000005476_39455cztM0_level2_quad_clean.evt |
| Size (bytes) | 1,224,982,080 | 231,117,120 |
| Size | 1.1 GB | 220.4 MB |
| Events in quadrant A | 19,033,480 | 1,210,473 |
| Events in quadrant B | 6,907,946 | 1,673,097 |
| Events in quadrant C | 8,048,285 | 1,613,695 |
| Events in quadrant D | 10,171,661 | 1,444,610 |
| Mode M0 | |||
|---|---|---|---|
| Quadrant | BADHDUFLAG | Total packets | Discarded packets |
| A | 0 | 66313 | 4 |
| B | 0 | 31210 | 3 |
| C | 0 | 33535 | 3 |
| D | 0 | 40766 | 3 |
| Mode SS | |||
|---|---|---|---|
| Quadrant | BADHDUFLAG | Total packets | Discarded packets |
| A | 0 | 312 | 0 |
| B | 0 | 312 | 0 |
| C | 0 | 312 | 0 |
| D | 0 | 312 | 0 |
| Mode M9 | |||
|---|---|---|---|
| Quadrant | BADHDUFLAG | Total packets | Discarded packets |
| A | 0 | 42 | 0 |
| B | 0 | 42 | 0 |
| C | 0 | 42 | 0 |
| D | 0 | 42 | 0 |
| Quadrant | Total seconds | Saturated seconds | Saturation percentage |
|---|---|---|---|
| A | 15291 | 4243 | 27.748349% |
| B | 15291 | 35 | 0.228893% |
| C | 15291 | 110 | 0.719377% |
| D | 15291 | 715 | 4.675953% |
Noise dominated data is calculated using 1-second bins in cleaned event files. If a bin has >2000 counts, and if more than 50% of those come from <1% of pixels, then it is considered to be noise-dominated and hence unusable.
| Quadrant | # 1 sec bins | Bins with >0 counts | Bins with >2000 counts | High rate bins dominated by noise | Noise dominated (total time) | Noise dominated (detector-on time) | Marked lightcurve |
|---|---|---|---|---|---|---|---|
| A | 19470 | 15294 | 3820 | 3820 | 19.62% | 24.98% | 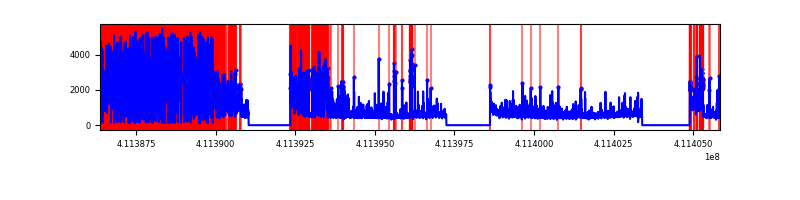 |
| B | 19470 | 15294 | 12 | 12 | 0.06% | 0.08% | 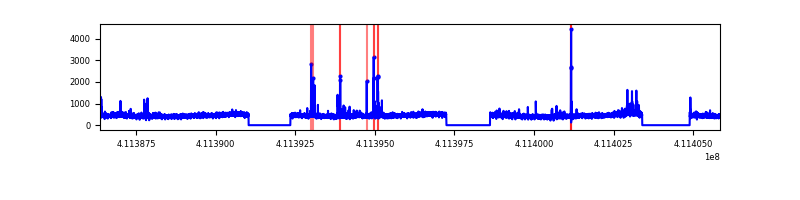 |
| C | 19470 | 15294 | 94 | 94 | 0.48% | 0.61% | 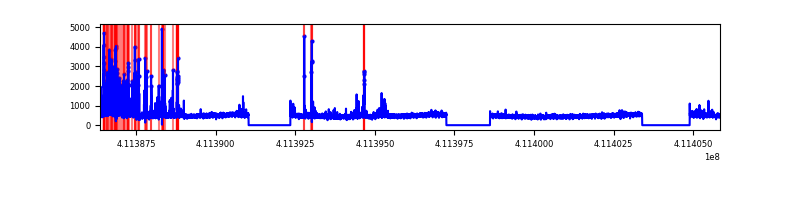 |
| D | 19470 | 15294 | 663 | 663 | 3.41% | 4.34% | 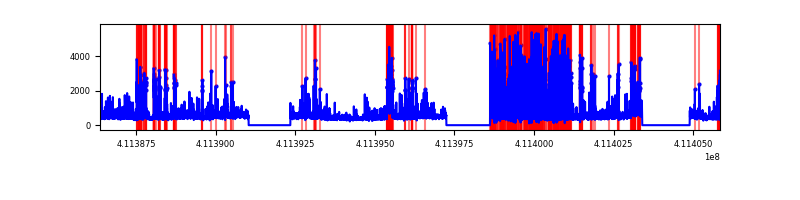 |
Top three noisy pixels from each quadrant. If the there are fewer than three noisy pixels in the level2.evt file, extra rows are filled as -1
| Pixel properties | Quadrant properties | ||||||
|---|---|---|---|---|---|---|---|
| Quadrant | DetID | PixID | Counts | Sigma | Mean | Median | Sigma |
| A | 15 | 222 | 12451457 | 43849.8 | 1407 | 1381 | 283.9 |
| A | 10 | 83 | 933011 | 3281.25 | 1407 | 1381 | 283.9 |
| A | 9 | 143 | 94596 | 328.31 | 1407 | 1381 | 283.9 |
| B | 8 | 3 | 203616 | 623.7 | 1671 | 1629 | 323.9 |
| B | 0 | 230 | 69344 | 209.09 | 1671 | 1629 | 323.9 |
| B | 12 | 111 | 41118 | 121.94 | 1671 | 1629 | 323.9 |
| C | 15 | 214 | 623341 | 1627.42 | 1638 | 1650 | 382.0 |
| C | 15 | 208 | 552113 | 1440.97 | 1638 | 1650 | 382.0 |
| C | 9 | 187 | 425254 | 1108.88 | 1638 | 1650 | 382.0 |
| D | 12 | 227 | 2644777 | 6671.68 | 1615 | 1571 | 396.2 |
| D | 2 | 249 | 574274 | 1445.55 | 1615 | 1571 | 396.2 |
| D | 1 | 52 | 203207 | 508.95 | 1615 | 1571 | 396.2 |
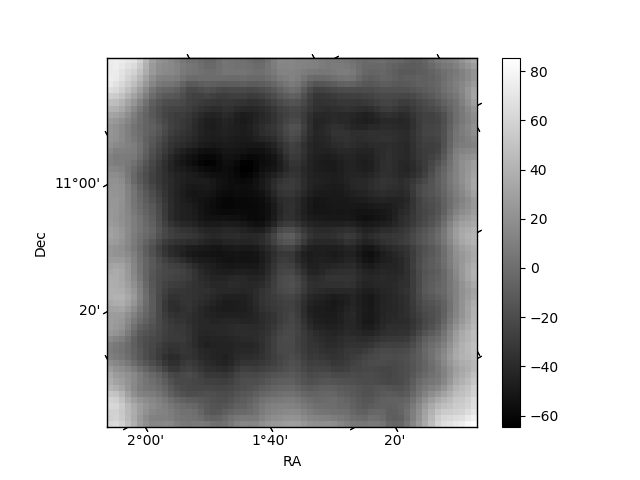
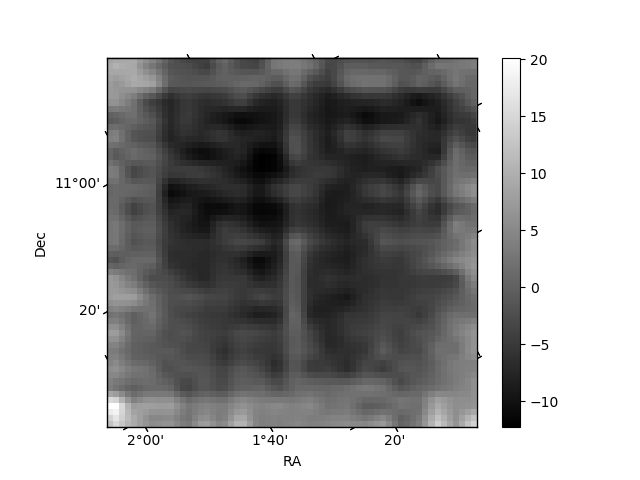
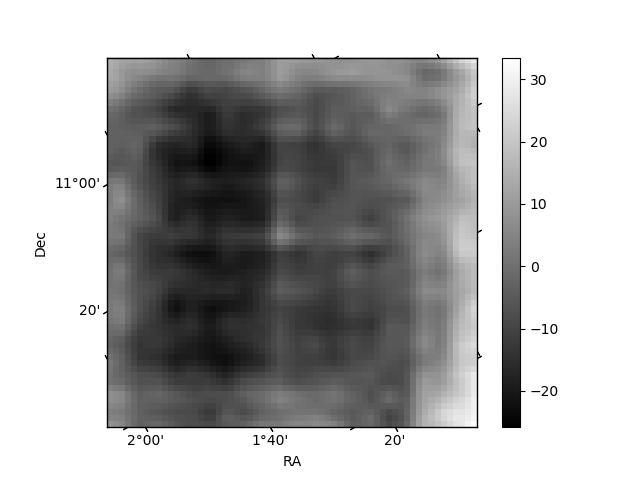
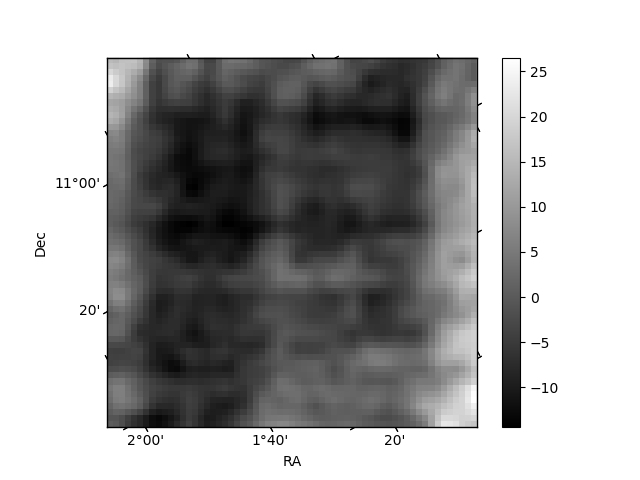
Histogram calculated using DETX and DETY for each event in the final _common_clean file
| Quadrant A | 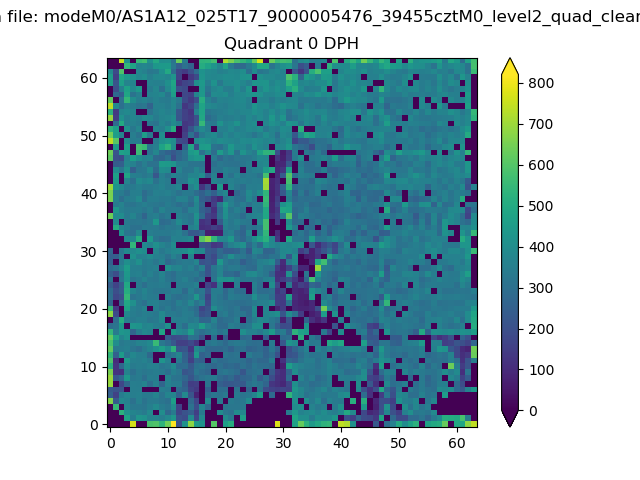 |
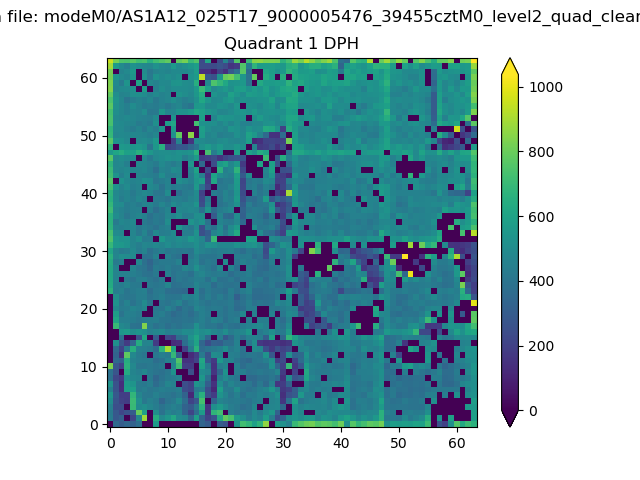 |
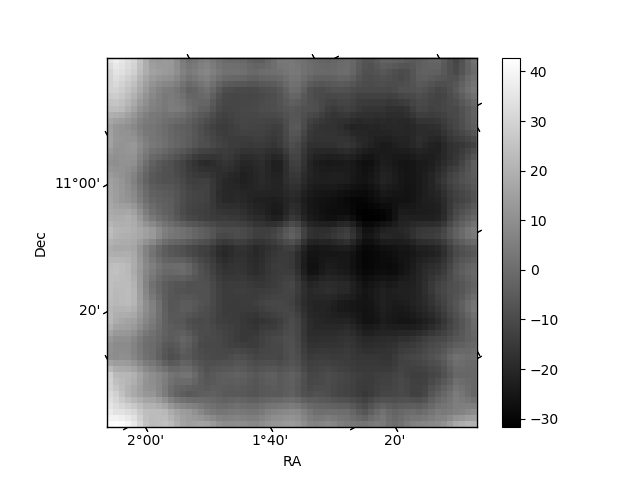
Quadrant B |
|---|---|---|---|
| Quadrant D | 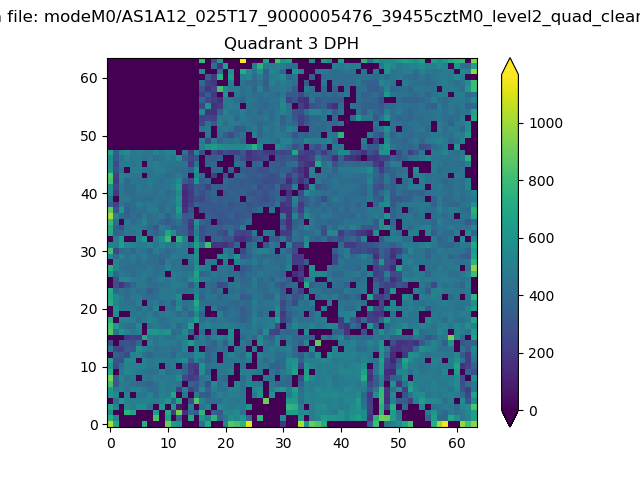 |
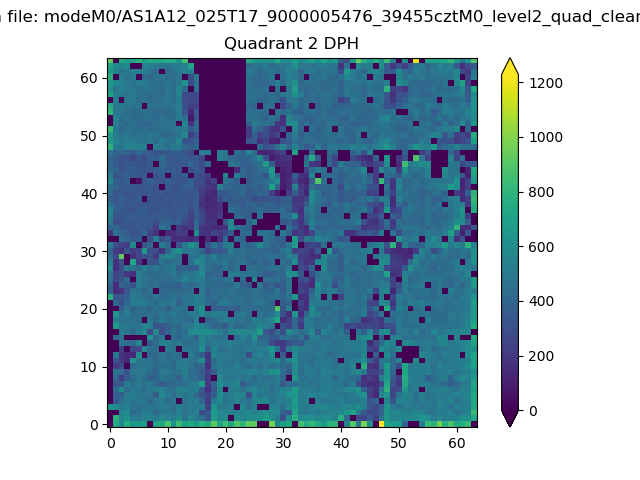 |
Quadrant C |
| Plot type | Count rate plots | Images |
|---|---|---|
| Comparison with Poisson distribution Blue bars denote a histogram of data divided into 1 sec bins. Red curve is a Poisson curve with rate = median count rate of data. |
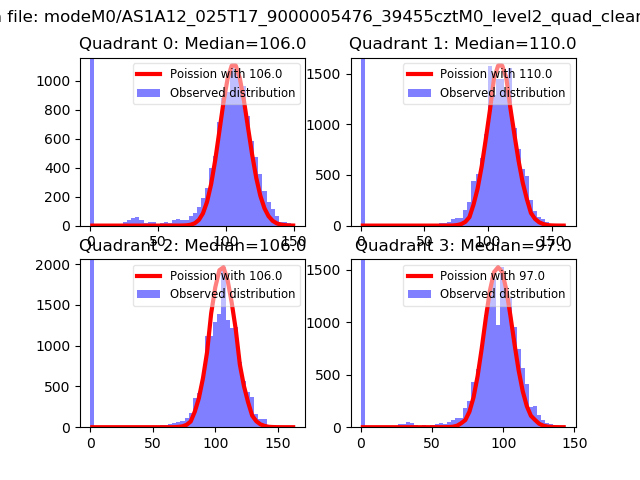 |
 |
| Quadrant-wise count rates Data is divided into 100 sec bins |
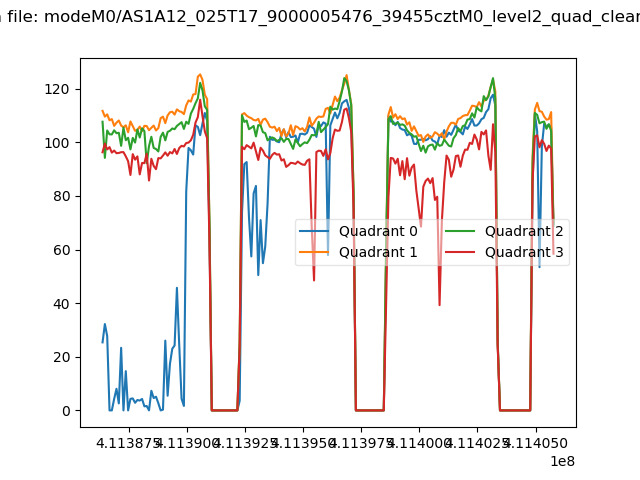 |
|
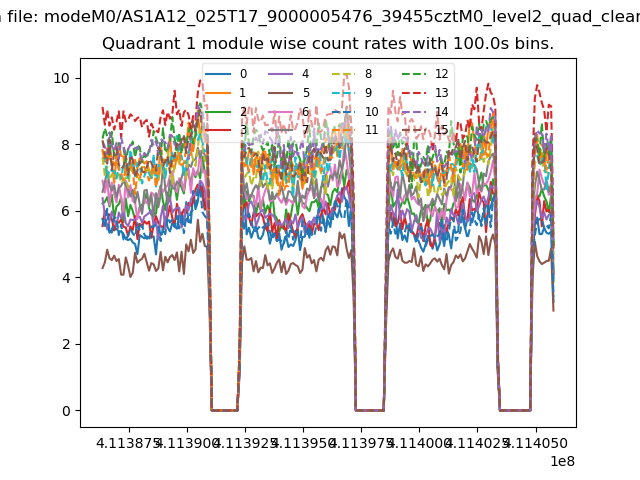
| Module-wise count rates for Quadrant A Data is divided into 100 sec bins |
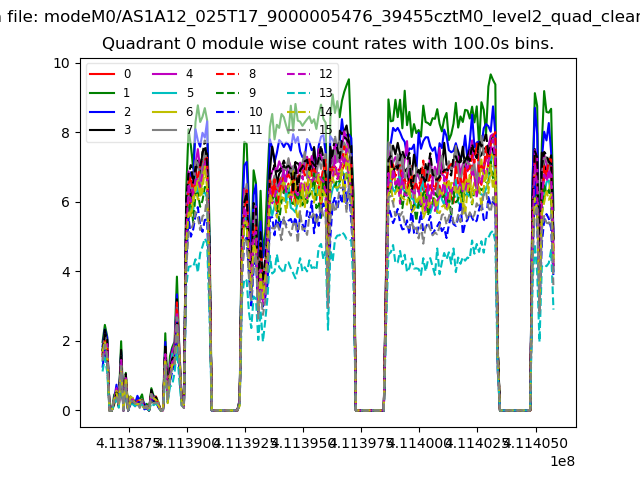 |
 |
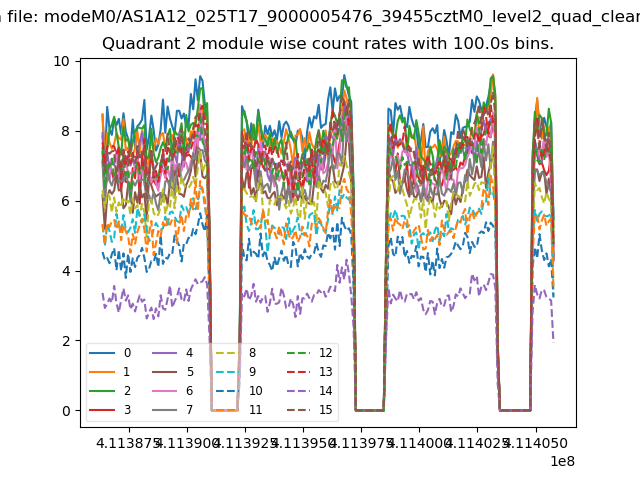
| Module-wise count rates for Quadrant B Data is divided into 100 sec bins |
 |
 |
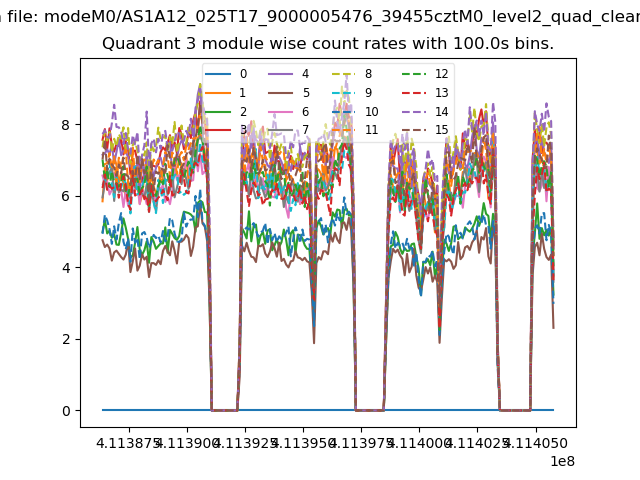
| Module-wise count rates for Quadrant C Data is divided into 100 sec bins |
 |
 |
| Module-wise count rates for Quadrant D Data is divided into 100 sec bins |
 |
 |
| Parameter | Plot |
|---|---|
| CZT HV Monitor | 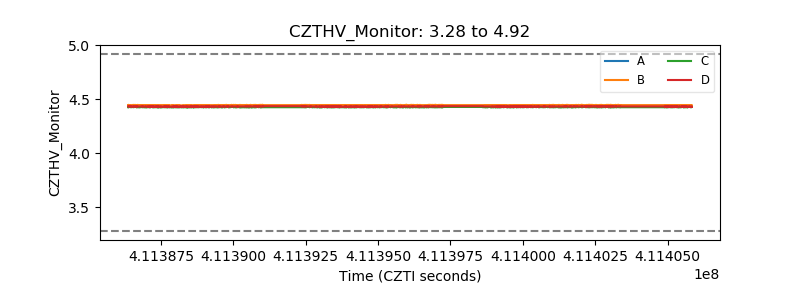 |
| D_VDD | 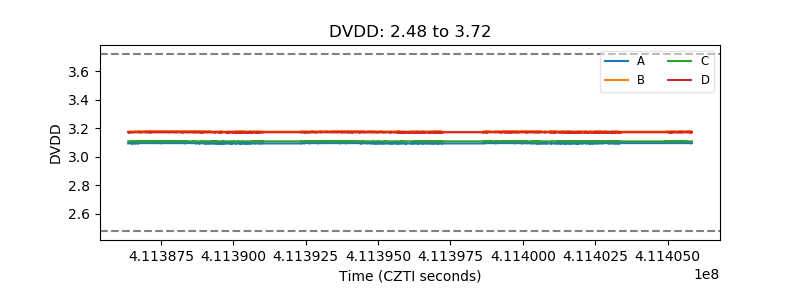 |
| Temperature 1 | 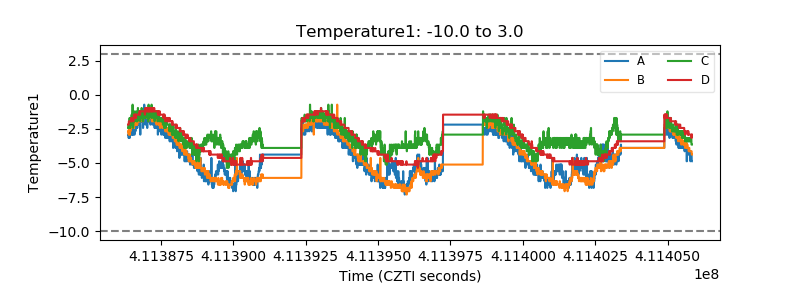 |
| Veto HV Monitor | 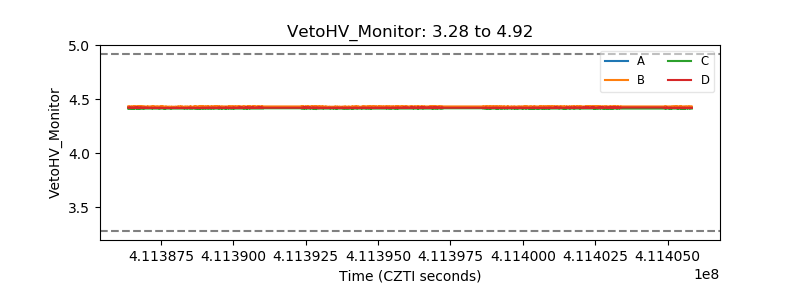 |
| Veto LLD | 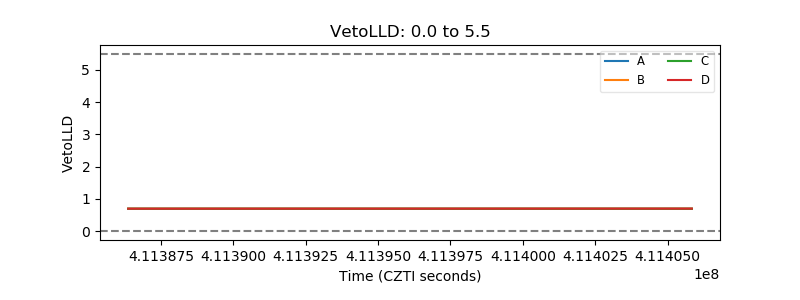 |
| Alpha Counter | 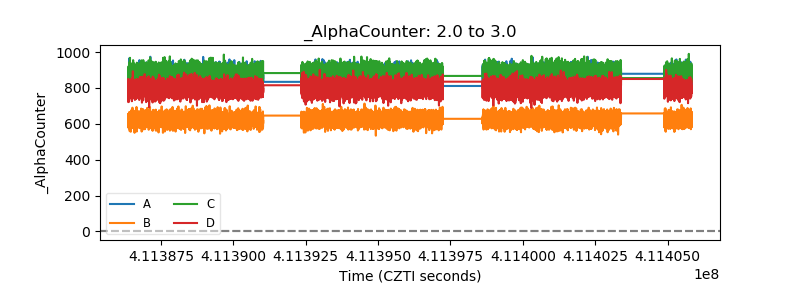 |
| _CPM_Rate | 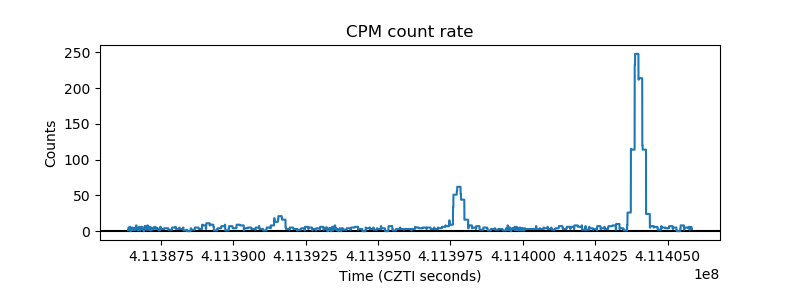 |
| CZT Counter | 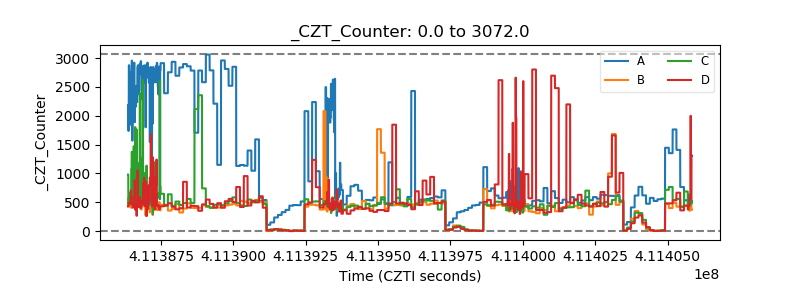 |
| +2.5 Volts monitor | 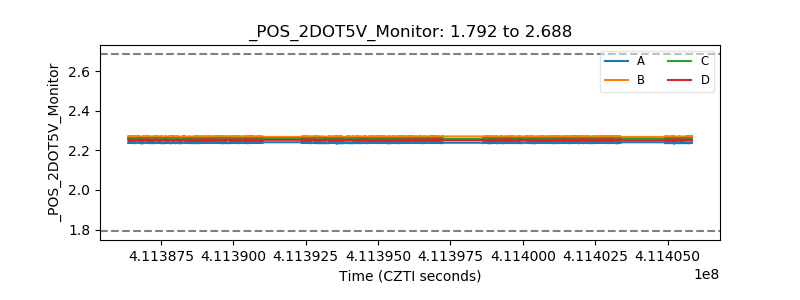 |
| +5 Volts monitor | 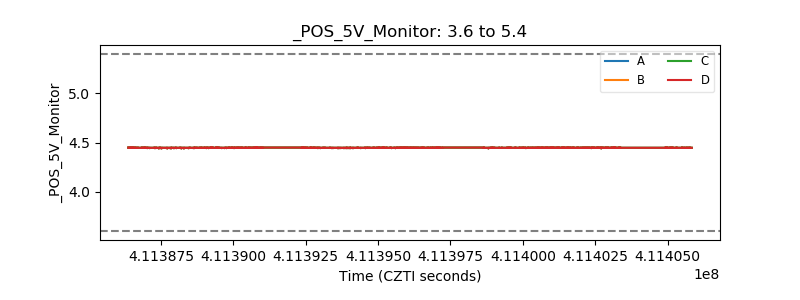 |
| _ROLL_ROT | 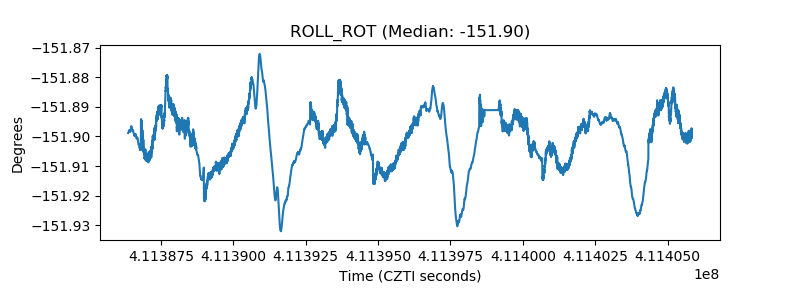 |
| _Roll_DEC | 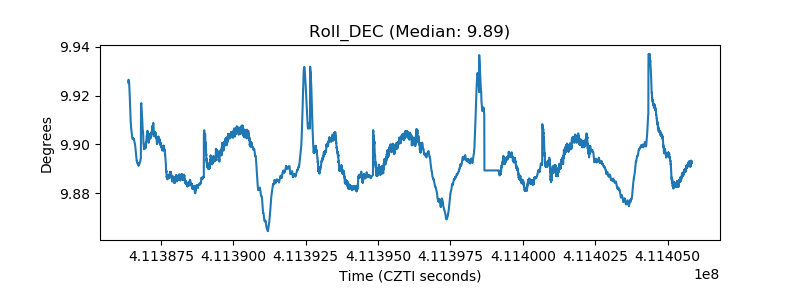 |
| _Roll_RA | 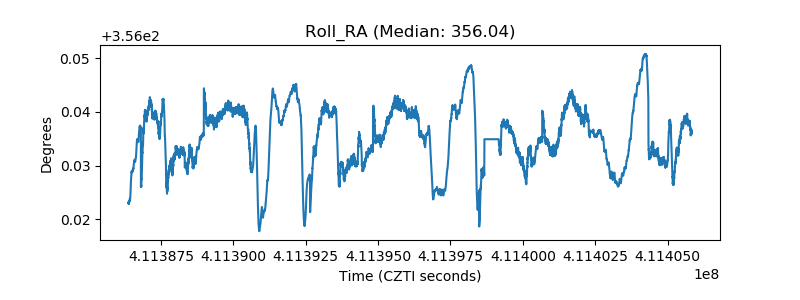 |
| Veto Counter | 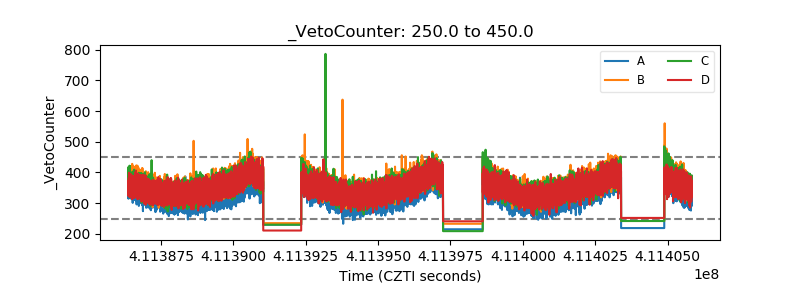 |