| Param | Original file | Final file |
|---|---|---|
| Filename | modeM0/AS1A12_025T17_9000005476_39458cztM0_level2.fits | modeM0/AS1A12_025T17_9000005476_39458cztM0_level2_quad_clean.evt |
| Size (bytes) | 348,557,760 | 91,946,880 |
| Size | 332.4 MB | 87.7 MB |
| Events in quadrant A | 3,958,461 | 602,445 |
| Events in quadrant B | 2,521,484 | 632,966 |
| Events in quadrant C | 2,728,590 | 602,793 |
| Events in quadrant D | 3,257,170 | 552,826 |
| Mode M0 | |||
|---|---|---|---|
| Quadrant | BADHDUFLAG | Total packets | Discarded packets |
| A | 0 | 15489 | 2 |
| B | 0 | 11449 | 2 |
| C | 0 | 11578 | 2 |
| D | 0 | 13675 | 2 |
| Mode SS | |||
|---|---|---|---|
| Quadrant | BADHDUFLAG | Total packets | Discarded packets |
| A | 0 | 116 | 0 |
| B | 0 | 116 | 0 |
| C | 0 | 116 | 0 |
| D | 0 | 116 | 0 |
| Mode M9 | |||
|---|---|---|---|
| Quadrant | BADHDUFLAG | Total packets | Discarded packets |
| A | 0 | 16 | 0 |
| B | 0 | 16 | 0 |
| C | 0 | 16 | 0 |
| D | 0 | 16 | 0 |
| Quadrant | Total seconds | Saturated seconds | Saturation percentage |
|---|---|---|---|
| A | 5609 | 152 | 2.709930% |
| B | 5609 | 12 | 0.213942% |
| C | 5609 | 2 | 0.035657% |
| D | 5609 | 144 | 2.567303% |
Noise dominated data is calculated using 1-second bins in cleaned event files. If a bin has >2000 counts, and if more than 50% of those come from <1% of pixels, then it is considered to be noise-dominated and hence unusable.
| Quadrant | # 1 sec bins | Bins with >0 counts | Bins with >2000 counts | High rate bins dominated by noise | Noise dominated (total time) | Noise dominated (detector-on time) | Marked lightcurve |
|---|---|---|---|---|---|---|---|
| A | 7222 | 5610 | 126 | 126 | 1.74% | 2.25% | 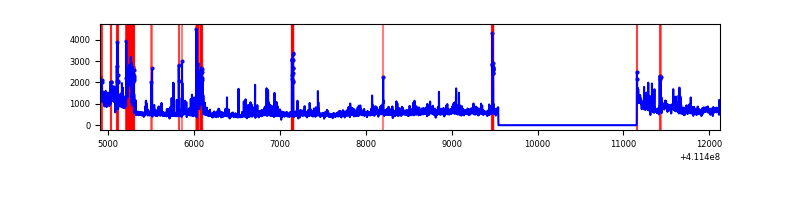 |
| B | 7222 | 5610 | 0 | 0 | 0.00% | 0.00% | 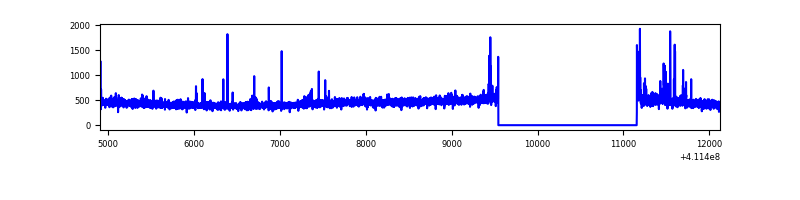 |
| C | 7222 | 5610 | 3 | 3 | 0.04% | 0.05% | 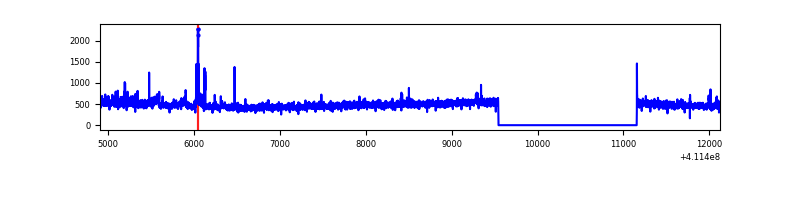 |
| D | 7222 | 5610 | 132 | 132 | 1.83% | 2.35% | 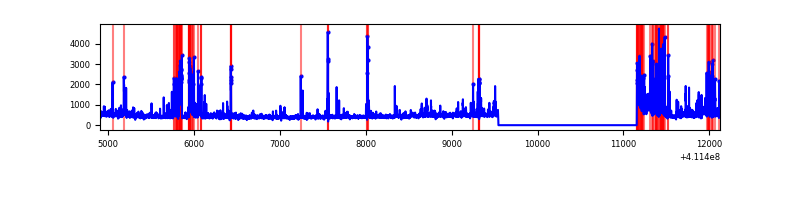 |
Top three noisy pixels from each quadrant. If the there are fewer than three noisy pixels in the level2.evt file, extra rows are filled as -1
| Pixel properties | Quadrant properties | ||||||
|---|---|---|---|---|---|---|---|
| Quadrant | DetID | PixID | Counts | Sigma | Mean | Median | Sigma |
| A | 15 | 222 | 989670 | 8033.93 | 607 | 595 | 123.1 |
| A | 10 | 83 | 445881 | 3616.91 | 607 | 595 | 123.1 |
| A | 15 | 174 | 60819 | 489.18 | 607 | 595 | 123.1 |
| B | 5 | 172 | 56780 | 468.58 | 613 | 596 | 119.9 |
| B | 8 | 3 | 28594 | 233.51 | 613 | 596 | 119.9 |
| B | 12 | 111 | 15154 | 121.42 | 613 | 596 | 119.9 |
| C | 15 | 214 | 234115 | 1644.71 | 605 | 609 | 142.0 |
| C | 9 | 187 | 123841 | 867.99 | 605 | 609 | 142.0 |
| C | 15 | 208 | 4466 | 27.17 | 605 | 609 | 142.0 |
| D | 12 | 227 | 399682 | 2730.39 | 597 | 580 | 146.2 |
| D | 2 | 249 | 383306 | 2618.35 | 597 | 580 | 146.2 |
| D | 13 | 249 | 71369 | 484.29 | 597 | 580 | 146.2 |
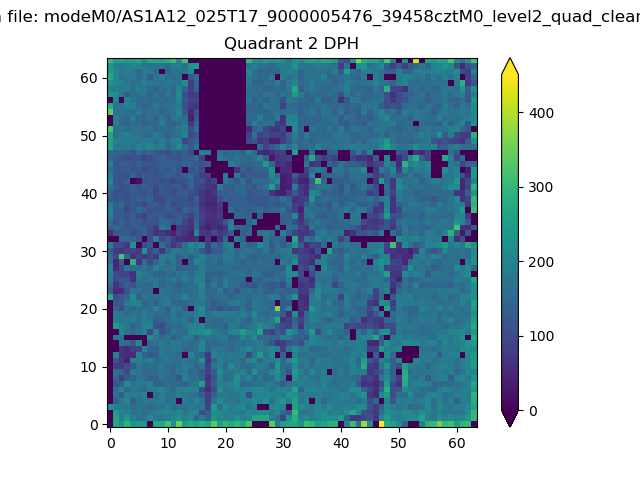
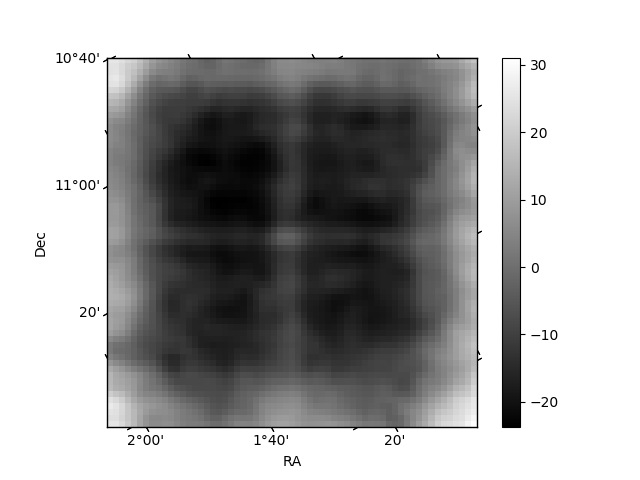
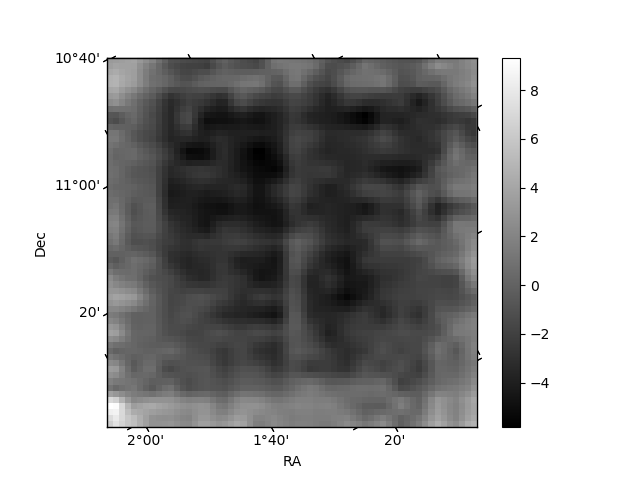
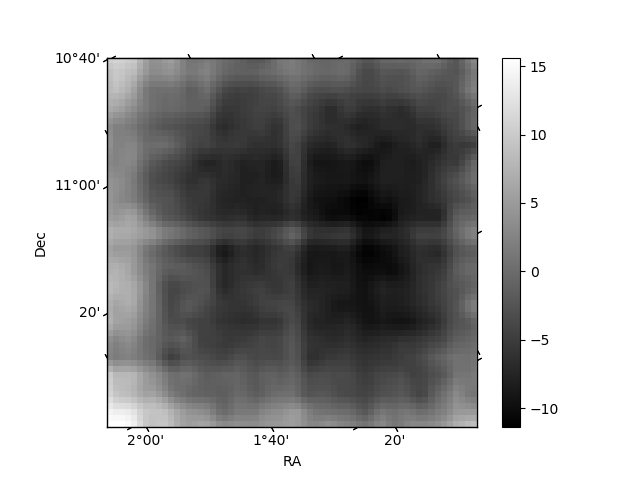
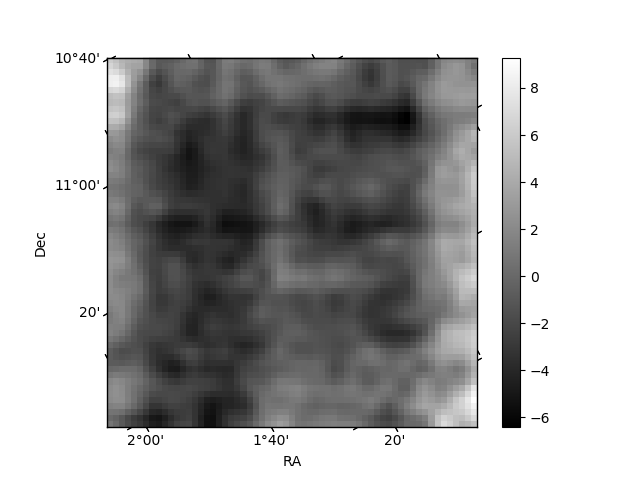
Histogram calculated using DETX and DETY for each event in the final _common_clean file
| Quadrant A | 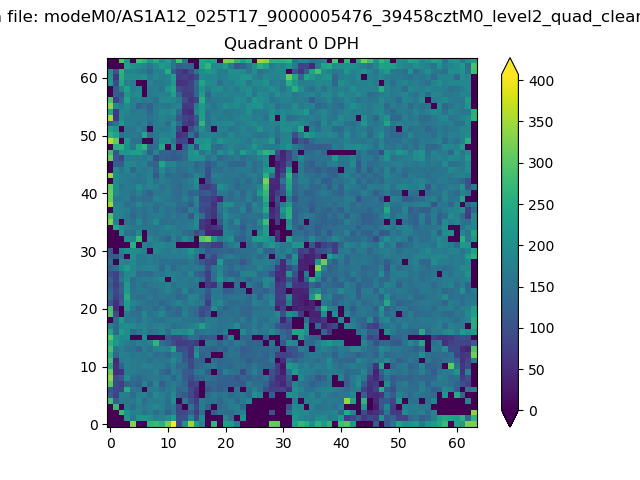 |
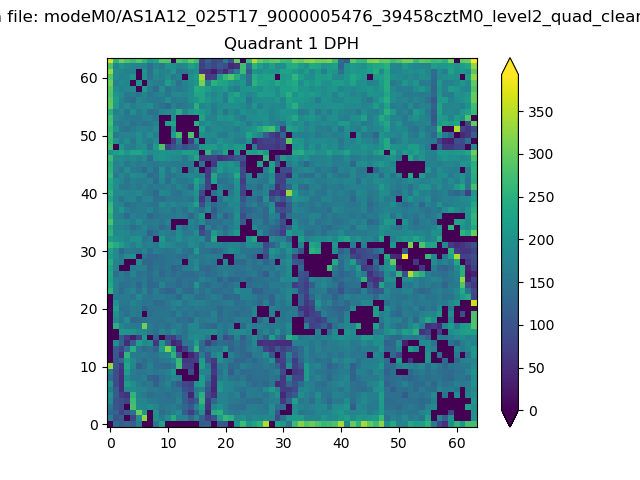 |
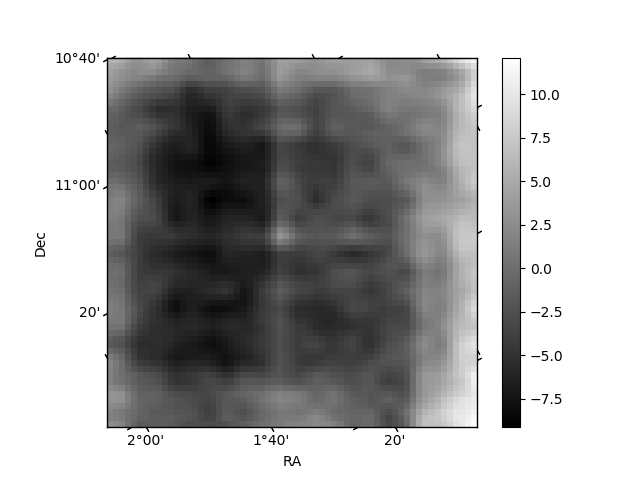
Quadrant B |
|---|---|---|---|
| Quadrant D | 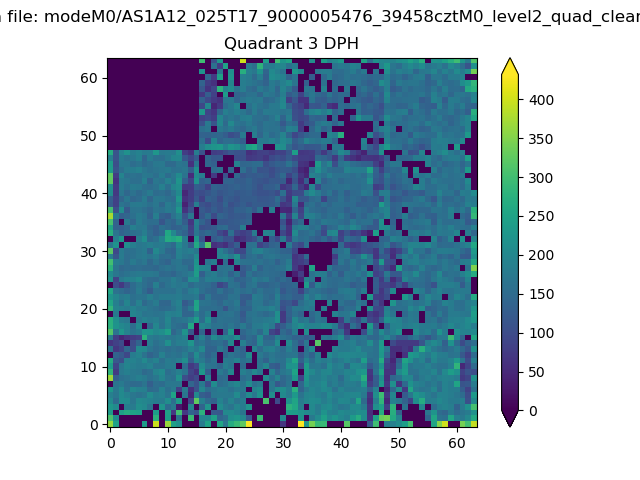 |
 |
Quadrant C |
| Plot type | Count rate plots | Images |
|---|---|---|
| Comparison with Poisson distribution Blue bars denote a histogram of data divided into 1 sec bins. Red curve is a Poisson curve with rate = median count rate of data. |
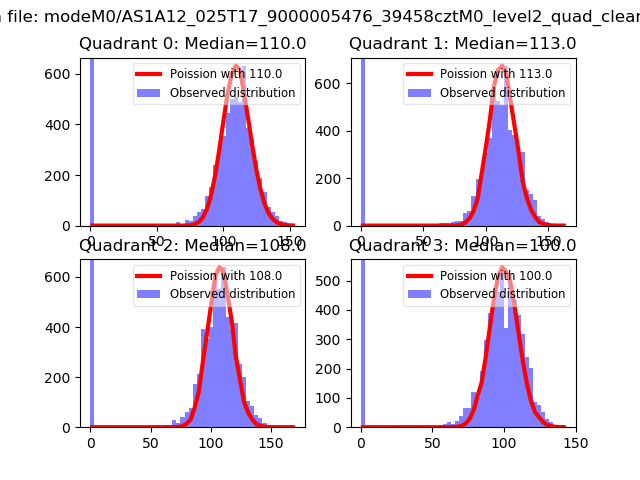 |
 |
| Quadrant-wise count rates Data is divided into 100 sec bins |
 |
|
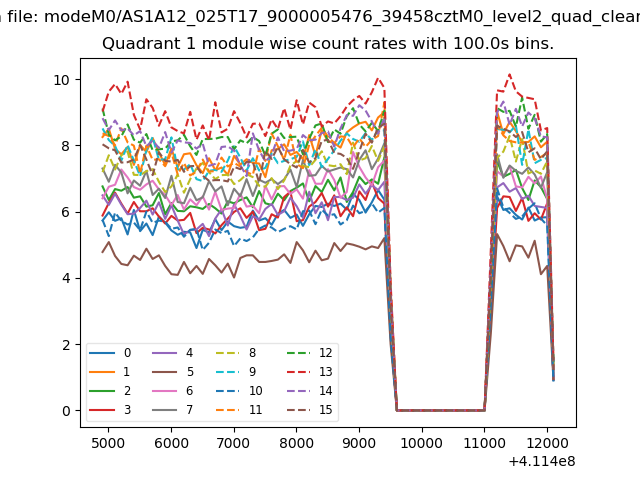
| Module-wise count rates for Quadrant A Data is divided into 100 sec bins |
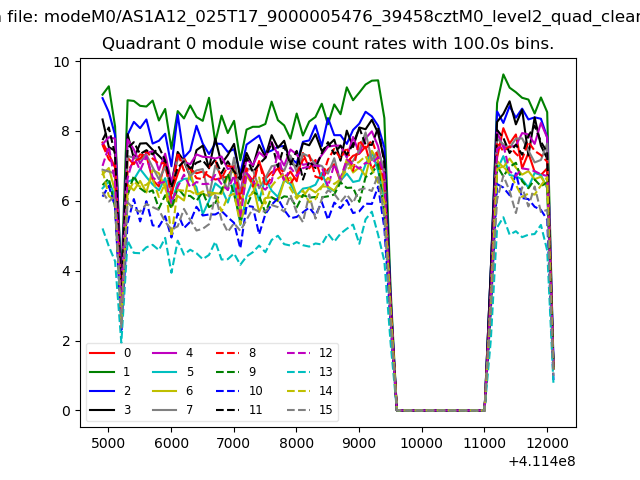 |
 |
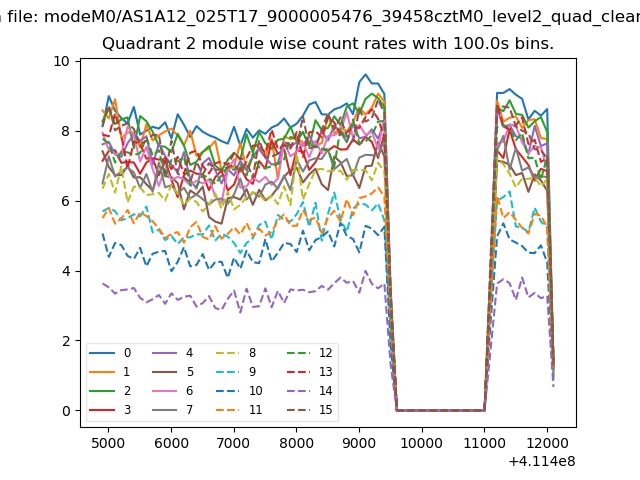
| Module-wise count rates for Quadrant B Data is divided into 100 sec bins |
 |
 |
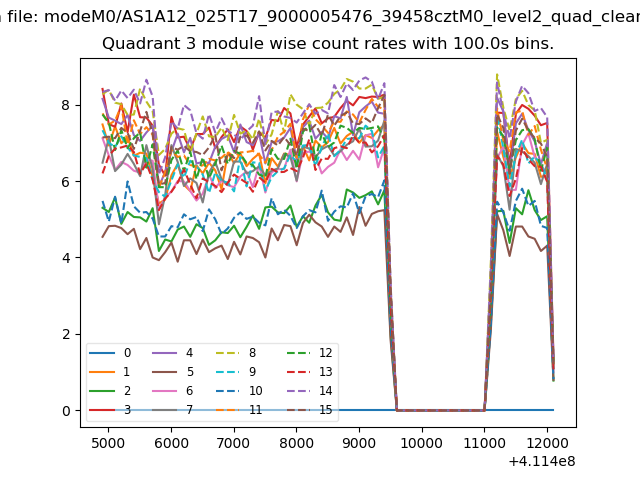
| Module-wise count rates for Quadrant C Data is divided into 100 sec bins |
 |
 |
| Module-wise count rates for Quadrant D Data is divided into 100 sec bins |
 |
 |
| Parameter | Plot |
|---|---|
| CZT HV Monitor | 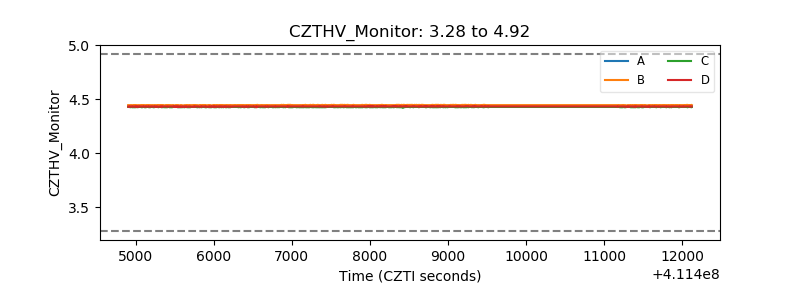 |
| D_VDD | 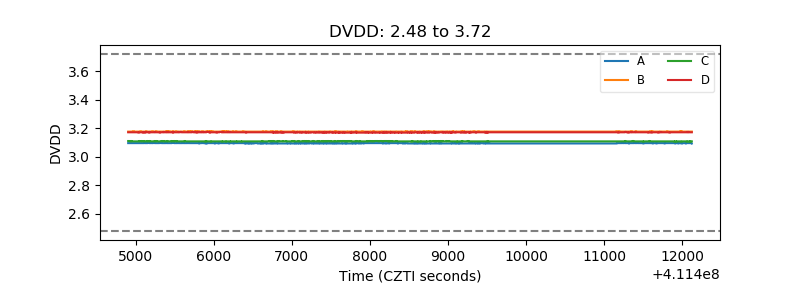 |
| Temperature 1 | 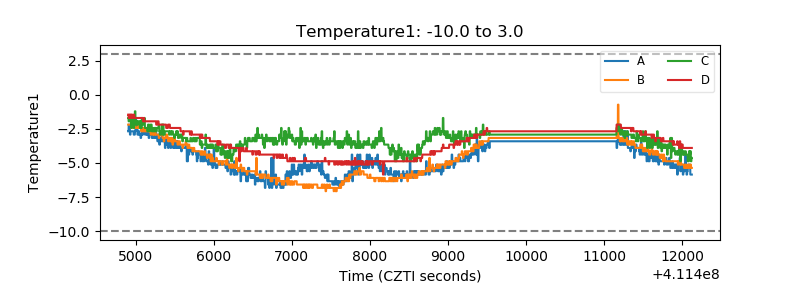 |
| Veto HV Monitor |  |
| Veto LLD | 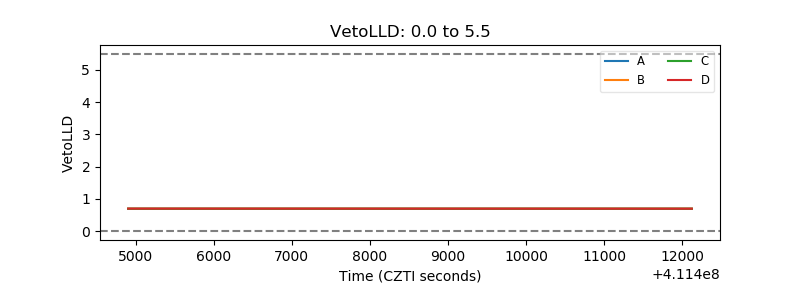 |
| Alpha Counter | 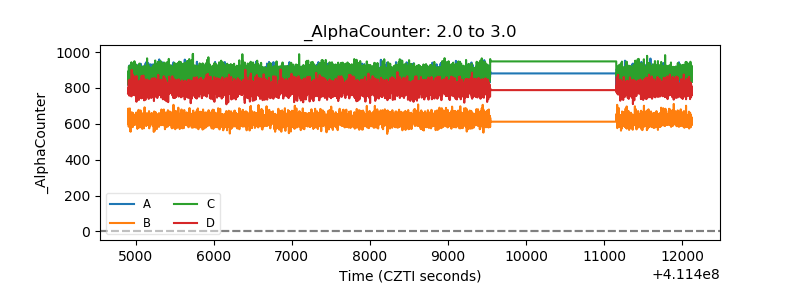 |
| _CPM_Rate | 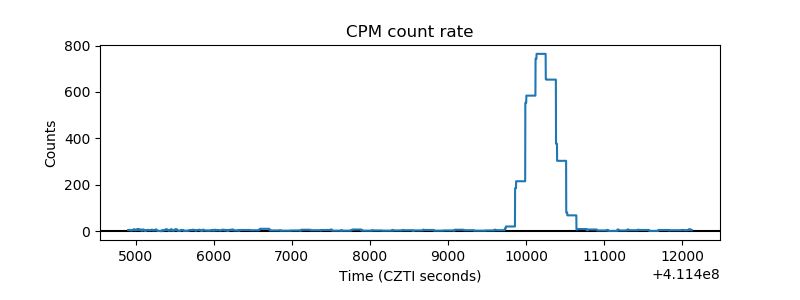 |
| CZT Counter | 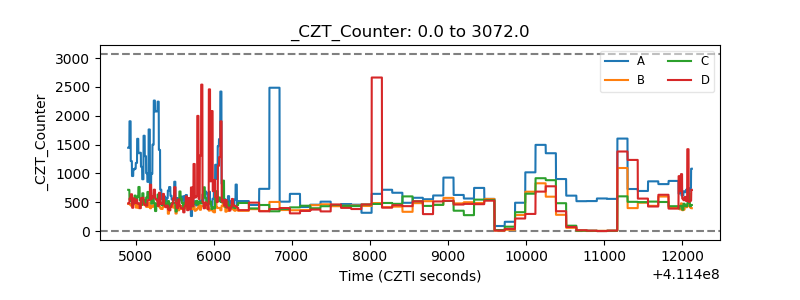 |
| +2.5 Volts monitor | 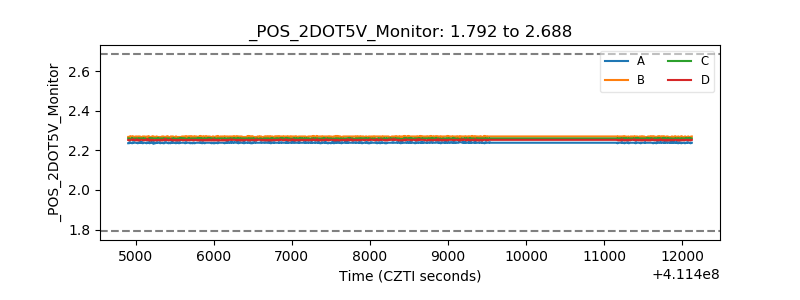 |
| +5 Volts monitor | 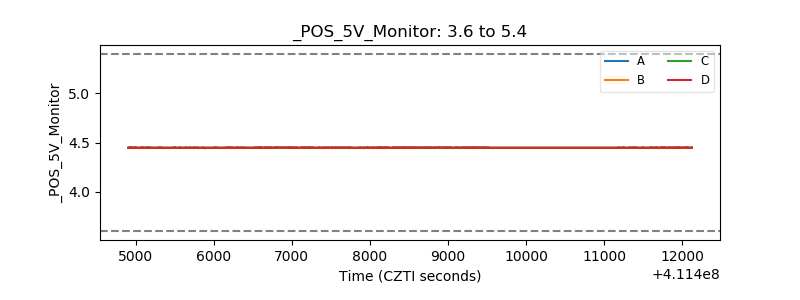 |
| _ROLL_ROT | 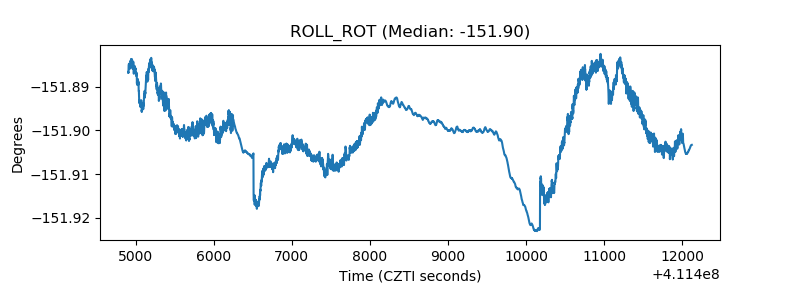 |
| _Roll_DEC | 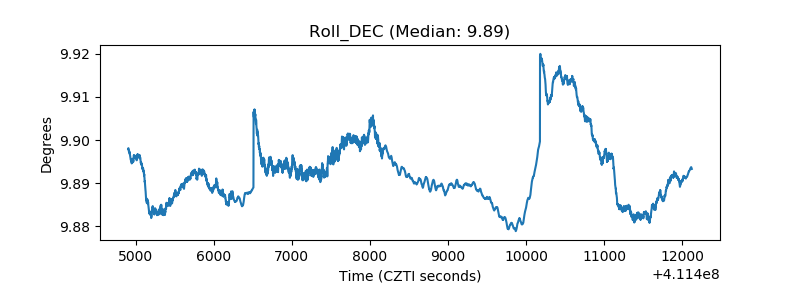 |
| _Roll_RA | 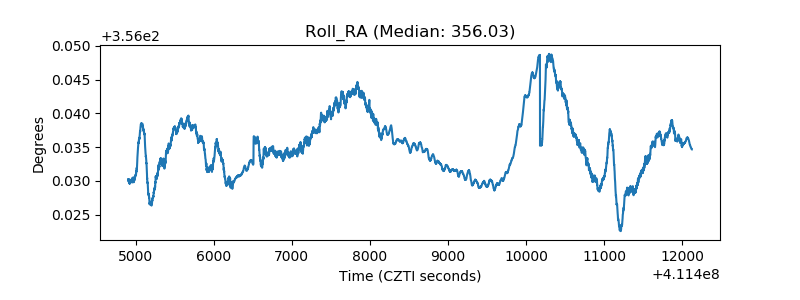 |
| Veto Counter | 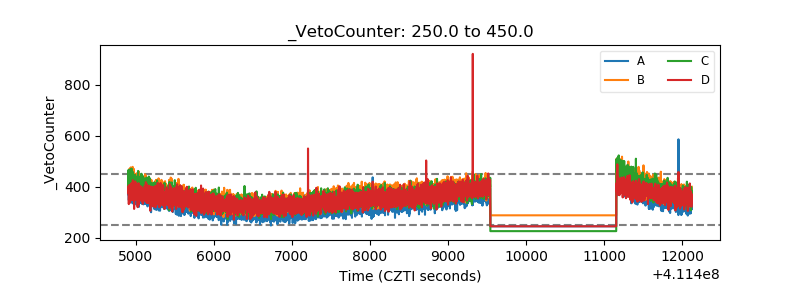 |