| Param | Original file | Final file |
|---|---|---|
| Filename | modeM0/AS1A12_044T16_9000005478_39458cztM0_level2.fits | modeM0/AS1A12_044T16_9000005478_39458cztM0_level2_quad_clean.evt |
| Size (bytes) | 288,671,040 | 58,878,720 |
| Size | 275.3 MB | 56.2 MB |
| Events in quadrant A | 3,813,094 | 379,425 |
| Events in quadrant B | 2,085,140 | 406,092 |
| Events in quadrant C | 2,349,995 | 380,185 |
| Events in quadrant D | 2,157,348 | 363,639 |
| Mode SS | |||
|---|---|---|---|
| Quadrant | BADHDUFLAG | Total packets | Discarded packets |
| A | 0 | 72 | 0 |
| B | 0 | 72 | 0 |
| C | 0 | 72 | 0 |
| D | 0 | 72 | 0 |
| Mode M0 | |||
|---|---|---|---|
| Quadrant | BADHDUFLAG | Total packets | Discarded packets |
| A | 0 | 13908 | 2 |
| B | 0 | 8635 | 1 |
| C | 0 | 9147 | 1 |
| D | 0 | 8816 | 1 |
| Mode M9 | |||
|---|---|---|---|
| Quadrant | BADHDUFLAG | Total packets | Discarded packets |
| A | 0 | 18 | 0 |
| B | 0 | 18 | 0 |
| C | 0 | 18 | 0 |
| D | 0 | 18 | 0 |
| Quadrant | Total seconds | Saturated seconds | Saturation percentage |
|---|---|---|---|
| A | 3586 | 386 | 10.764083% |
| B | 3586 | 159 | 4.433910% |
| C | 3586 | 192 | 5.354155% |
| D | 3586 | 74 | 2.063581% |
Noise dominated data is calculated using 1-second bins in cleaned event files. If a bin has >2000 counts, and if more than 50% of those come from <1% of pixels, then it is considered to be noise-dominated and hence unusable.
| Quadrant | # 1 sec bins | Bins with >0 counts | Bins with >2000 counts | High rate bins dominated by noise | Noise dominated (total time) | Noise dominated (detector-on time) | Marked lightcurve |
|---|---|---|---|---|---|---|---|
| A | 5348 | 3587 | 410 | 410 | 7.67% | 11.43% | 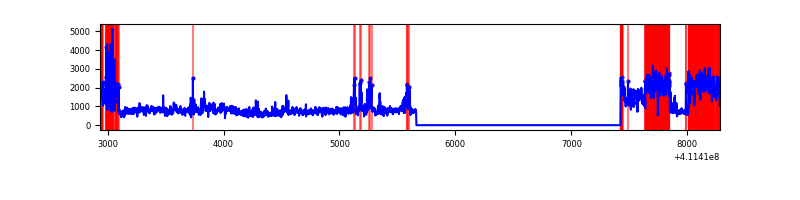 |
| B | 5348 | 3587 | 101 | 101 | 1.89% | 2.82% | 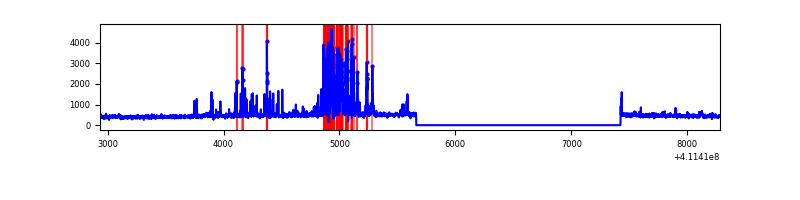 |
| C | 5348 | 3587 | 182 | 182 | 3.40% | 5.07% | 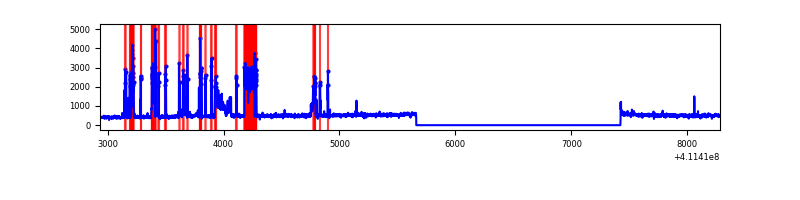 |
| D | 5348 | 3587 | 69 | 69 | 1.29% | 1.92% | 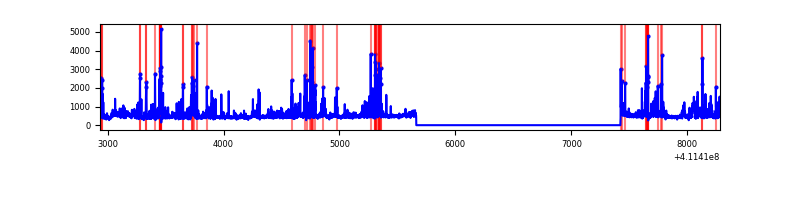 |
Top three noisy pixels from each quadrant. If the there are fewer than three noisy pixels in the level2.evt file, extra rows are filled as -1
| Pixel properties | Quadrant properties | ||||||
|---|---|---|---|---|---|---|---|
| Quadrant | DetID | PixID | Counts | Sigma | Mean | Median | Sigma |
| A | 15 | 222 | 1980543 | 24688.82 | 392 | 384 | 80.2 |
| A | 10 | 83 | 254337 | 3166.31 | 392 | 384 | 80.2 |
| A | 6 | 10 | 40182 | 496.21 | 392 | 384 | 80.2 |
| B | 5 | 172 | 507206 | 6595.17 | 395 | 384 | 76.8 |
| B | 0 | 230 | 13366 | 168.93 | 395 | 384 | 76.8 |
| B | 12 | 111 | 9714 | 121.41 | 395 | 384 | 76.8 |
| C | 15 | 208 | 641647 | 6889.3 | 389 | 392 | 93.1 |
| C | 15 | 214 | 145514 | 1559.11 | 389 | 392 | 93.1 |
| C | 10 | 70 | 28874 | 306.0 | 389 | 392 | 93.1 |
| D | 12 | 227 | 464809 | 4774.7 | 389 | 377 | 97.3 |
| D | 13 | 249 | 54792 | 559.43 | 389 | 377 | 97.3 |
| D | 1 | 52 | 45019 | 458.95 | 389 | 377 | 97.3 |
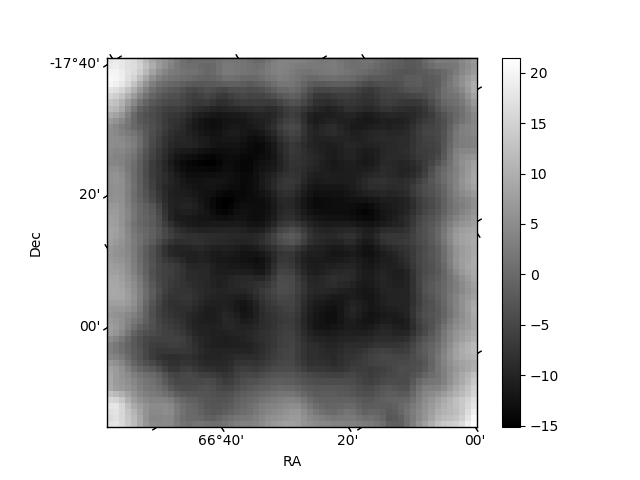
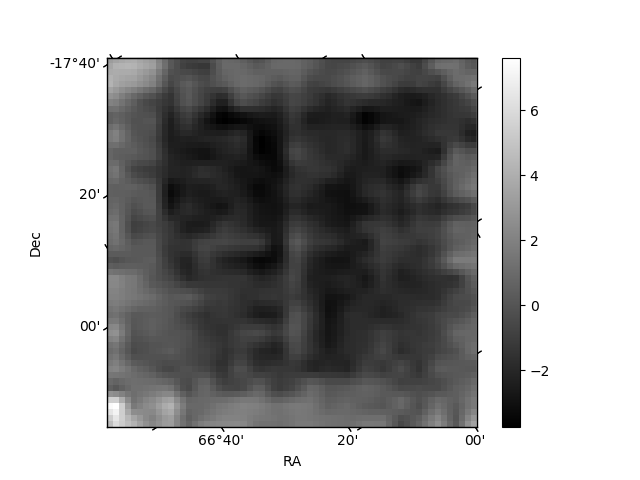
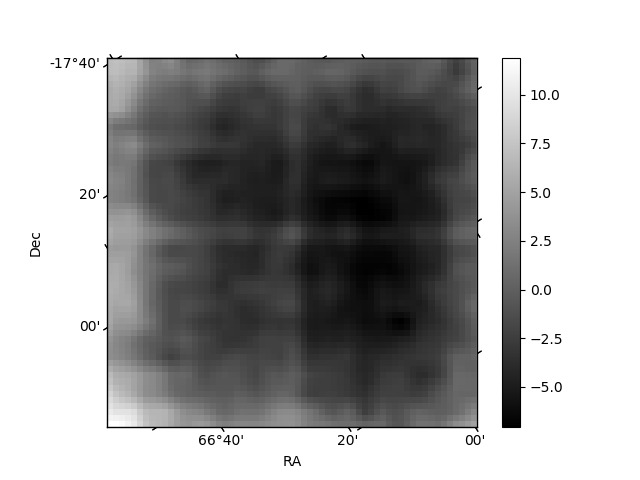
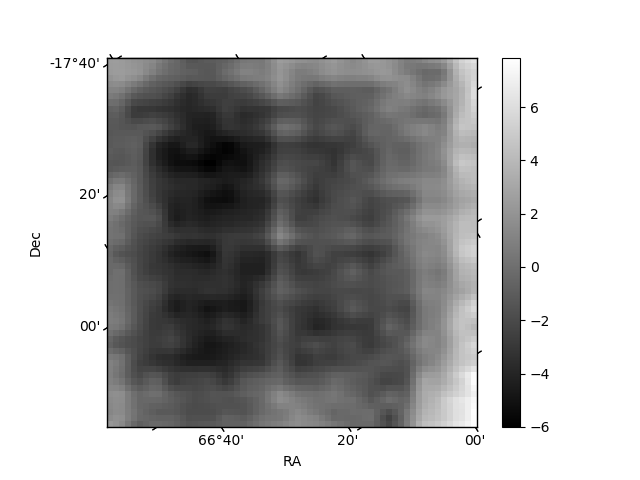
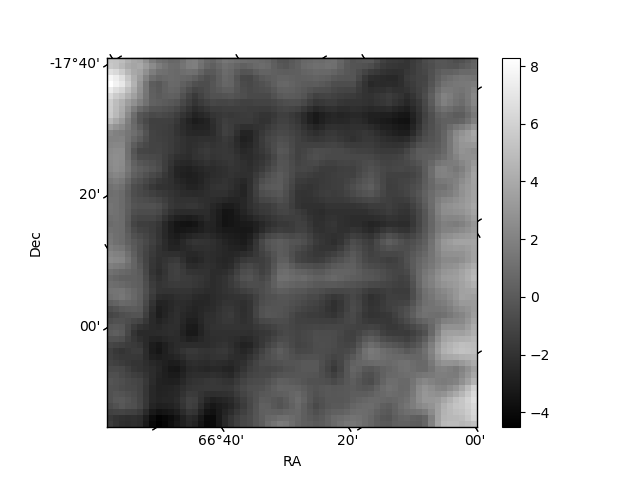
Histogram calculated using DETX and DETY for each event in the final _common_clean file
| Quadrant A | 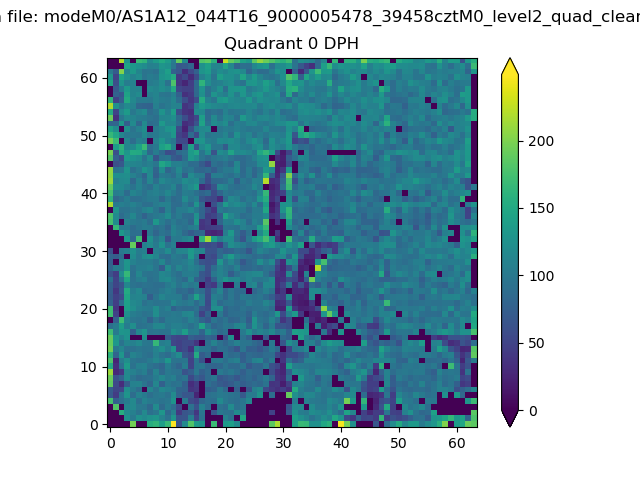 |
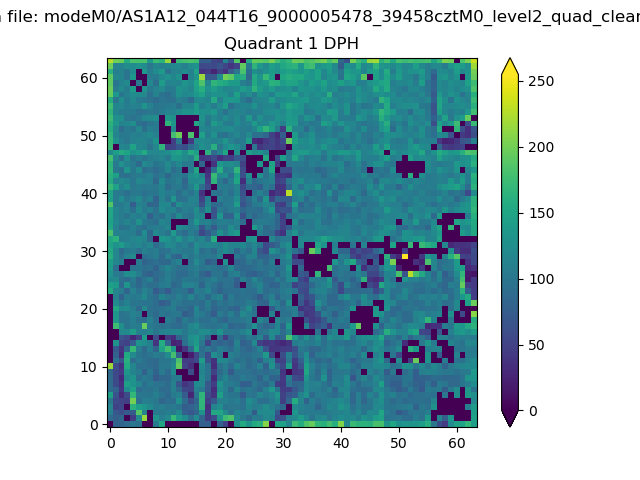 |
Quadrant B |
|---|---|---|---|
| Quadrant D |  |
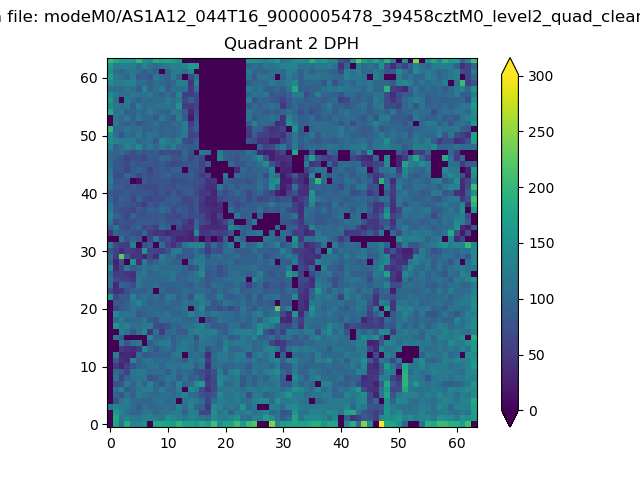 |
Quadrant C |
| Plot type | Count rate plots | Images |
|---|---|---|
| Comparison with Poisson distribution Blue bars denote a histogram of data divided into 1 sec bins. Red curve is a Poisson curve with rate = median count rate of data. |
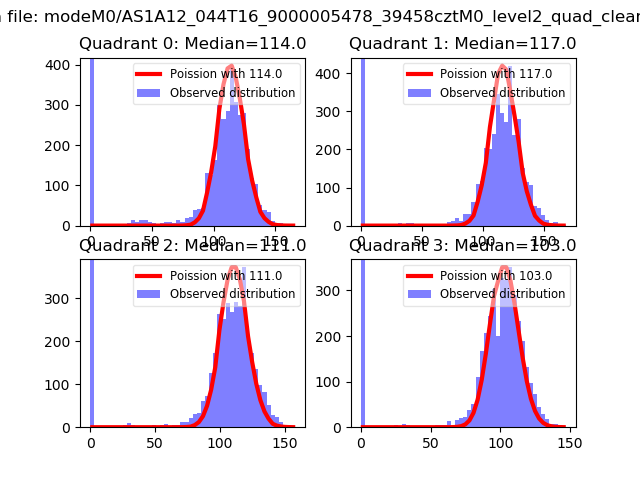 |
 |
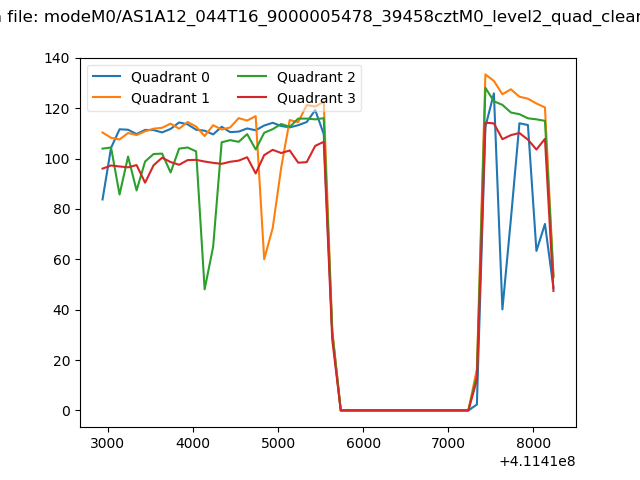
| Quadrant-wise count rates Data is divided into 100 sec bins |
 |
|
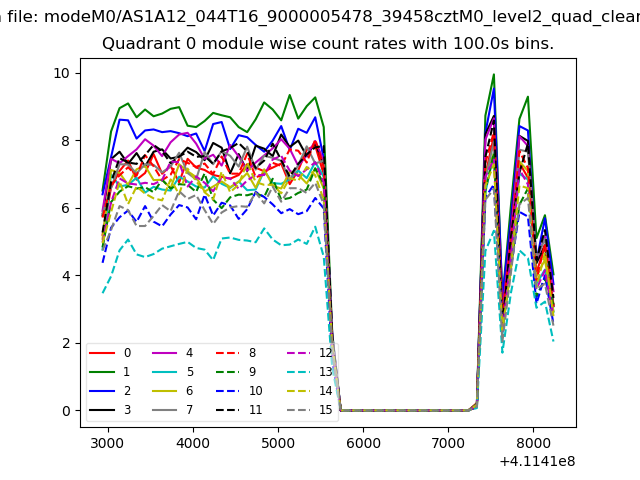
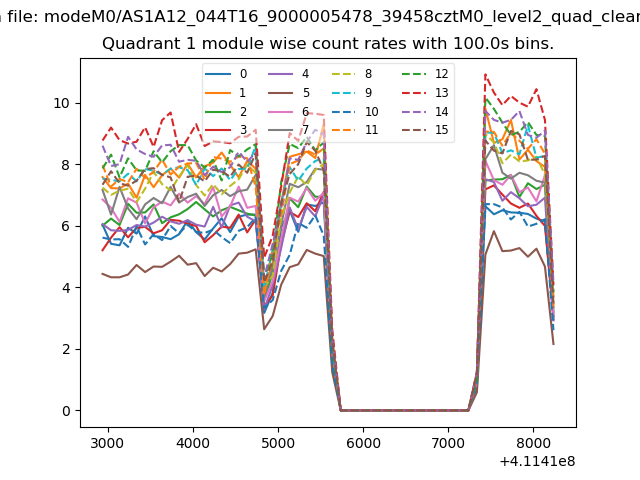
| Module-wise count rates for Quadrant A Data is divided into 100 sec bins |
 |
 |
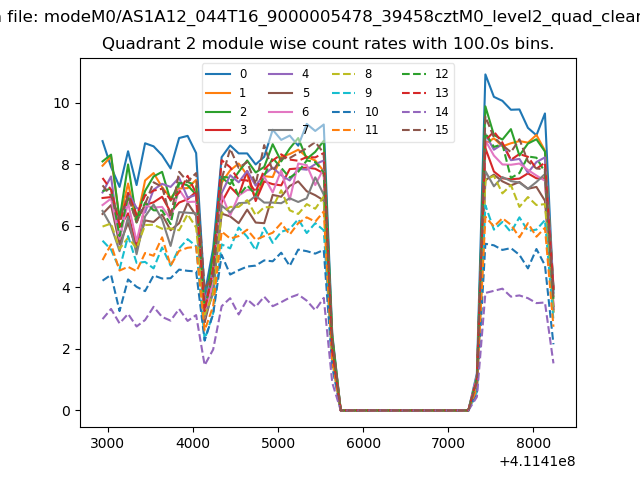
| Module-wise count rates for Quadrant B Data is divided into 100 sec bins |
 |
 |
| Module-wise count rates for Quadrant C Data is divided into 100 sec bins |
 |
 |
| Module-wise count rates for Quadrant D Data is divided into 100 sec bins |
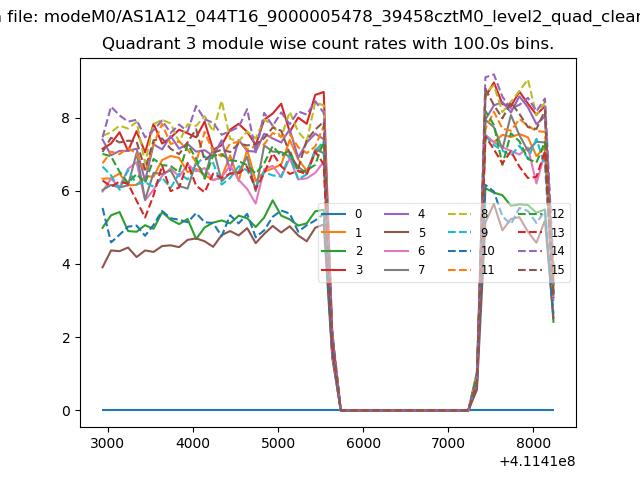 |
 |
| Parameter | Plot |
|---|---|
| CZT HV Monitor | 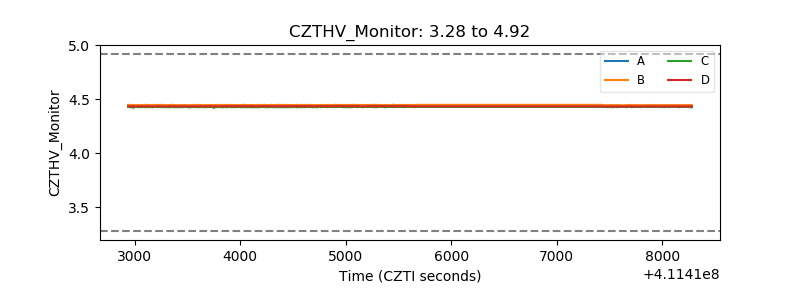 |
| D_VDD | 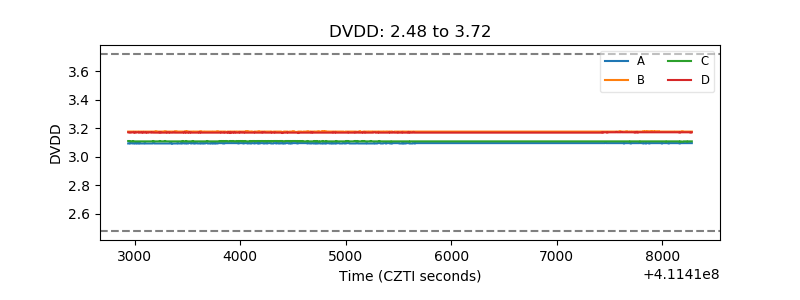 |
| Temperature 1 | 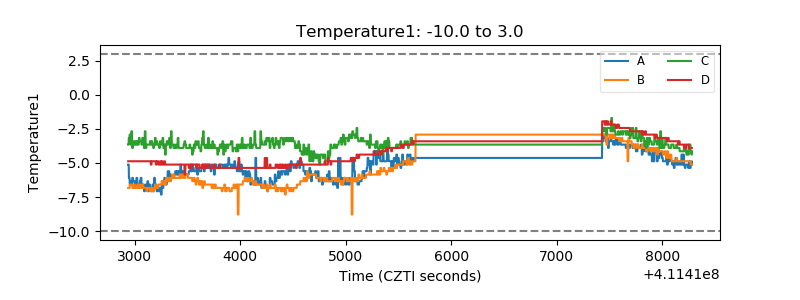 |
| Veto HV Monitor | 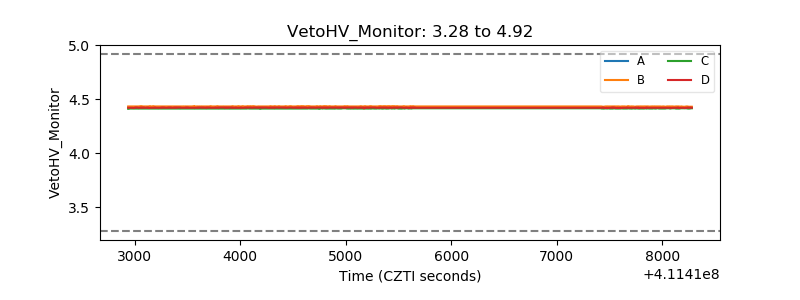 |
| Veto LLD | 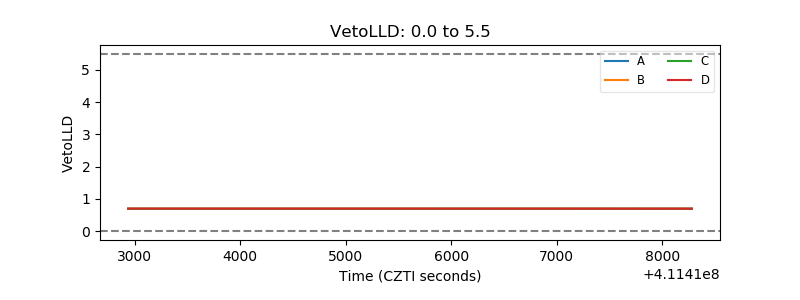 |
| Alpha Counter | 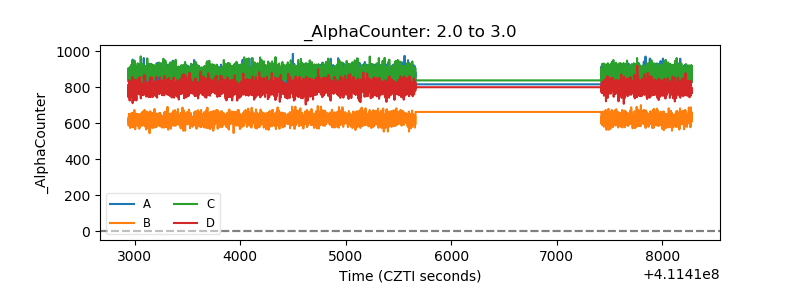 |
| _CPM_Rate | 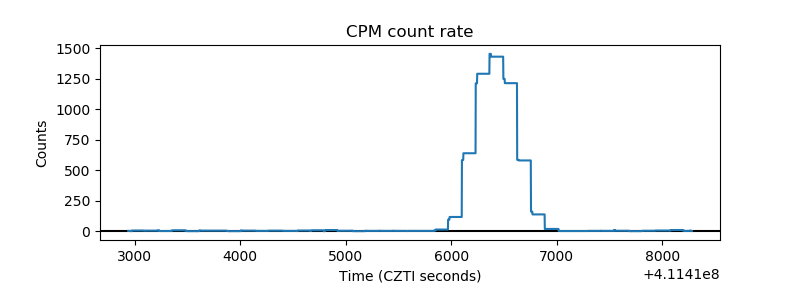 |
| CZT Counter | 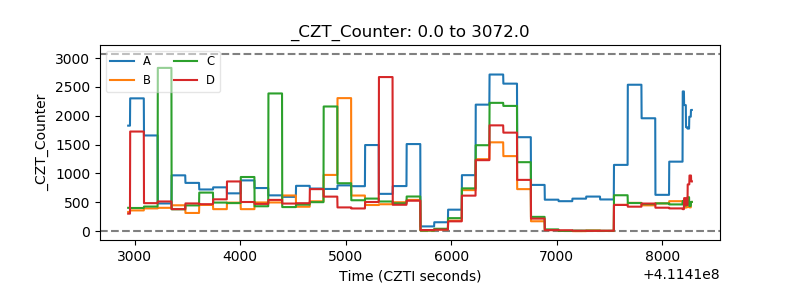 |
| +2.5 Volts monitor | 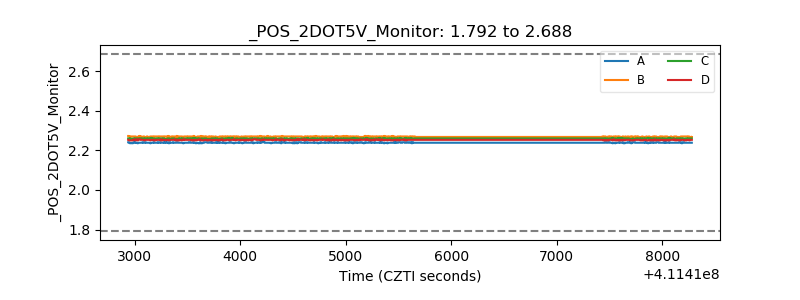 |
| +5 Volts monitor | 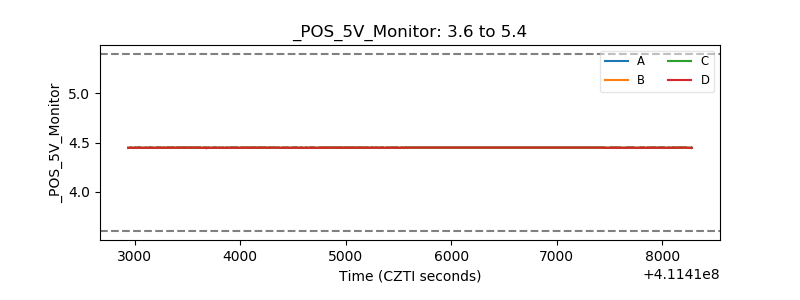 |
| _ROLL_ROT | 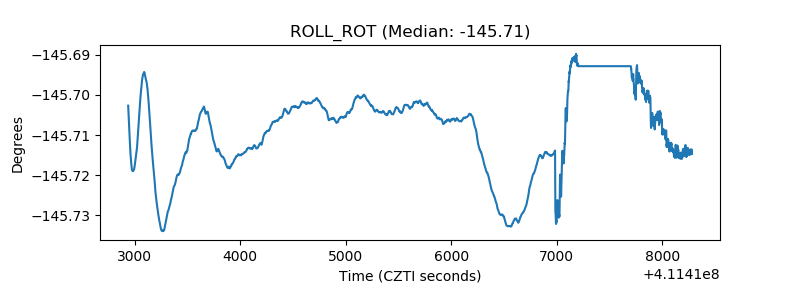 |
| _Roll_DEC | 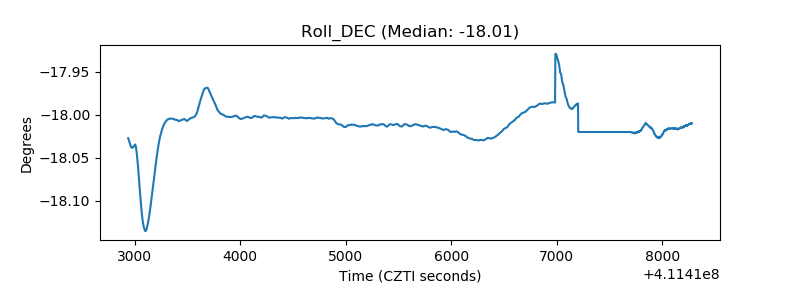 |
| _Roll_RA | 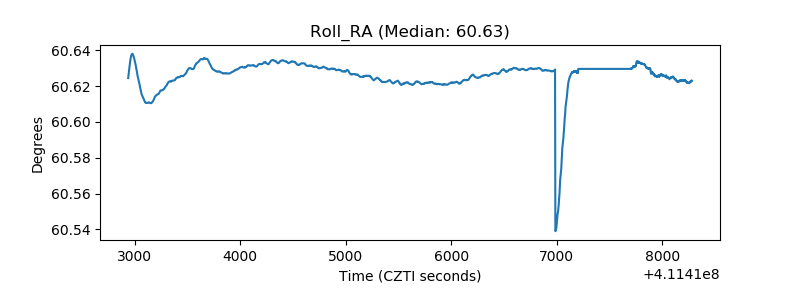 |
| Veto Counter | 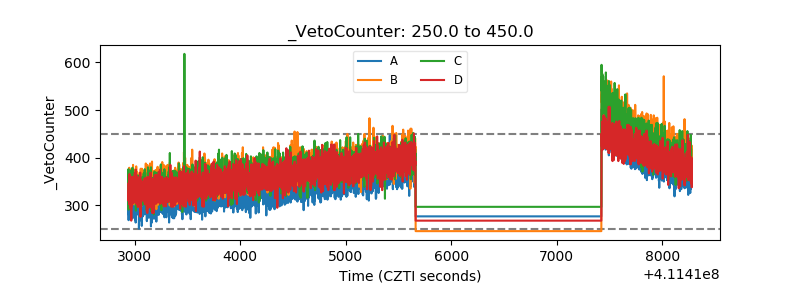 |