| Param | Original file | Final file |
|---|---|---|
| Filename | modeM0/AS1A12_044T16_9000005478_39460cztM0_level2.fits | modeM0/AS1A12_044T16_9000005478_39460cztM0_level2_quad_clean.evt |
| Size (bytes) | 482,365,440 | 84,101,760 |
| Size | 460.0 MB | 80.2 MB |
| Events in quadrant A | 8,210,893 | 461,617 |
| Events in quadrant B | 2,347,931 | 635,470 |
| Events in quadrant C | 3,617,115 | 563,811 |
| Events in quadrant D | 3,288,183 | 532,175 |
| Mode SS | |||
|---|---|---|---|
| Quadrant | BADHDUFLAG | Total packets | Discarded packets |
| A | 0 | 104 | 0 |
| B | 0 | 104 | 0 |
| C | 0 | 104 | 0 |
| D | 0 | 104 | 0 |
| Mode M0 | |||
|---|---|---|---|
| Quadrant | BADHDUFLAG | Total packets | Discarded packets |
| A | 0 | 27917 | 3 |
| B | 0 | 10192 | 2 |
| C | 0 | 13713 | 2 |
| D | 0 | 13334 | 2 |
| Mode M9 | |||
|---|---|---|---|
| Quadrant | BADHDUFLAG | Total packets | Discarded packets |
| A | 0 | 32 | 0 |
| B | 0 | 32 | 0 |
| C | 0 | 32 | 0 |
| D | 0 | 33 | 0 |
| Quadrant | Total seconds | Saturated seconds | Saturation percentage |
|---|---|---|---|
| A | 5038 | 1646 | 32.671695% |
| B | 5038 | 8 | 0.158793% |
| C | 5038 | 313 | 6.212783% |
| D | 5038 | 172 | 3.414053% |
Noise dominated data is calculated using 1-second bins in cleaned event files. If a bin has >2000 counts, and if more than 50% of those come from <1% of pixels, then it is considered to be noise-dominated and hence unusable.
| Quadrant | # 1 sec bins | Bins with >0 counts | Bins with >2000 counts | High rate bins dominated by noise | Noise dominated (total time) | Noise dominated (detector-on time) | Marked lightcurve |
|---|---|---|---|---|---|---|---|
| A | 7041 | 5039 | 1687 | 1687 | 23.96% | 33.48% | 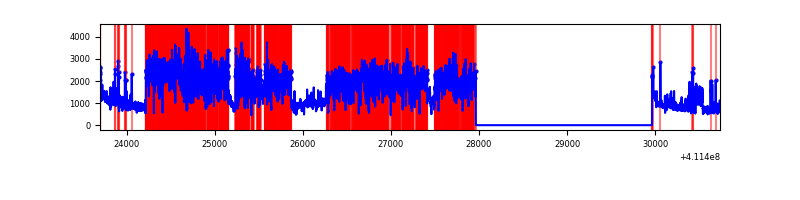 |
| B | 7041 | 5039 | 1 | 1 | 0.01% | 0.02% | 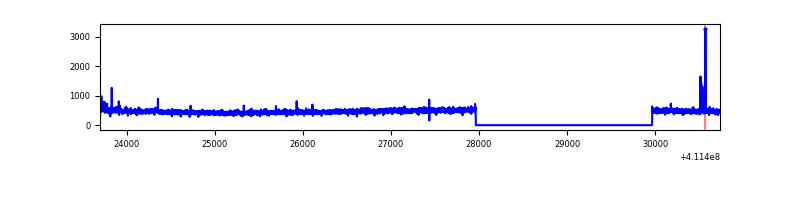 |
| C | 7041 | 5039 | 300 | 300 | 4.26% | 5.95% | 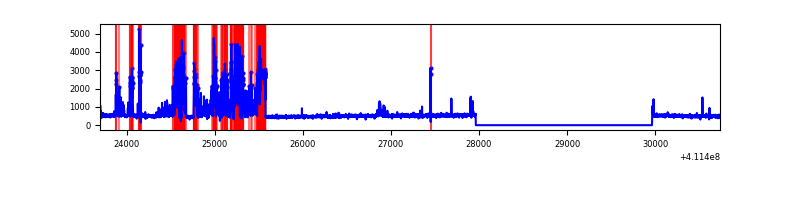 |
| D | 7041 | 5039 | 141 | 141 | 2.00% | 2.80% | 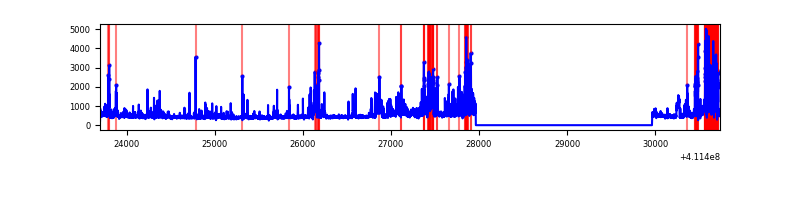 |
Top three noisy pixels from each quadrant. If the there are fewer than three noisy pixels in the level2.evt file, extra rows are filled as -1
| Pixel properties | Quadrant properties | ||||||
|---|---|---|---|---|---|---|---|
| Quadrant | DetID | PixID | Counts | Sigma | Mean | Median | Sigma |
| A | 15 | 222 | 5301140 | 48727.11 | 539 | 529 | 108.8 |
| A | 10 | 83 | 399873 | 3671.06 | 539 | 529 | 108.8 |
| A | 6 | 10 | 232462 | 2132.1 | 539 | 529 | 108.8 |
| B | 5 | 172 | 28866 | 252.28 | 586 | 572 | 112.2 |
| B | 12 | 111 | 13941 | 119.2 | 586 | 572 | 112.2 |
| B | 11 | 111 | 12838 | 109.37 | 586 | 572 | 112.2 |
| C | 15 | 208 | 1210758 | 9386.11 | 555 | 559 | 128.9 |
| C | 15 | 214 | 204546 | 1582.09 | 555 | 559 | 128.9 |
| C | 9 | 187 | 22099 | 167.06 | 555 | 559 | 128.9 |
| D | 1 | 47 | 435758 | 3168.12 | 556 | 541 | 137.4 |
| D | 1 | 52 | 301577 | 2191.36 | 556 | 541 | 137.4 |
| D | 12 | 227 | 138309 | 1002.87 | 556 | 541 | 137.4 |
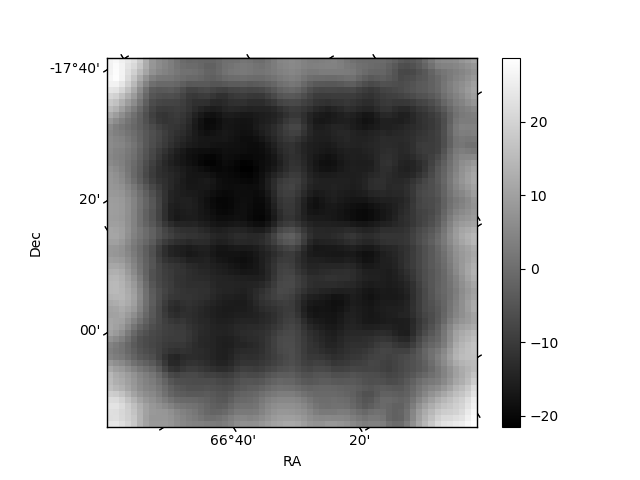
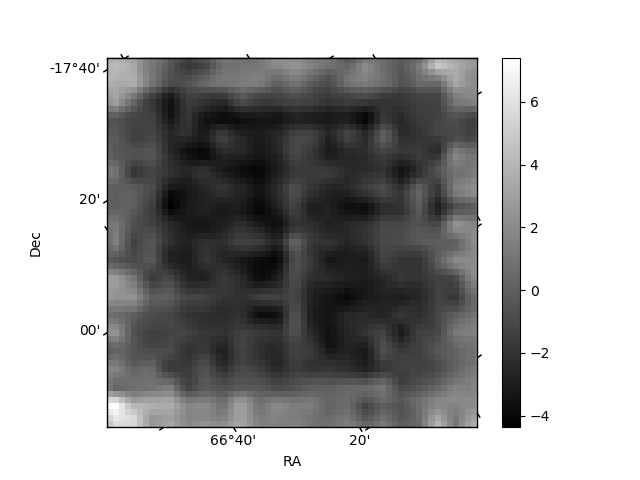
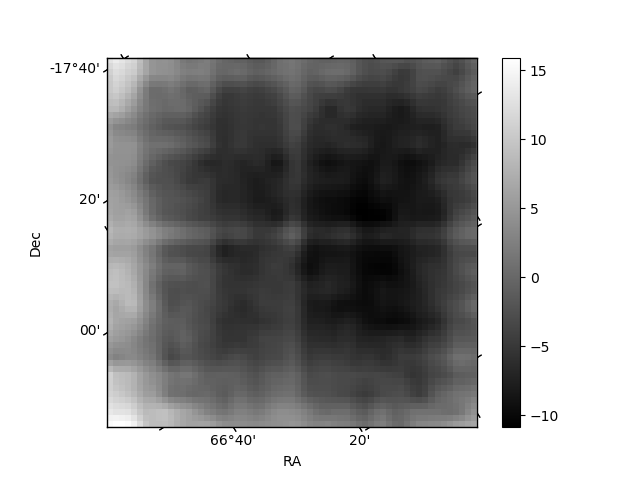
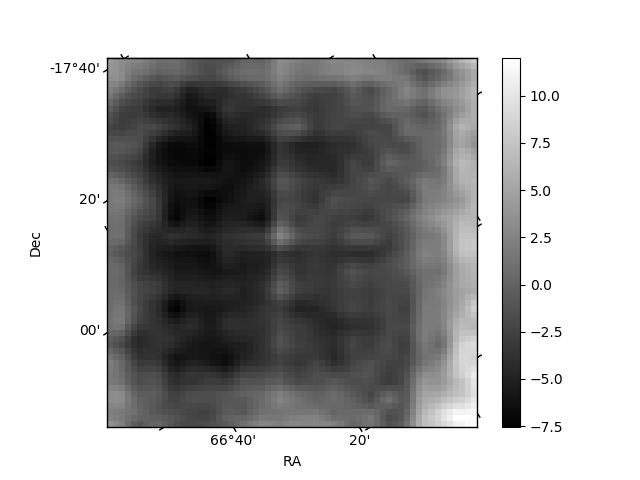
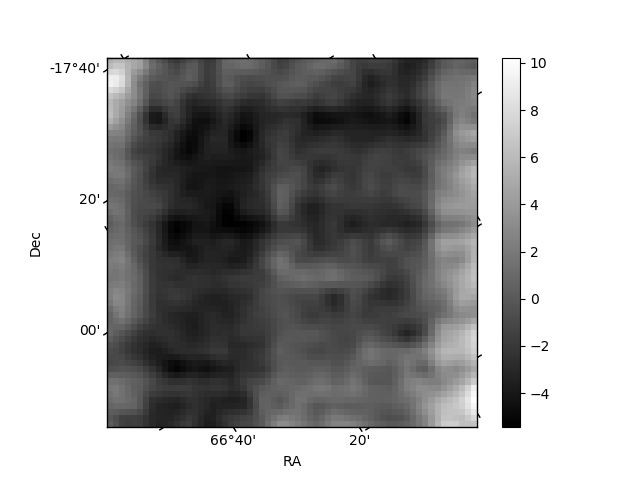
Histogram calculated using DETX and DETY for each event in the final _common_clean file
| Quadrant A | 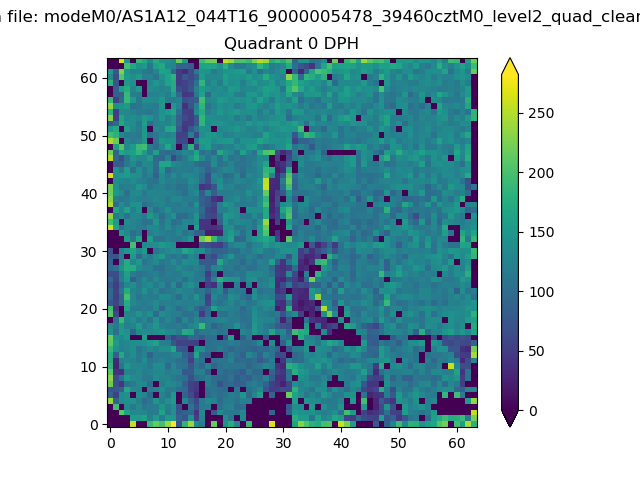 |
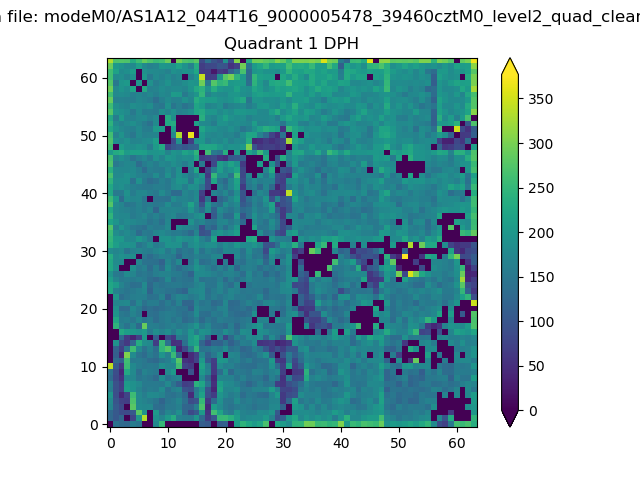 |
Quadrant B |
|---|---|---|---|
| Quadrant D | 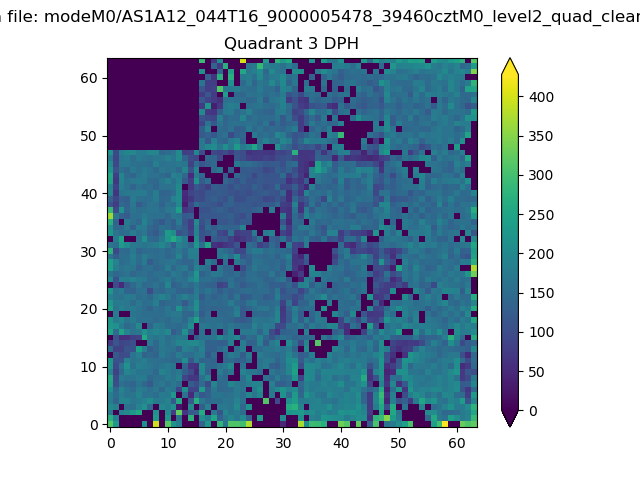 |
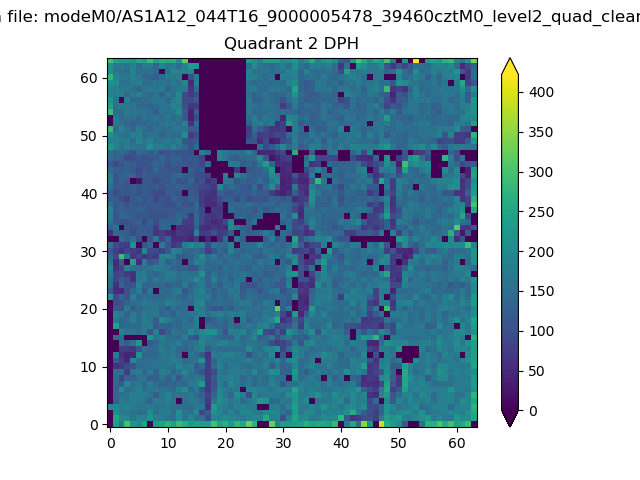 |
Quadrant C |
| Plot type | Count rate plots | Images |
|---|---|---|
| Comparison with Poisson distribution Blue bars denote a histogram of data divided into 1 sec bins. Red curve is a Poisson curve with rate = median count rate of data. |
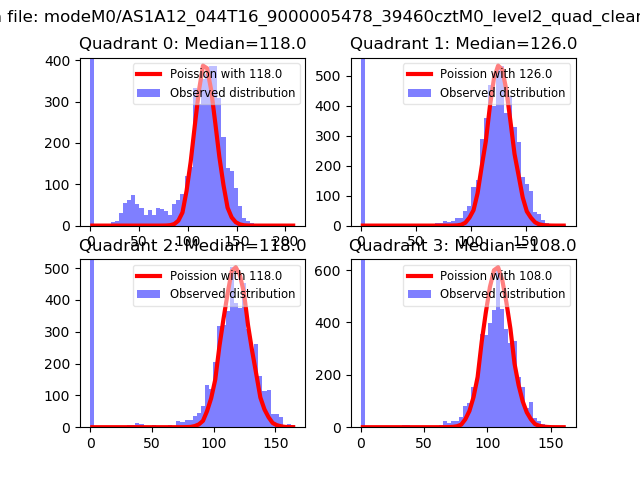 |
 |
| Quadrant-wise count rates Data is divided into 100 sec bins |
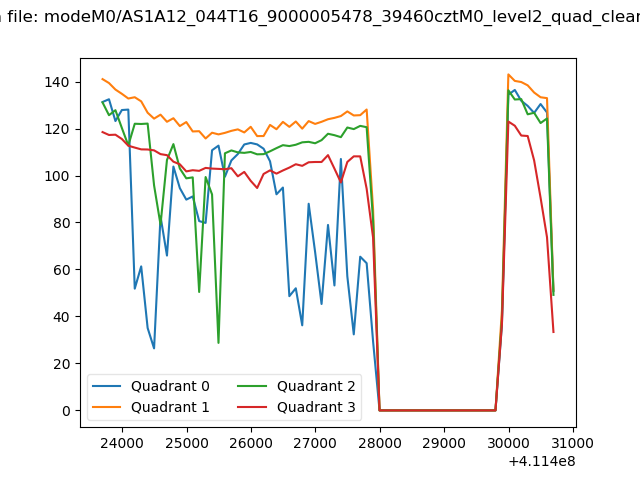 |
|
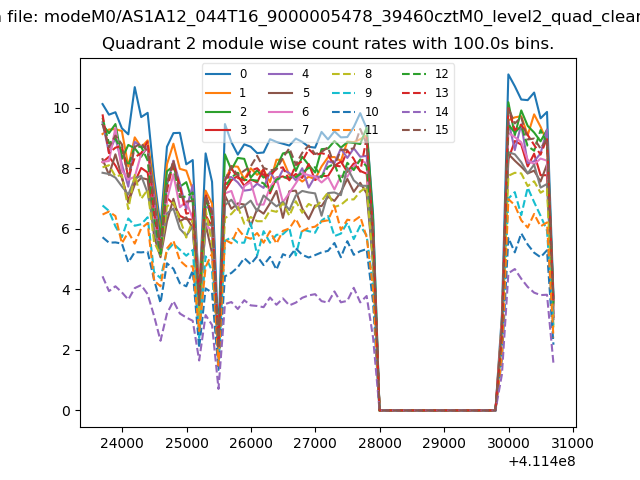
| Module-wise count rates for Quadrant A Data is divided into 100 sec bins |
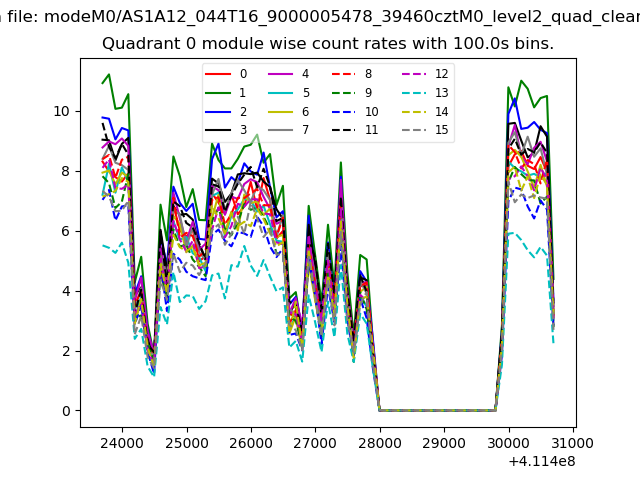 |
 |
| Module-wise count rates for Quadrant B Data is divided into 100 sec bins |
 |
 |
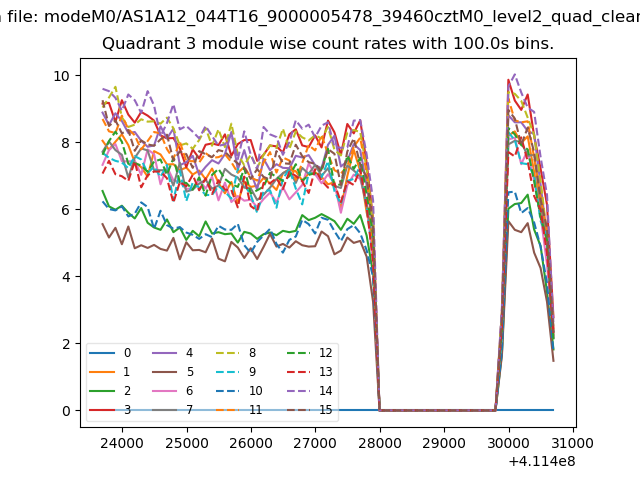
| Module-wise count rates for Quadrant C Data is divided into 100 sec bins |
 |
 |
| Module-wise count rates for Quadrant D Data is divided into 100 sec bins |
 |
 |
| Parameter | Plot |
|---|---|
| CZT HV Monitor | 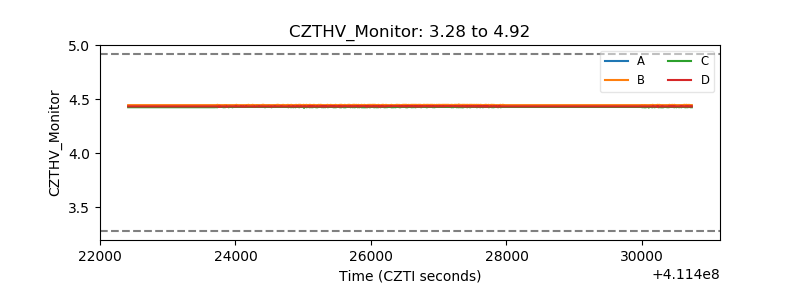 |
| D_VDD | 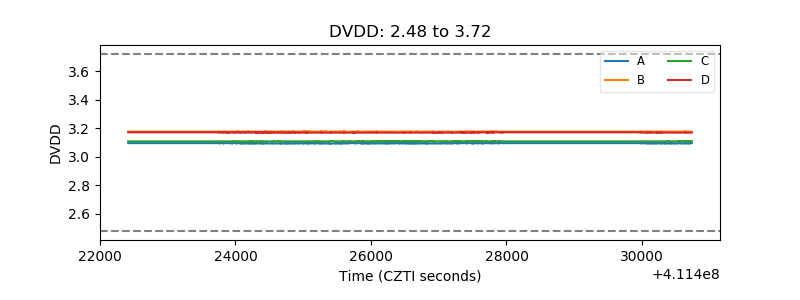 |
| Temperature 1 | 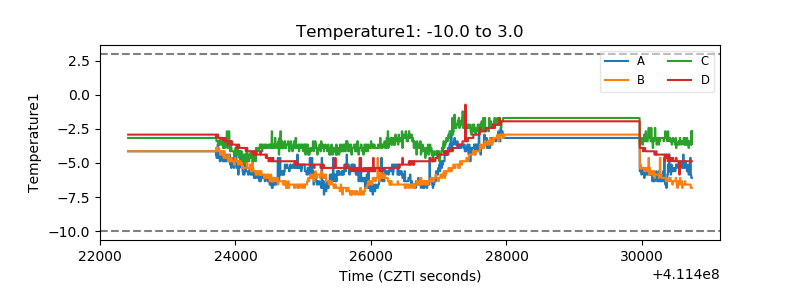 |
| Veto HV Monitor | 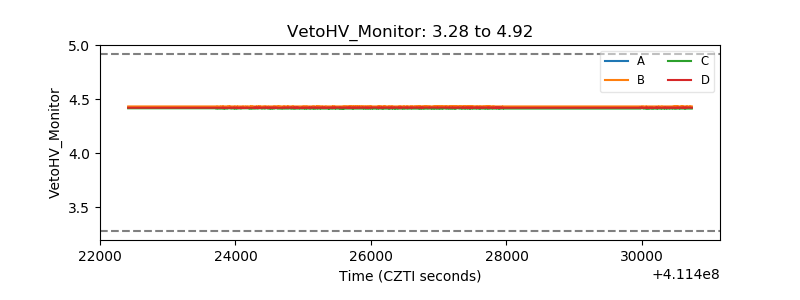 |
| Veto LLD | 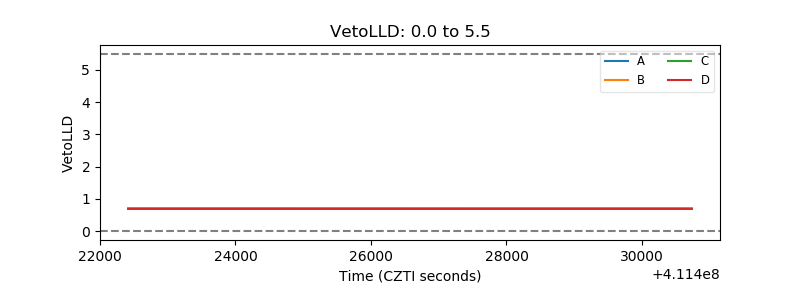 |
| Alpha Counter | 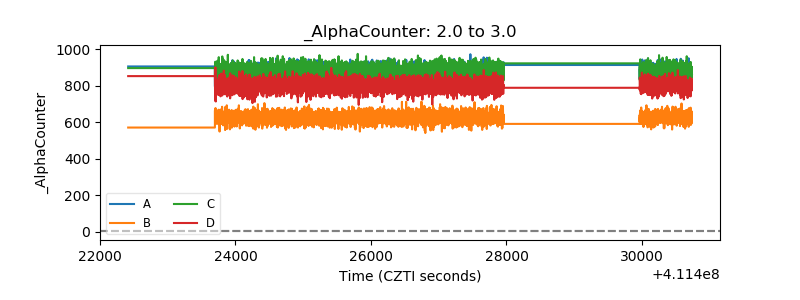 |
| _CPM_Rate | 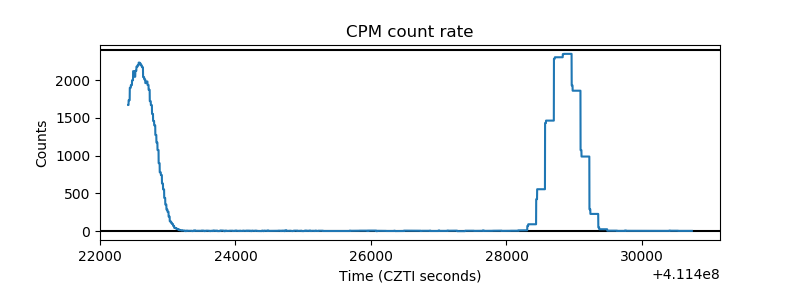 |
| CZT Counter | 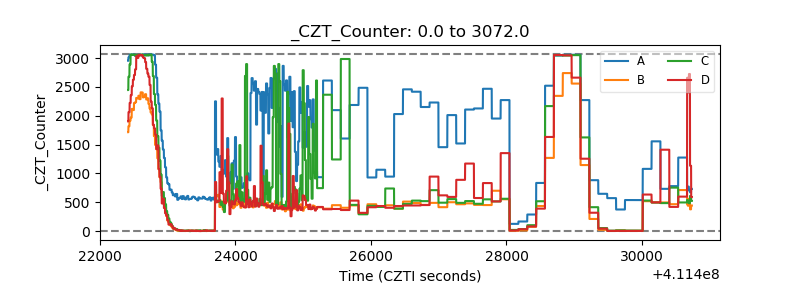 |
| +2.5 Volts monitor | 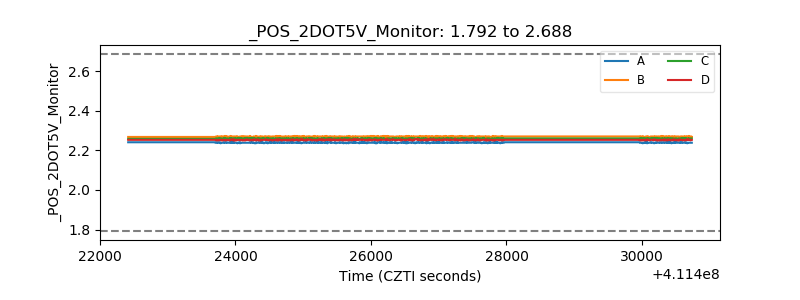 |
| +5 Volts monitor |  |
| _ROLL_ROT | 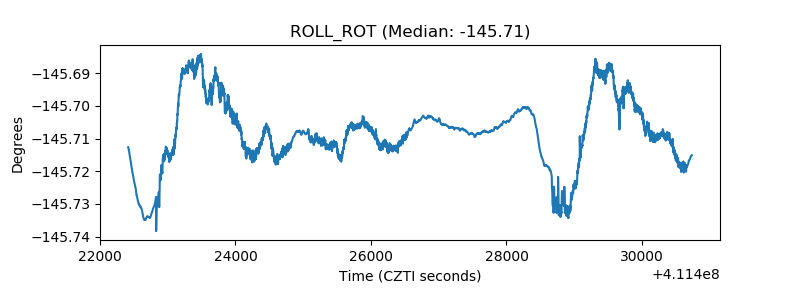 |
| _Roll_DEC | 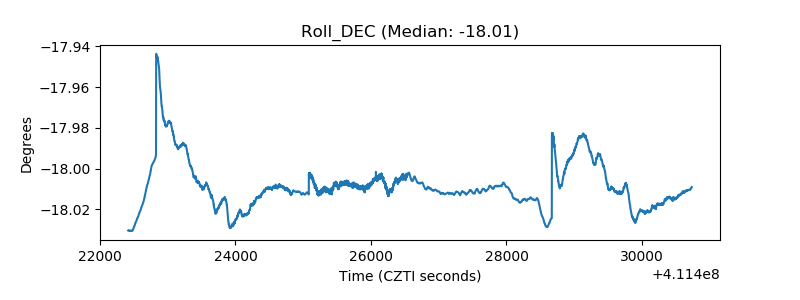 |
| _Roll_RA | 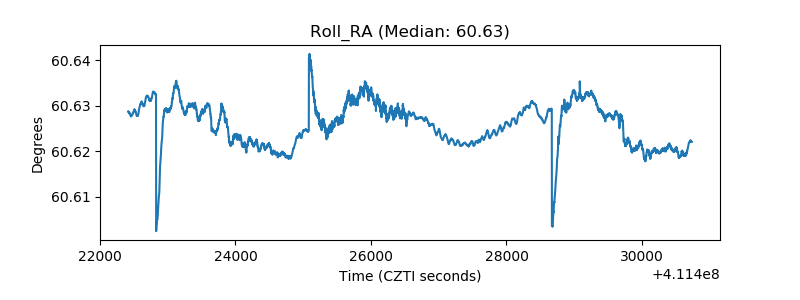 |
| Veto Counter | 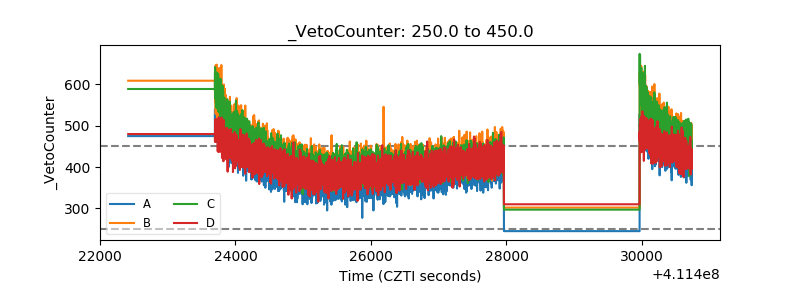 |