| Param | Original file | Final file |
|---|---|---|
| Filename | modeM0/AS1A12_044T16_9000005478_39462cztM0_level2.fits | modeM0/AS1A12_044T16_9000005478_39462cztM0_level2_quad_clean.evt |
| Size (bytes) | 376,646,400 | 90,979,200 |
| Size | 359.2 MB | 86.8 MB |
| Events in quadrant A | 4,629,719 | 604,767 |
| Events in quadrant B | 2,579,398 | 641,596 |
| Events in quadrant C | 3,179,366 | 601,286 |
| Events in quadrant D | 3,153,642 | 546,581 |
| Mode SS | |||
|---|---|---|---|
| Quadrant | BADHDUFLAG | Total packets | Discarded packets |
| A | 0 | 106 | 0 |
| B | 0 | 106 | 0 |
| C | 0 | 106 | 0 |
| D | 0 | 106 | 0 |
| Mode M0 | |||
|---|---|---|---|
| Quadrant | BADHDUFLAG | Total packets | Discarded packets |
| A | 0 | 17564 | 3 |
| B | 0 | 10960 | 2 |
| C | 0 | 12483 | 2 |
| D | 0 | 12812 | 2 |
| Mode M9 | |||
|---|---|---|---|
| Quadrant | BADHDUFLAG | Total packets | Discarded packets |
| A | 0 | 30 | 0 |
| B | 0 | 30 | 0 |
| C | 0 | 30 | 0 |
| D | 0 | 31 | 0 |
| Quadrant | Total seconds | Saturated seconds | Saturation percentage |
|---|---|---|---|
| A | 5148 | 214 | 4.156954% |
| B | 5148 | 36 | 0.699301% |
| C | 5148 | 90 | 1.748252% |
| D | 5148 | 107 | 2.078477% |
Noise dominated data is calculated using 1-second bins in cleaned event files. If a bin has >2000 counts, and if more than 50% of those come from <1% of pixels, then it is considered to be noise-dominated and hence unusable.
| Quadrant | # 1 sec bins | Bins with >0 counts | Bins with >2000 counts | High rate bins dominated by noise | Noise dominated (total time) | Noise dominated (detector-on time) | Marked lightcurve |
|---|---|---|---|---|---|---|---|
| A | 7302 | 5149 | 177 | 177 | 2.42% | 3.44% | 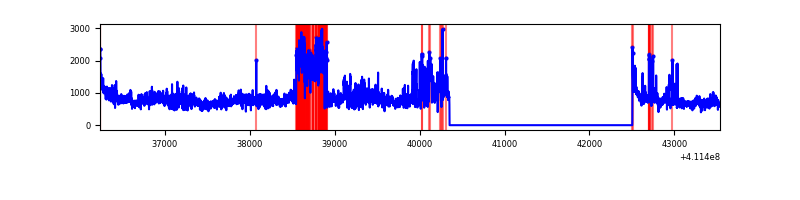 |
| B | 7302 | 5149 | 17 | 17 | 0.23% | 0.33% | 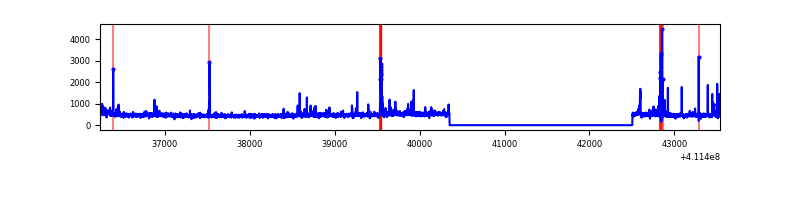 |
| C | 7302 | 5149 | 78 | 78 | 1.07% | 1.51% | 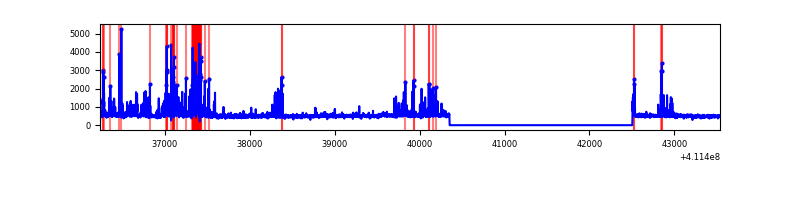 |
| D | 7302 | 5149 | 81 | 81 | 1.11% | 1.57% | 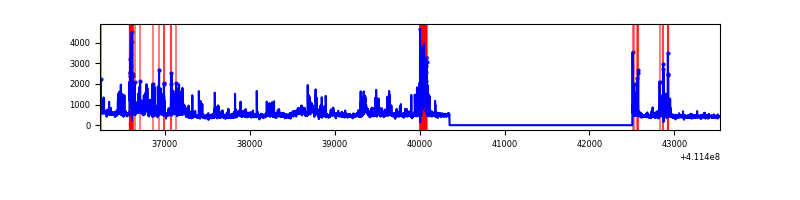 |
Top three noisy pixels from each quadrant. If the there are fewer than three noisy pixels in the level2.evt file, extra rows are filled as -1
| Pixel properties | Quadrant properties | ||||||
|---|---|---|---|---|---|---|---|
| Quadrant | DetID | PixID | Counts | Sigma | Mean | Median | Sigma |
| A | 15 | 222 | 1846880 | 15401.72 | 590 | 578 | 119.9 |
| A | 10 | 83 | 418072 | 3482.71 | 590 | 578 | 119.9 |
| A | 15 | 174 | 45324 | 373.27 | 590 | 578 | 119.9 |
| B | 8 | 3 | 117907 | 1015.47 | 596 | 581 | 115.5 |
| B | 5 | 172 | 111869 | 963.21 | 596 | 581 | 115.5 |
| B | 12 | 111 | 14407 | 119.67 | 596 | 581 | 115.5 |
| C | 15 | 208 | 662963 | 4814.85 | 587 | 593 | 137.6 |
| C | 15 | 214 | 217329 | 1575.48 | 587 | 593 | 137.6 |
| C | 0 | 10 | 6627 | 43.86 | 587 | 593 | 137.6 |
| D | 2 | 249 | 326586 | 2293.75 | 577 | 562 | 142.1 |
| D | 12 | 248 | 196391 | 1377.76 | 577 | 562 | 142.1 |
| D | 1 | 47 | 178905 | 1254.74 | 577 | 562 | 142.1 |
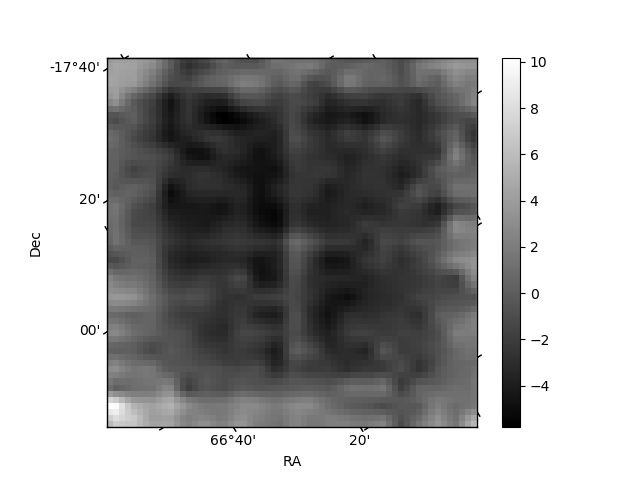
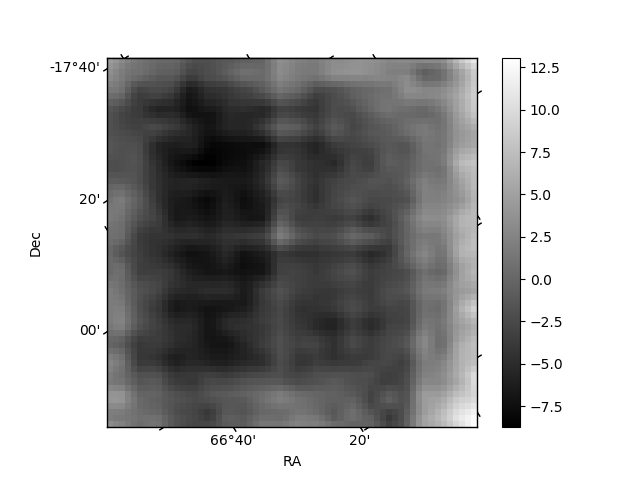
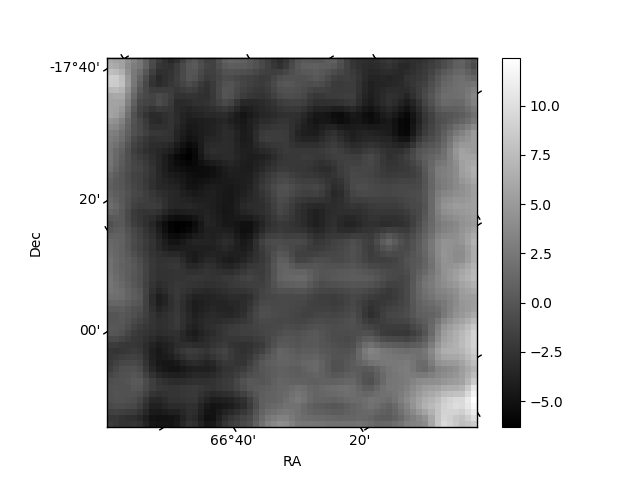
Histogram calculated using DETX and DETY for each event in the final _common_clean file
| Quadrant A | 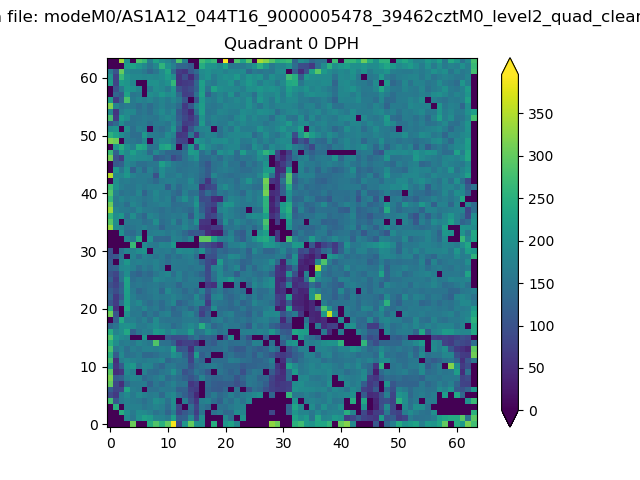 |
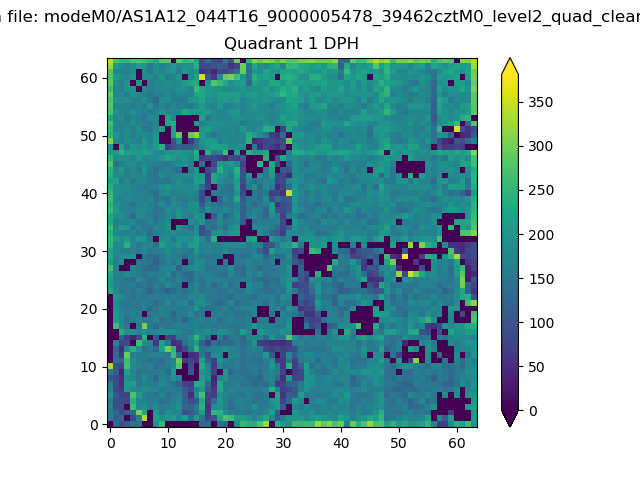 |
Quadrant B |
|---|---|---|---|
| Quadrant D | 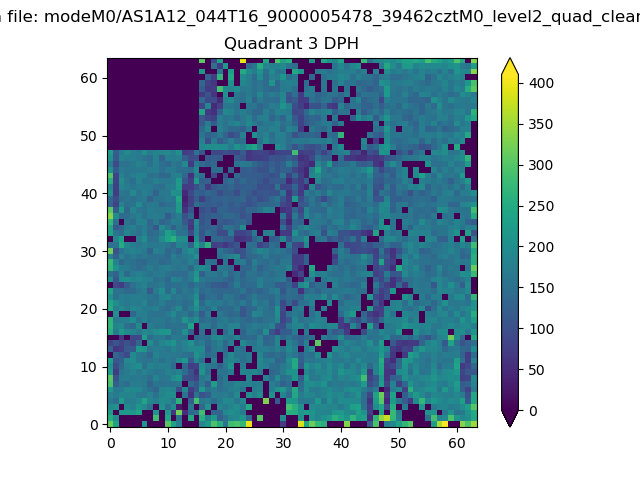 |
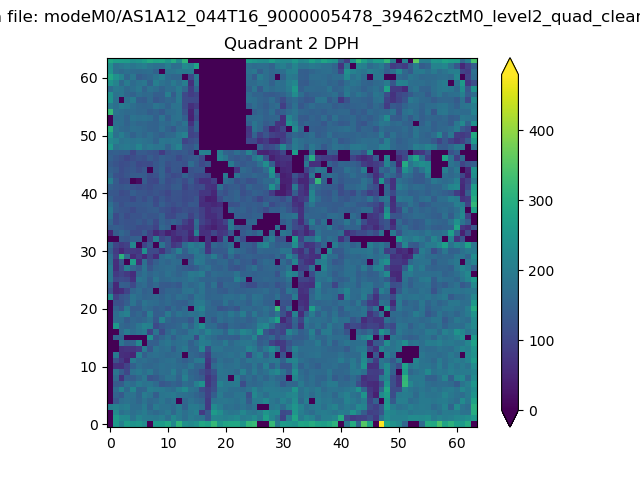 |
Quadrant C |
| Plot type | Count rate plots | Images |
|---|---|---|
| Comparison with Poisson distribution Blue bars denote a histogram of data divided into 1 sec bins. Red curve is a Poisson curve with rate = median count rate of data. |
 |
 |
| Quadrant-wise count rates Data is divided into 100 sec bins |
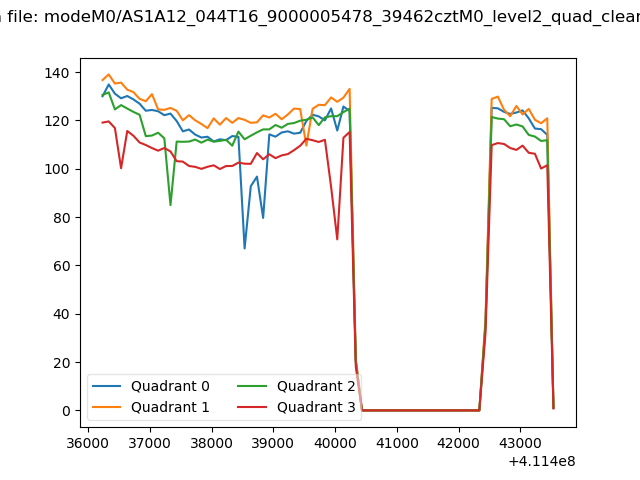 |
|
| Module-wise count rates for Quadrant A Data is divided into 100 sec bins |
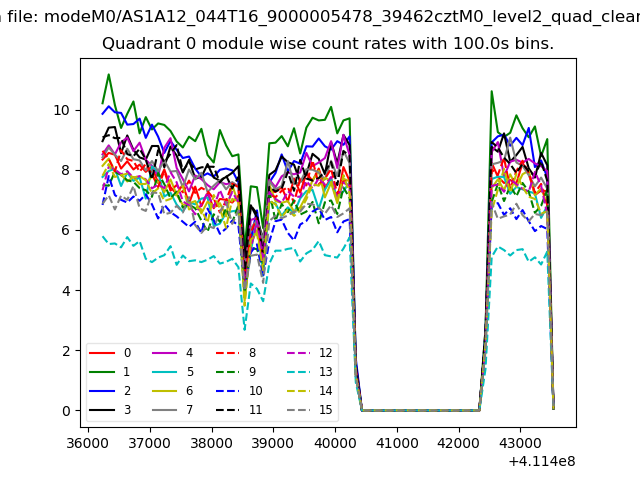 |
 |
| Module-wise count rates for Quadrant B Data is divided into 100 sec bins |
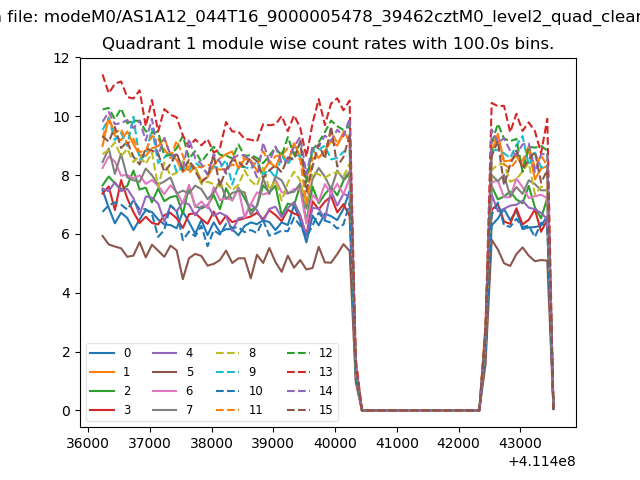 |
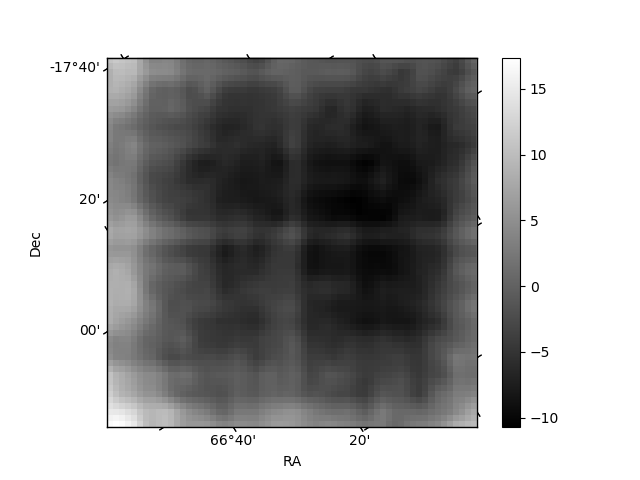 |
| Module-wise count rates for Quadrant C Data is divided into 100 sec bins |
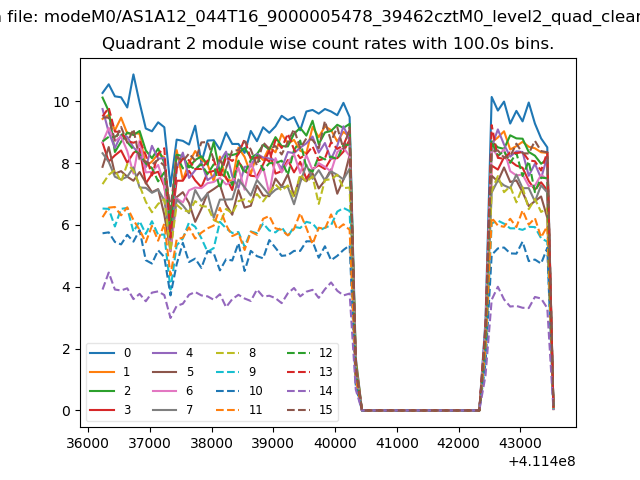 |
 |
| Module-wise count rates for Quadrant D Data is divided into 100 sec bins |
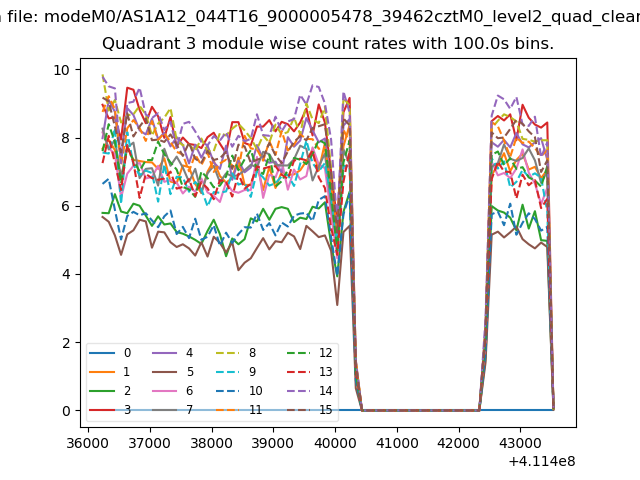 |
 |
| Parameter | Plot |
|---|---|
| CZT HV Monitor | 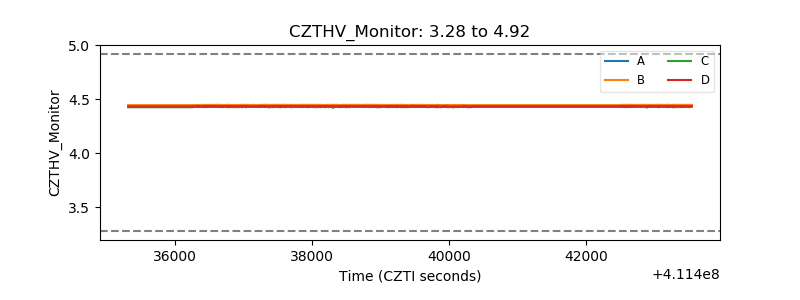 |
| D_VDD | 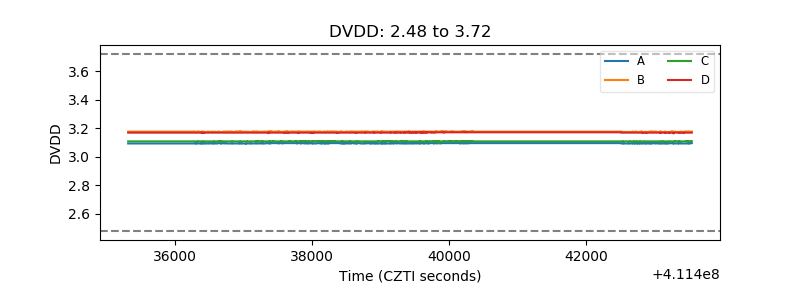 |
| Temperature 1 | 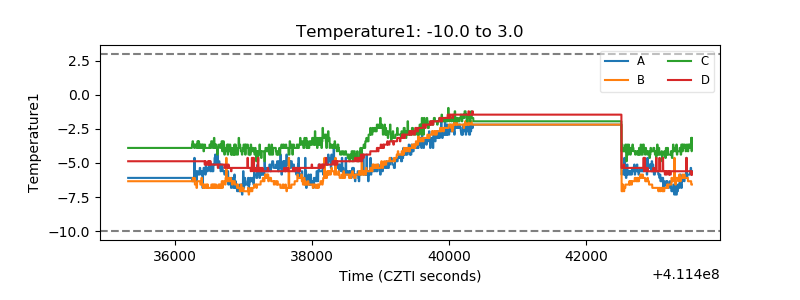 |
| Veto HV Monitor |  |
| Veto LLD | 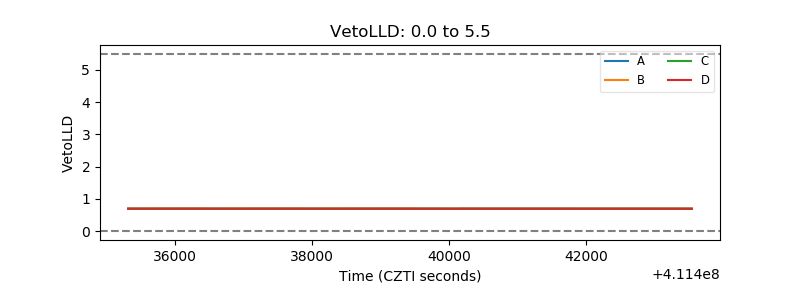 |
| Alpha Counter |  |
| _CPM_Rate | 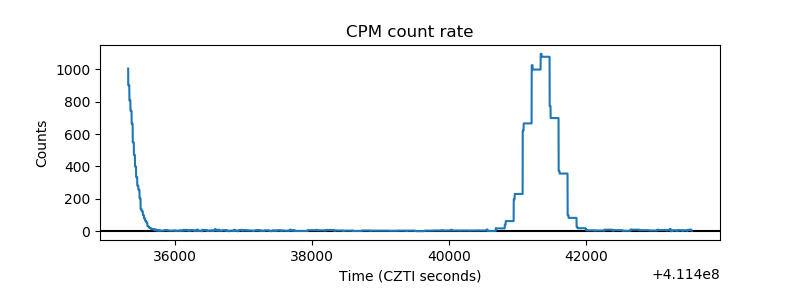 |
| CZT Counter | 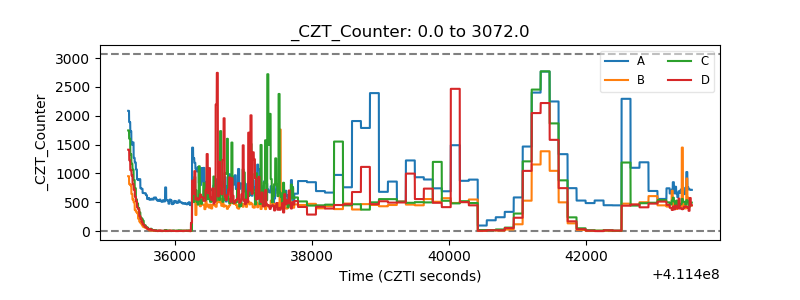 |
| +2.5 Volts monitor | 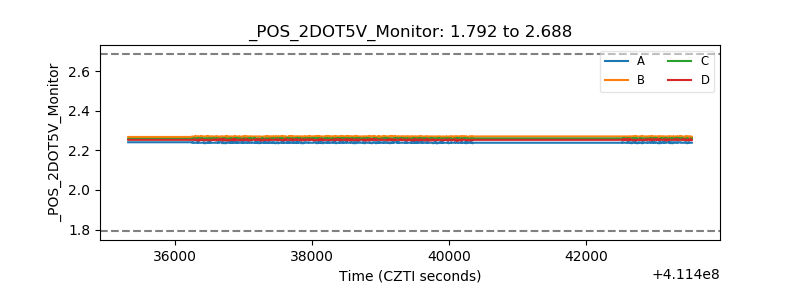 |
| +5 Volts monitor | 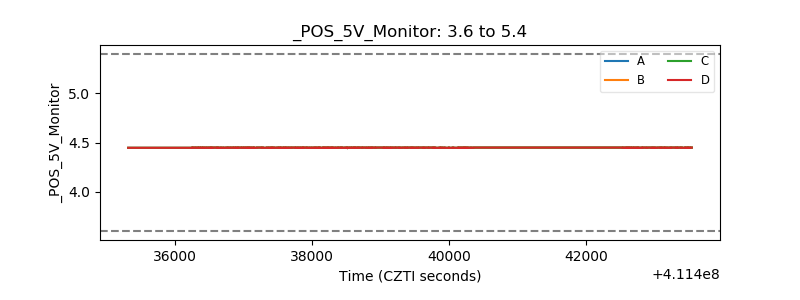 |
| _ROLL_ROT | 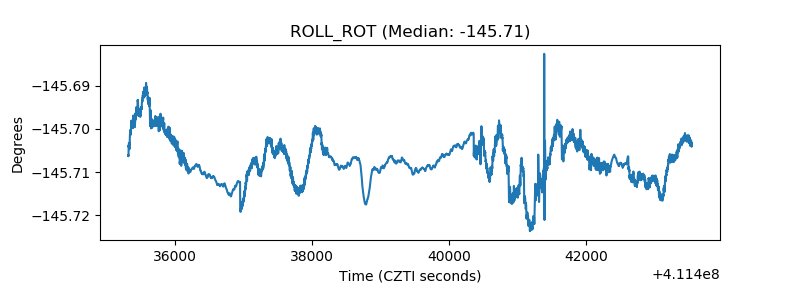 |
| _Roll_DEC | 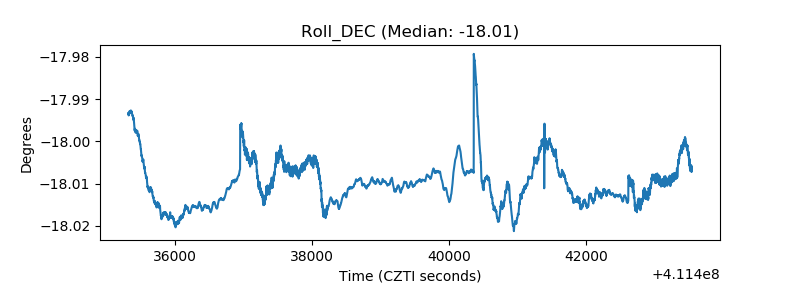 |
| _Roll_RA |  |
| Veto Counter | 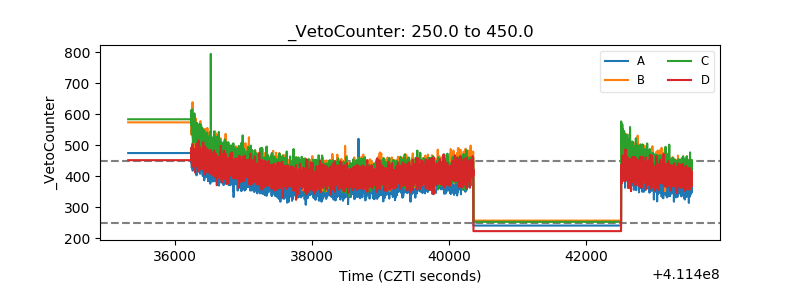 |