| Param | Original file | Final file |
|---|---|---|
| Filename | modeM0/AS1A12_044T16_9000005478_39463cztM0_level2.fits | modeM0/AS1A12_044T16_9000005478_39463cztM0_level2_quad_clean.evt |
| Size (bytes) | 372,723,840 | 85,135,680 |
| Size | 355.5 MB | 81.2 MB |
| Events in quadrant A | 4,754,989 | 559,733 |
| Events in quadrant B | 3,097,189 | 573,419 |
| Events in quadrant C | 2,909,375 | 569,653 |
| Events in quadrant D | 2,644,891 | 522,775 |
| Mode SS | |||
|---|---|---|---|
| Quadrant | BADHDUFLAG | Total packets | Discarded packets |
| A | 0 | 104 | 0 |
| B | 0 | 104 | 0 |
| C | 0 | 104 | 0 |
| D | 0 | 104 | 0 |
| Mode M0 | |||
|---|---|---|---|
| Quadrant | BADHDUFLAG | Total packets | Discarded packets |
| A | 0 | 17856 | 3 |
| B | 0 | 12506 | 2 |
| C | 0 | 11639 | 2 |
| D | 0 | 11221 | 2 |
| Mode M9 | |||
|---|---|---|---|
| Quadrant | BADHDUFLAG | Total packets | Discarded packets |
| A | 0 | 24 | 0 |
| B | 0 | 24 | 0 |
| C | 0 | 24 | 0 |
| D | 0 | 25 | 0 |
| Quadrant | Total seconds | Saturated seconds | Saturation percentage |
|---|---|---|---|
| A | 5021 | 294 | 5.855407% |
| B | 5021 | 269 | 5.357499% |
| C | 5021 | 38 | 0.756821% |
| D | 5021 | 50 | 0.995818% |
Noise dominated data is calculated using 1-second bins in cleaned event files. If a bin has >2000 counts, and if more than 50% of those come from <1% of pixels, then it is considered to be noise-dominated and hence unusable.
| Quadrant | # 1 sec bins | Bins with >0 counts | Bins with >2000 counts | High rate bins dominated by noise | Noise dominated (total time) | Noise dominated (detector-on time) | Marked lightcurve |
|---|---|---|---|---|---|---|---|
| A | 7114 | 5022 | 269 | 269 | 3.78% | 5.36% | 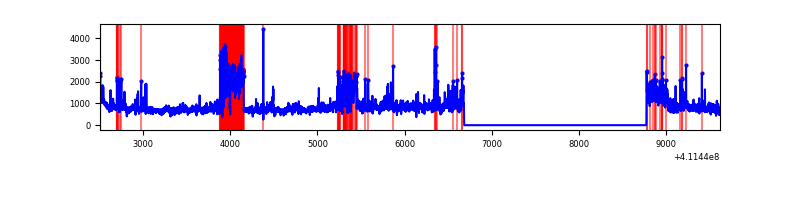 |
| B | 7114 | 5022 | 209 | 209 | 2.94% | 4.16% | 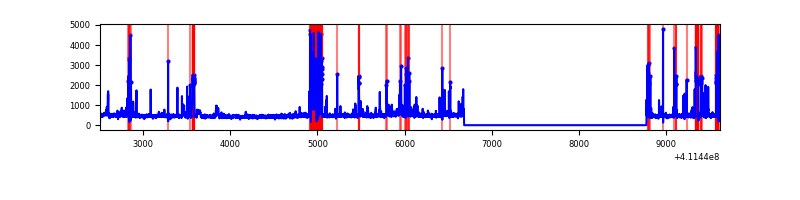 |
| C | 7114 | 5022 | 27 | 27 | 0.38% | 0.54% | 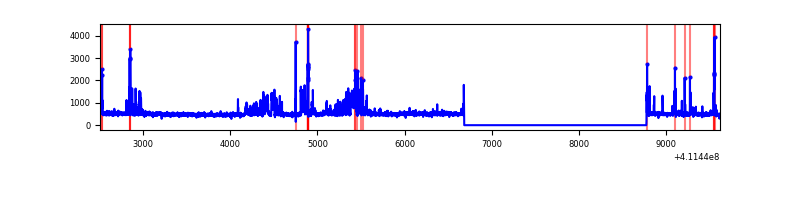 |
| D | 7114 | 5022 | 39 | 39 | 0.55% | 0.78% | 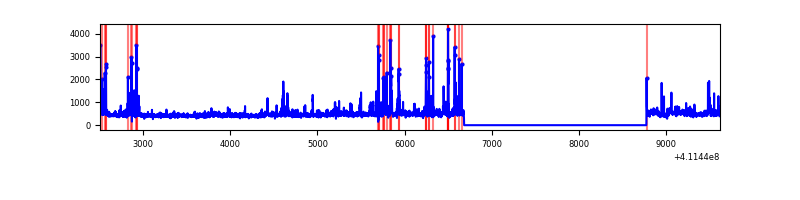 |
Top three noisy pixels from each quadrant. If the there are fewer than three noisy pixels in the level2.evt file, extra rows are filled as -1
| Pixel properties | Quadrant properties | ||||||
|---|---|---|---|---|---|---|---|
| Quadrant | DetID | PixID | Counts | Sigma | Mean | Median | Sigma |
| A | 15 | 222 | 2093000 | 18310.68 | 563 | 552 | 114.3 |
| A | 10 | 83 | 413657 | 3615.02 | 563 | 552 | 114.3 |
| A | 15 | 174 | 40248 | 347.37 | 563 | 552 | 114.3 |
| B | 5 | 172 | 879019 | 8089.09 | 557 | 542 | 108.6 |
| B | 8 | 3 | 17611 | 157.17 | 557 | 542 | 108.6 |
| B | 12 | 111 | 13707 | 121.22 | 557 | 542 | 108.6 |
| C | 15 | 208 | 478030 | 3624.69 | 562 | 567 | 131.7 |
| C | 15 | 214 | 215179 | 1629.24 | 562 | 567 | 131.7 |
| C | 10 | 20 | 8426 | 59.66 | 562 | 567 | 131.7 |
| D | 12 | 227 | 169528 | 1241.93 | 558 | 543 | 136.1 |
| D | 2 | 249 | 120791 | 883.74 | 558 | 543 | 136.1 |
| D | 13 | 249 | 98922 | 723.02 | 558 | 543 | 136.1 |
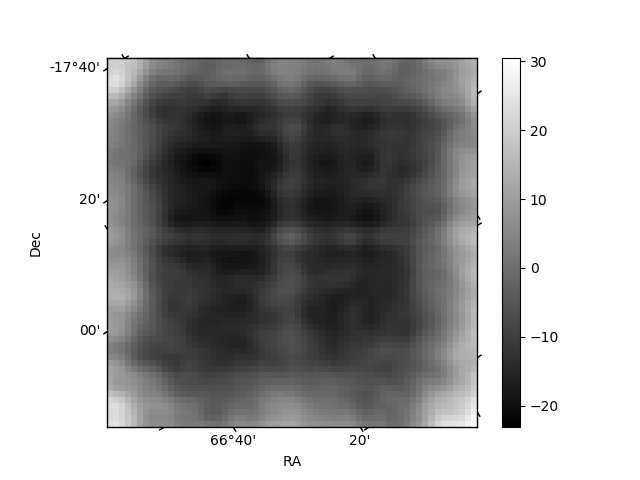
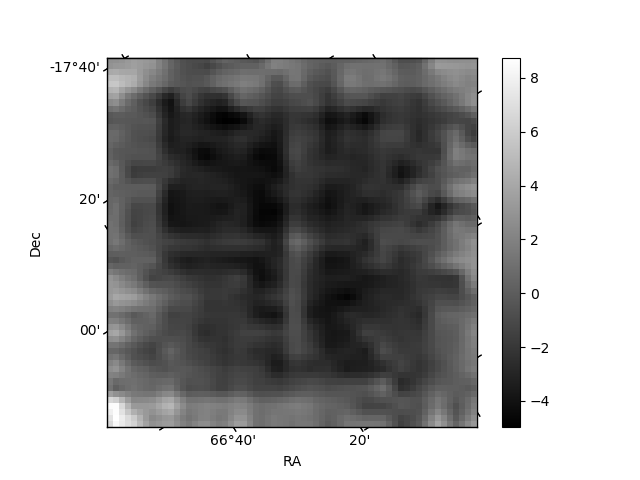
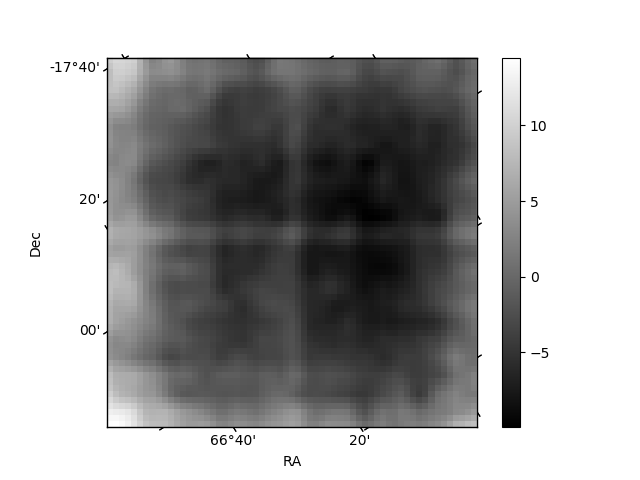
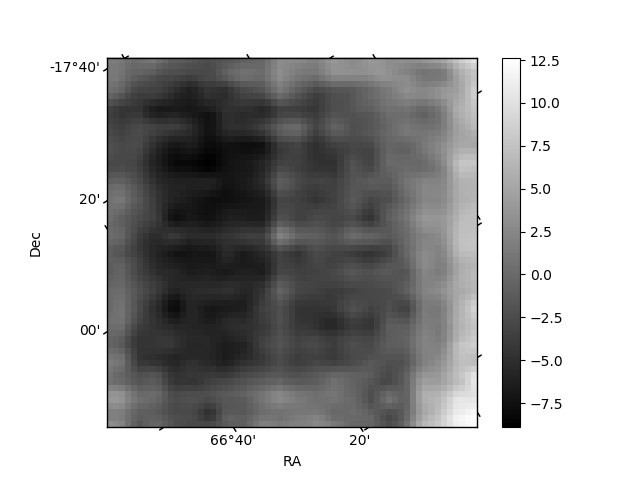
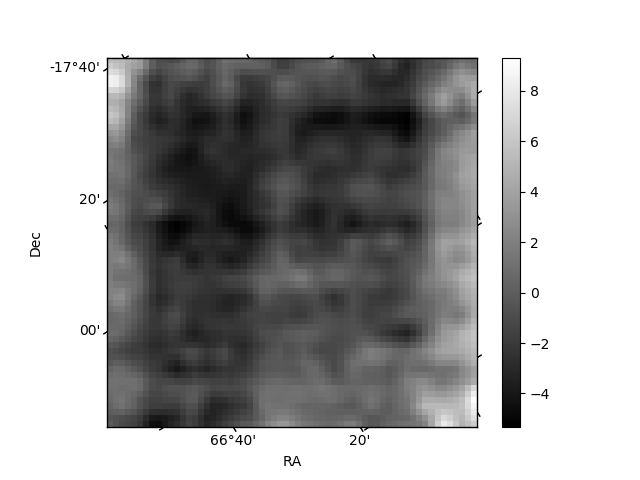
Histogram calculated using DETX and DETY for each event in the final _common_clean file
| Quadrant A | 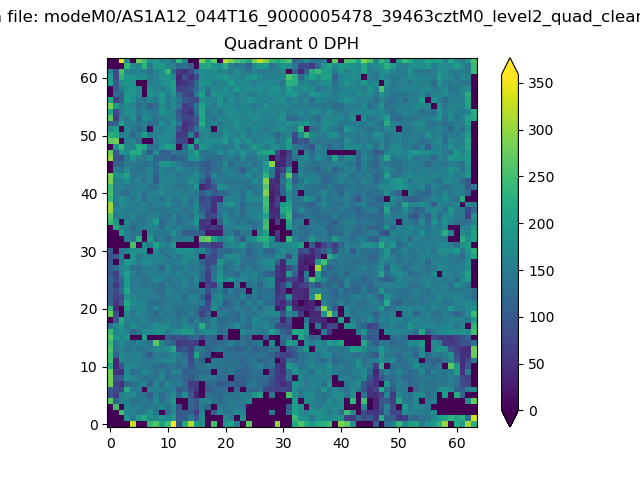 |
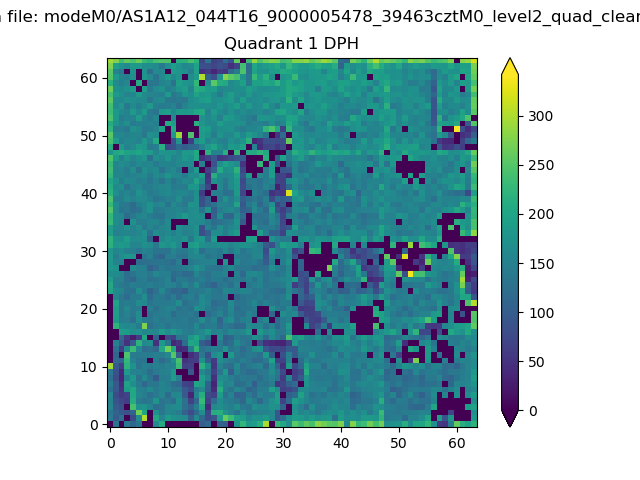 |
Quadrant B |
|---|---|---|---|
| Quadrant D | 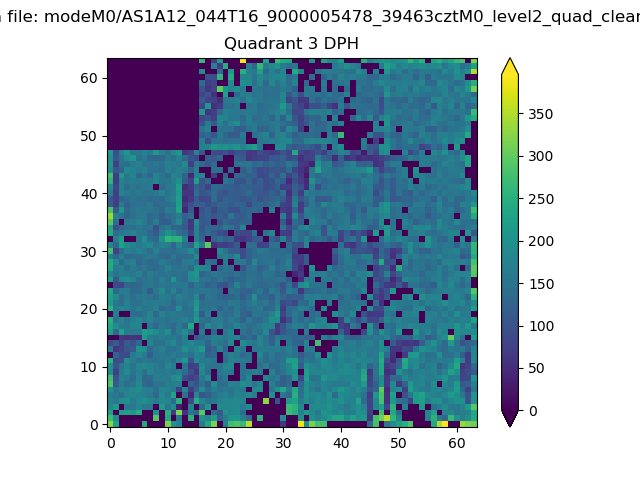 |
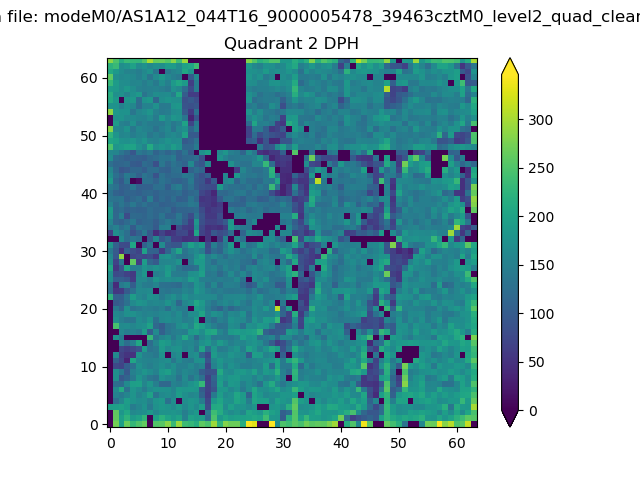 |
Quadrant C |
| Plot type | Count rate plots | Images |
|---|---|---|
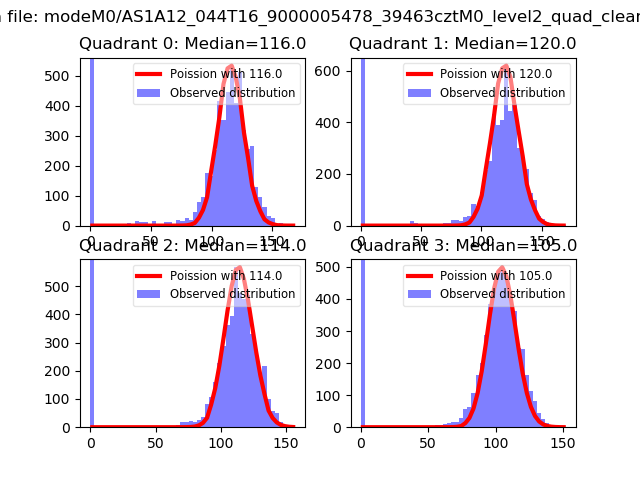
| Comparison with Poisson distribution Blue bars denote a histogram of data divided into 1 sec bins. Red curve is a Poisson curve with rate = median count rate of data. |
 |
 |
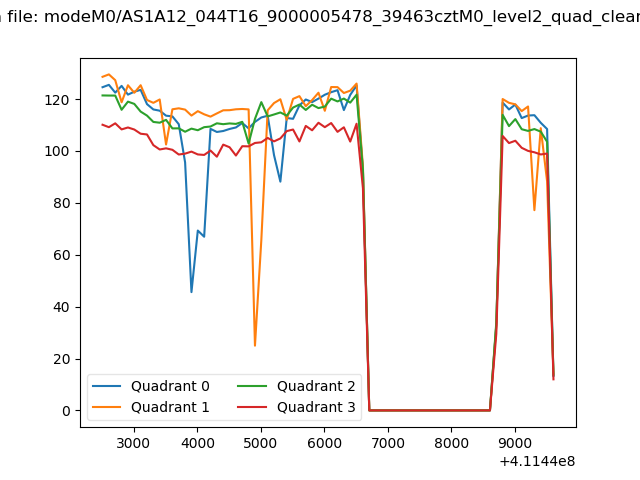
| Quadrant-wise count rates Data is divided into 100 sec bins |
 |
|
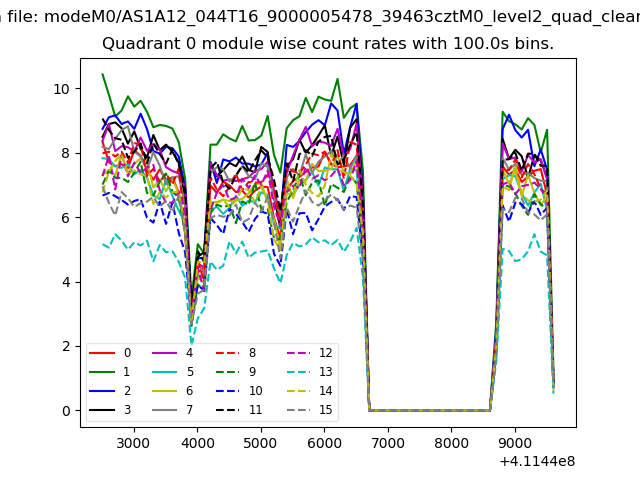
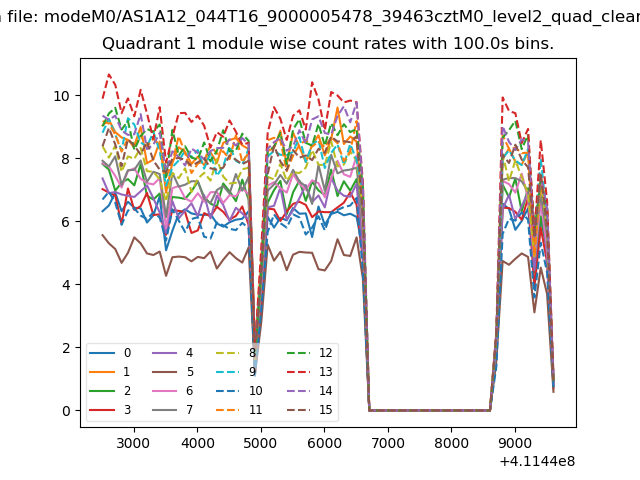
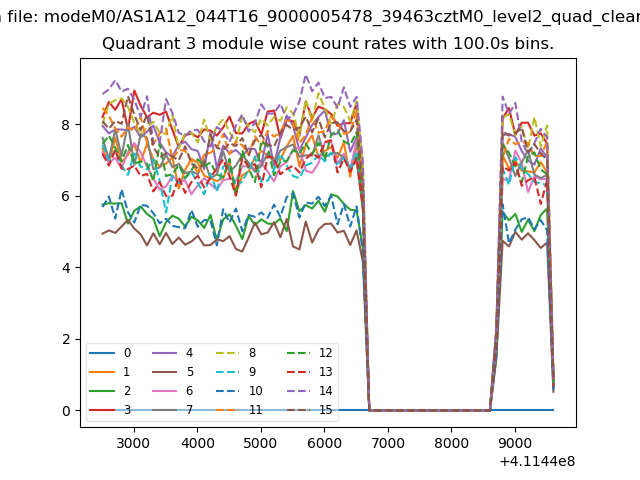
| Module-wise count rates for Quadrant A Data is divided into 100 sec bins |
 |
 |
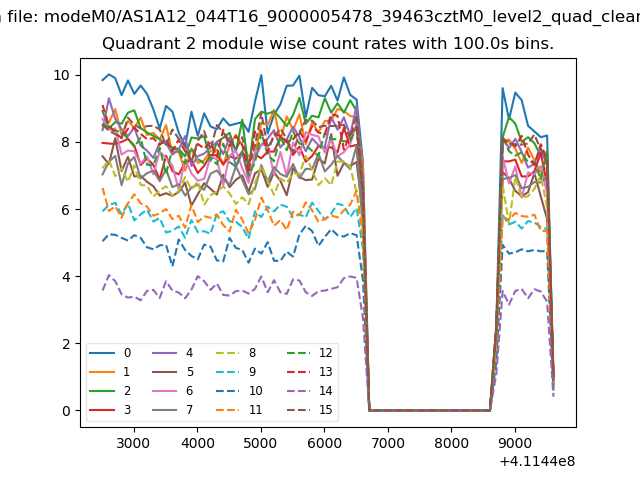
| Module-wise count rates for Quadrant B Data is divided into 100 sec bins |
 |
 |
| Module-wise count rates for Quadrant C Data is divided into 100 sec bins |
 |
 |
| Module-wise count rates for Quadrant D Data is divided into 100 sec bins |
 |
 |
| Parameter | Plot |
|---|---|
| CZT HV Monitor | 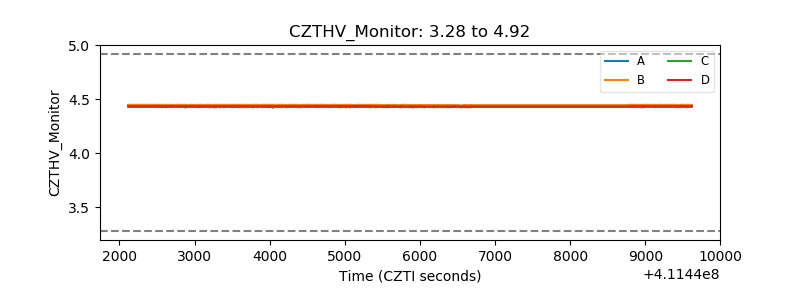 |
| D_VDD | 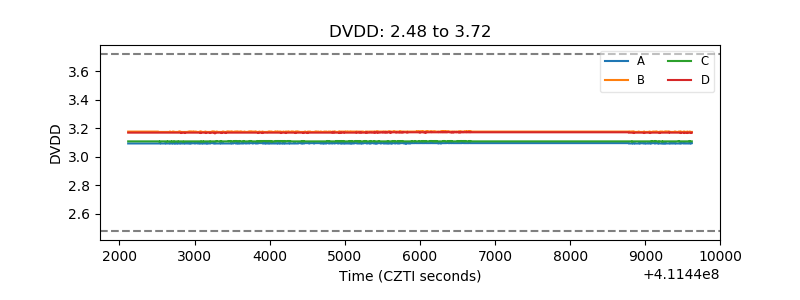 |
| Temperature 1 | 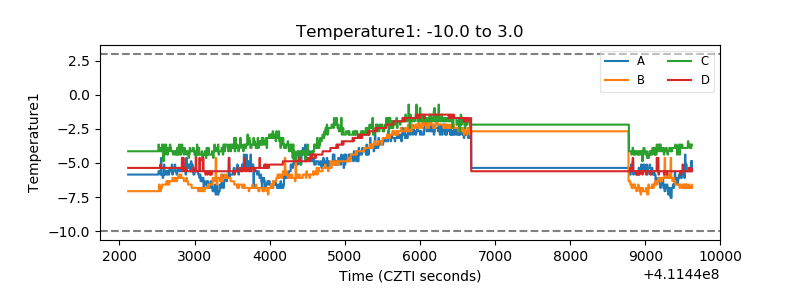 |
| Veto HV Monitor | 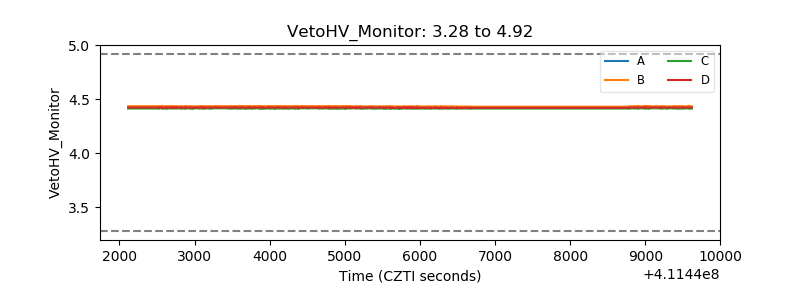 |
| Veto LLD | 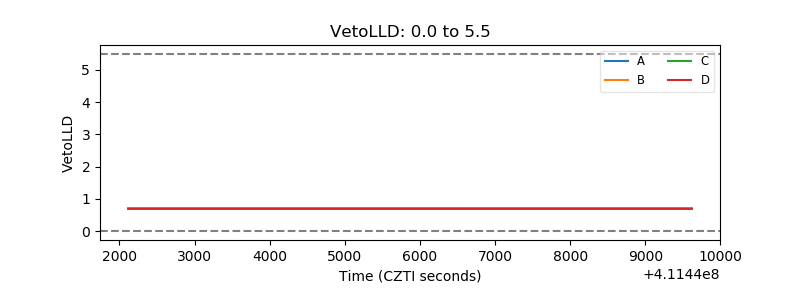 |
| Alpha Counter | 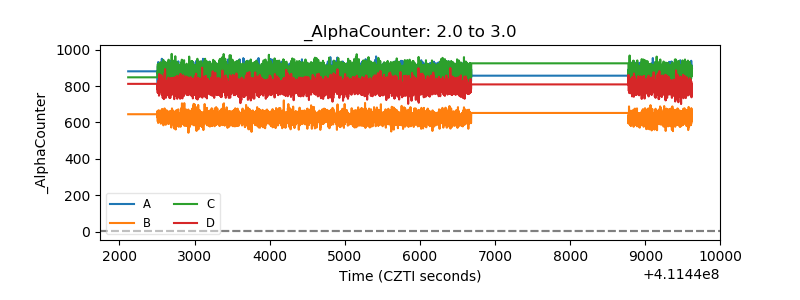 |
| _CPM_Rate | 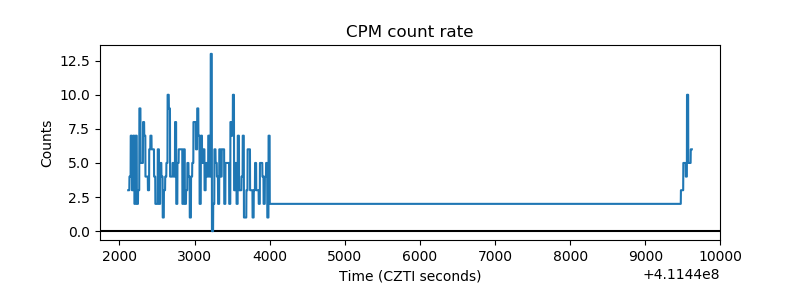 |
| CZT Counter | 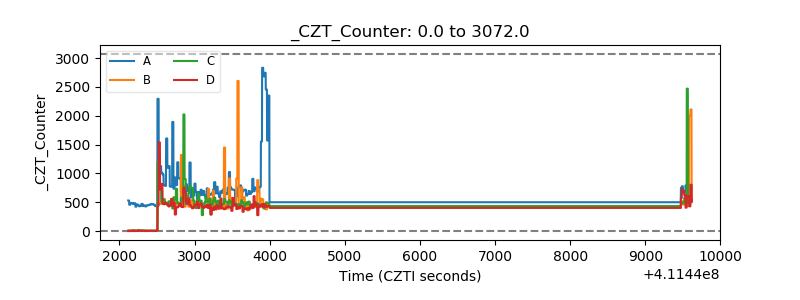 |
| +2.5 Volts monitor | 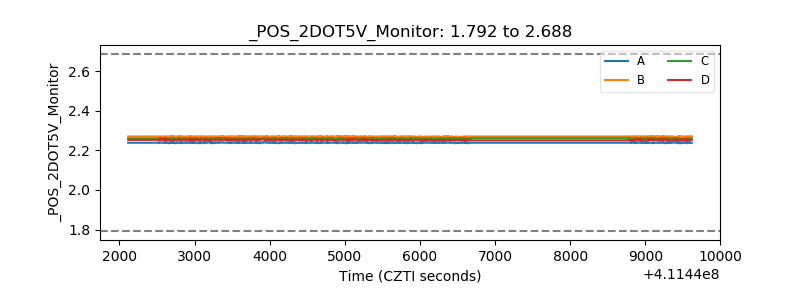 |
| +5 Volts monitor | 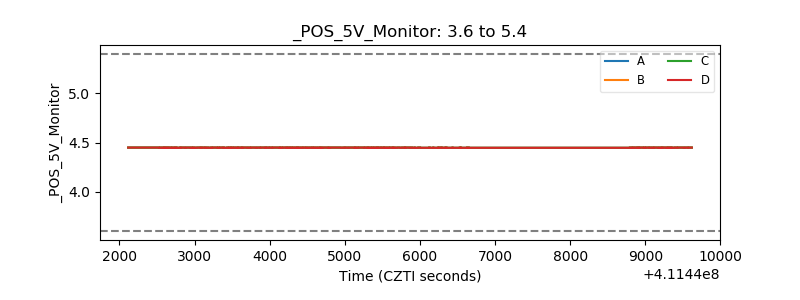 |
| _ROLL_ROT | 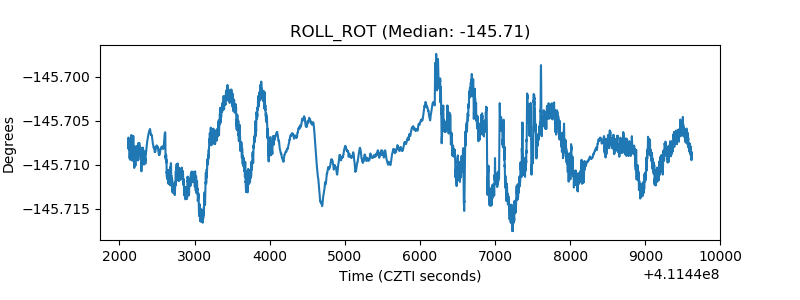 |
| _Roll_DEC | 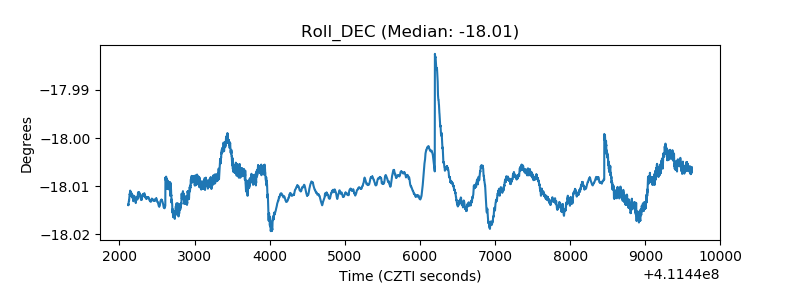 |
| _Roll_RA |  |
| Veto Counter | 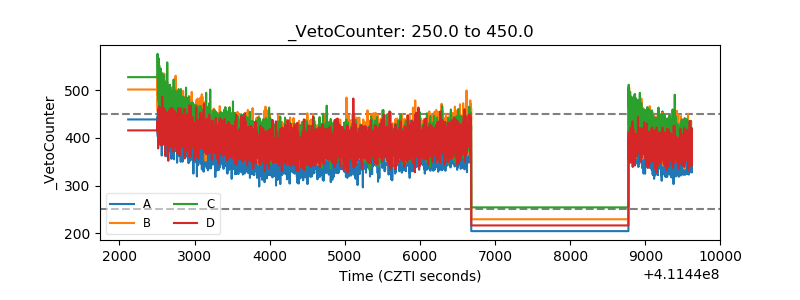 |