| Param | Original file | Final file |
|---|---|---|
| Filename | modeM0/AS1A12_044T16_9000005478_39464cztM0_level2.fits | modeM0/AS1A12_044T16_9000005478_39464cztM0_level2_quad_clean.evt |
| Size (bytes) | 428,495,040 | 88,750,080 |
| Size | 408.6 MB | 84.6 MB |
| Events in quadrant A | 5,366,447 | 581,376 |
| Events in quadrant B | 2,744,459 | 611,960 |
| Events in quadrant C | 3,889,953 | 580,688 |
| Events in quadrant D | 3,441,761 | 535,643 |
| Mode SS | |||
|---|---|---|---|
| Quadrant | BADHDUFLAG | Total packets | Discarded packets |
| A | 0 | 112 | 0 |
| B | 0 | 112 | 0 |
| C | 0 | 112 | 0 |
| D | 0 | 112 | 0 |
| Mode M0 | |||
|---|---|---|---|
| Quadrant | BADHDUFLAG | Total packets | Discarded packets |
| A | 0 | 19834 | 2 |
| B | 0 | 11765 | 1 |
| C | 0 | 14990 | 1 |
| D | 0 | 13859 | 1 |
| Mode M9 | |||
|---|---|---|---|
| Quadrant | BADHDUFLAG | Total packets | Discarded packets |
| A | 0 | 40 | 0 |
| B | 0 | 40 | 0 |
| C | 0 | 40 | 0 |
| D | 0 | 40 | 0 |
| Quadrant | Total seconds | Saturated seconds | Saturation percentage |
|---|---|---|---|
| A | 5393 | 326 | 6.044873% |
| B | 5393 | 113 | 2.095309% |
| C | 5393 | 150 | 2.781383% |
| D | 5393 | 141 | 2.614500% |
Noise dominated data is calculated using 1-second bins in cleaned event files. If a bin has >2000 counts, and if more than 50% of those come from <1% of pixels, then it is considered to be noise-dominated and hence unusable.
| Quadrant | # 1 sec bins | Bins with >0 counts | Bins with >2000 counts | High rate bins dominated by noise | Noise dominated (total time) | Noise dominated (detector-on time) | Marked lightcurve |
|---|---|---|---|---|---|---|---|
| A | 9338 | 5395 | 241 | 241 | 2.58% | 4.47% | 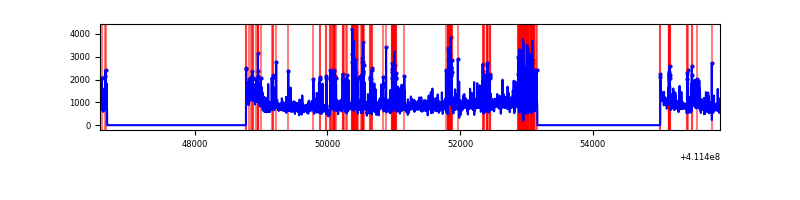 |
| B | 9338 | 5395 | 86 | 86 | 0.92% | 1.59% | 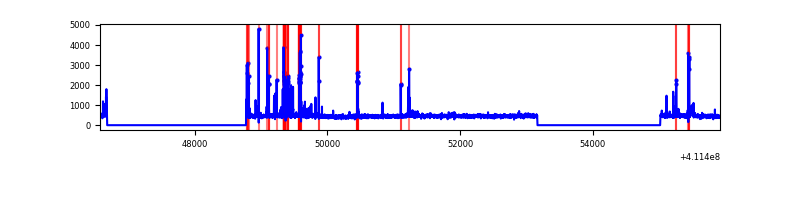 |
| C | 9338 | 5395 | 126 | 126 | 1.35% | 2.34% | 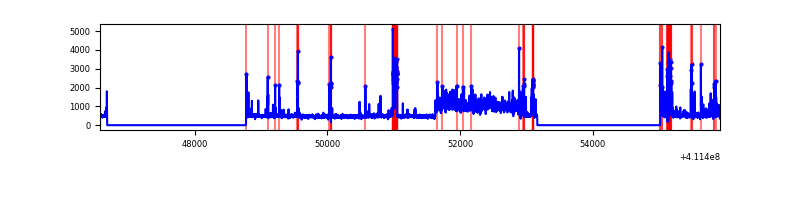 |
| D | 9338 | 5395 | 127 | 127 | 1.36% | 2.35% | 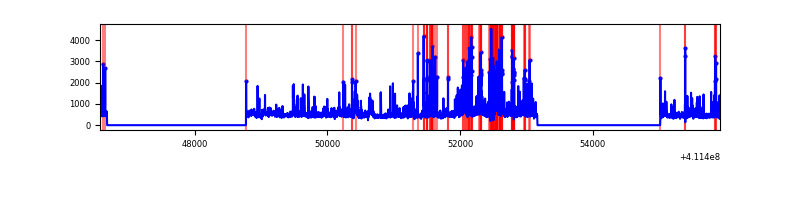 |
Top three noisy pixels from each quadrant. If the there are fewer than three noisy pixels in the level2.evt file, extra rows are filled as -1
| Pixel properties | Quadrant properties | ||||||
|---|---|---|---|---|---|---|---|
| Quadrant | DetID | PixID | Counts | Sigma | Mean | Median | Sigma |
| A | 15 | 222 | 2432872 | 20102.66 | 594 | 581 | 121.0 |
| A | 10 | 83 | 437895 | 3614.36 | 594 | 581 | 121.0 |
| A | 15 | 174 | 156456 | 1288.29 | 594 | 581 | 121.0 |
| B | 5 | 172 | 266674 | 2276.45 | 596 | 579 | 116.9 |
| B | 8 | 3 | 107837 | 917.59 | 596 | 579 | 116.9 |
| B | 12 | 111 | 14959 | 123.02 | 596 | 579 | 116.9 |
| C | 9 | 187 | 967601 | 7090.89 | 583 | 588 | 136.4 |
| C | 15 | 208 | 409500 | 2998.46 | 583 | 588 | 136.4 |
| C | 15 | 214 | 229397 | 1677.81 | 583 | 588 | 136.4 |
| D | 13 | 249 | 365429 | 2533.51 | 583 | 567 | 144.0 |
| D | 2 | 249 | 285473 | 1978.31 | 583 | 567 | 144.0 |
| D | 12 | 227 | 182052 | 1260.18 | 583 | 567 | 144.0 |
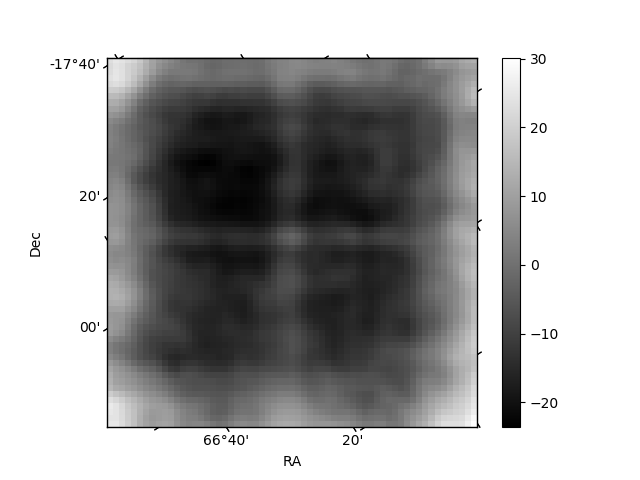
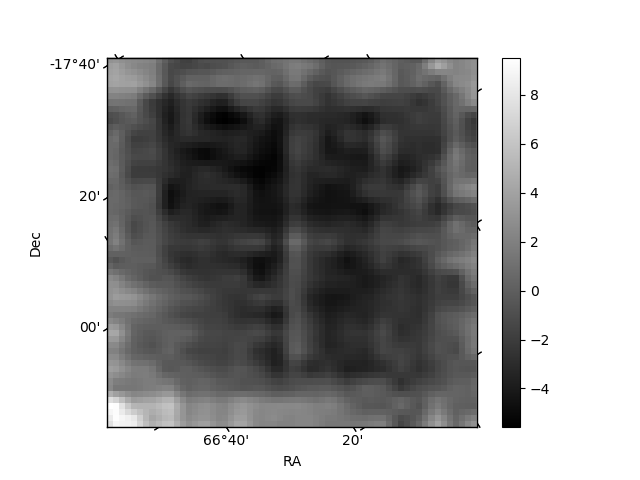
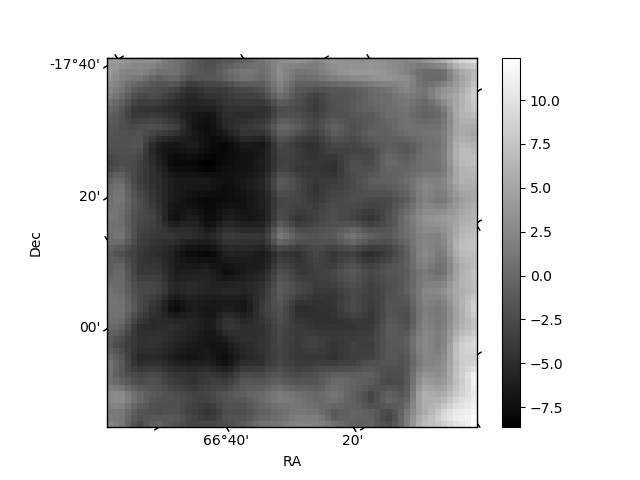
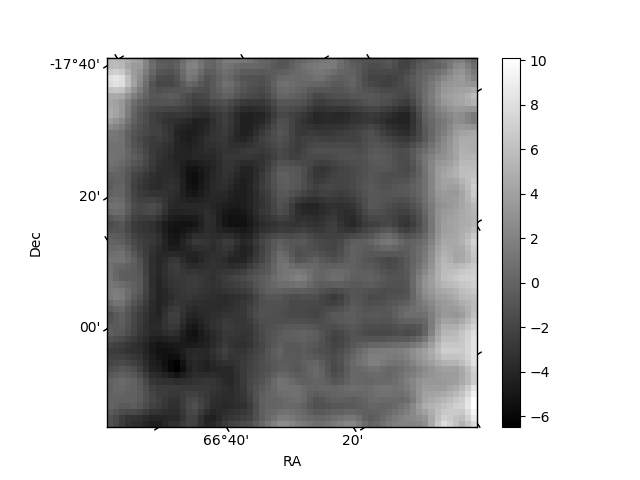
Histogram calculated using DETX and DETY for each event in the final _common_clean file
| Quadrant A | 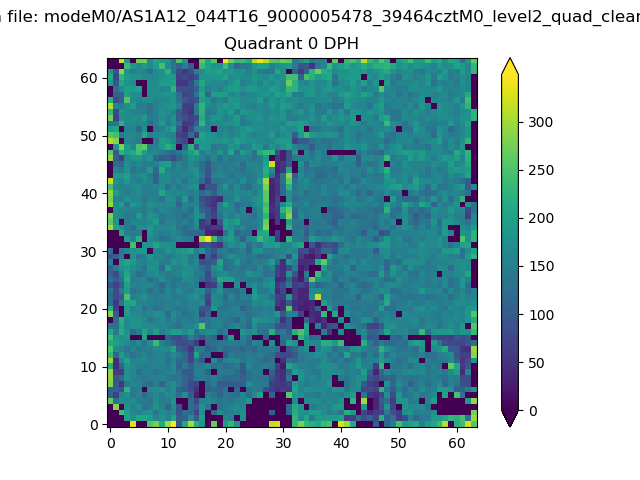 |
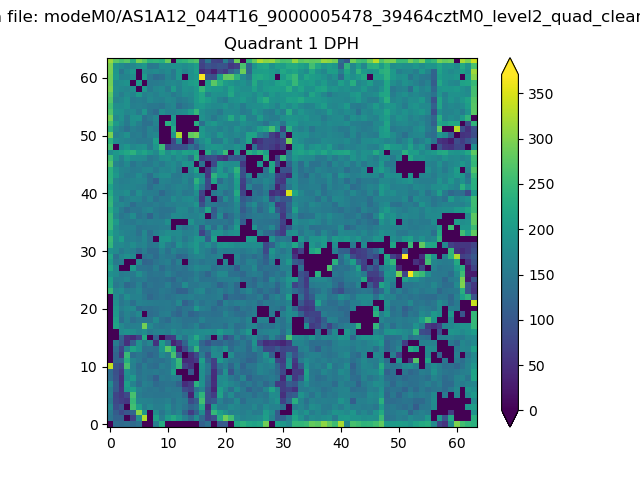 |
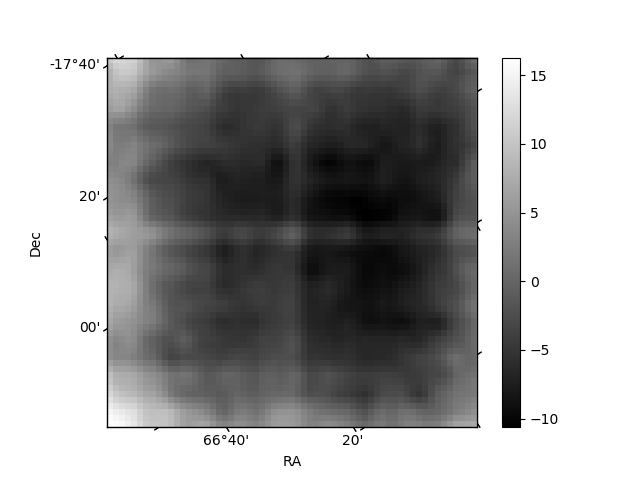
Quadrant B |
|---|---|---|---|
| Quadrant D | 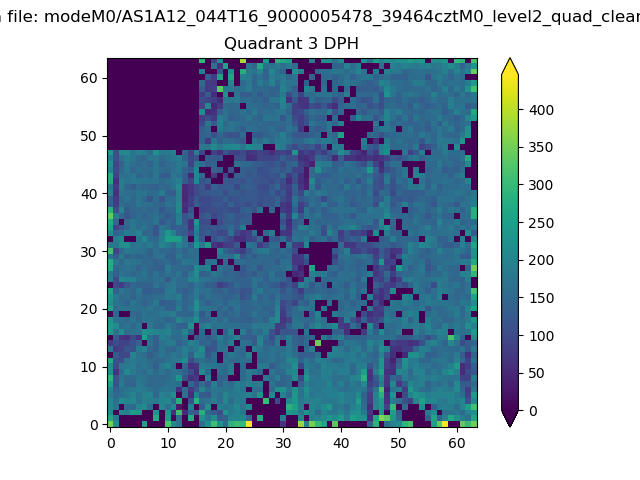 |
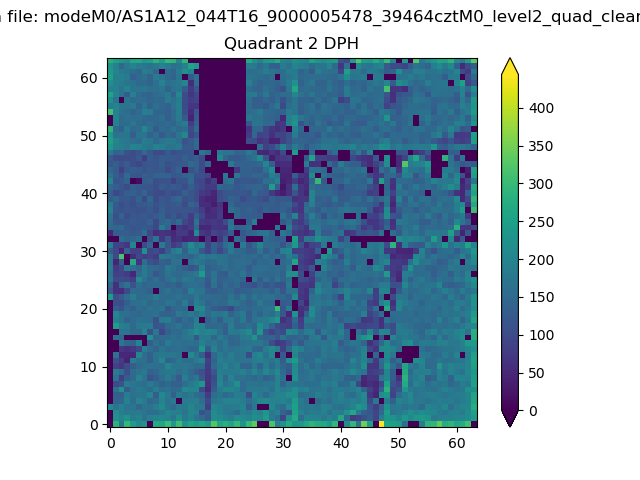 |
Quadrant C |
| Plot type | Count rate plots | Images |
|---|---|---|
| Comparison with Poisson distribution Blue bars denote a histogram of data divided into 1 sec bins. Red curve is a Poisson curve with rate = median count rate of data. |
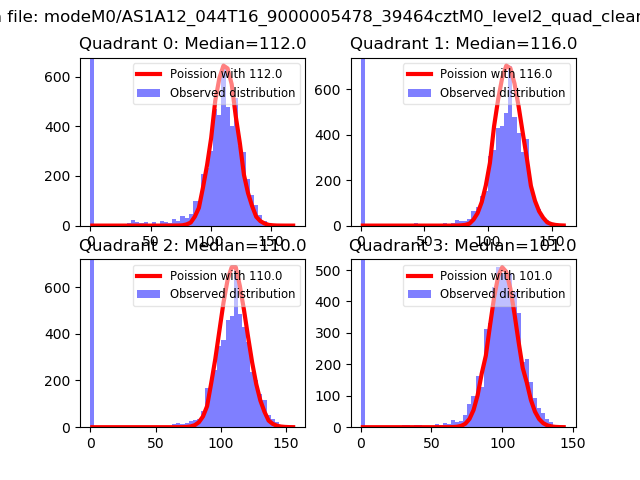 |
 |
| Quadrant-wise count rates Data is divided into 100 sec bins |
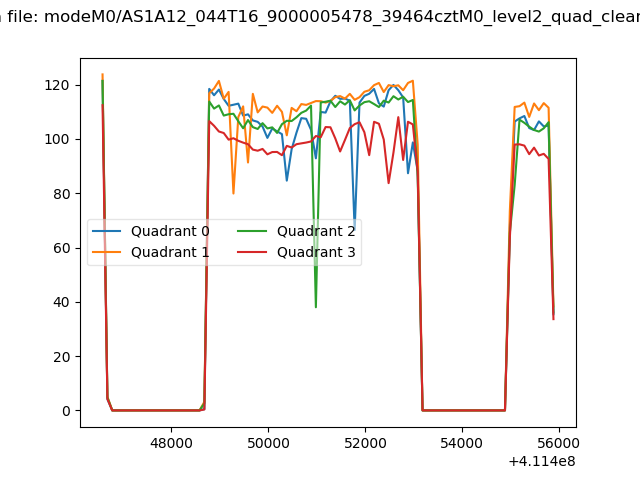 |
|
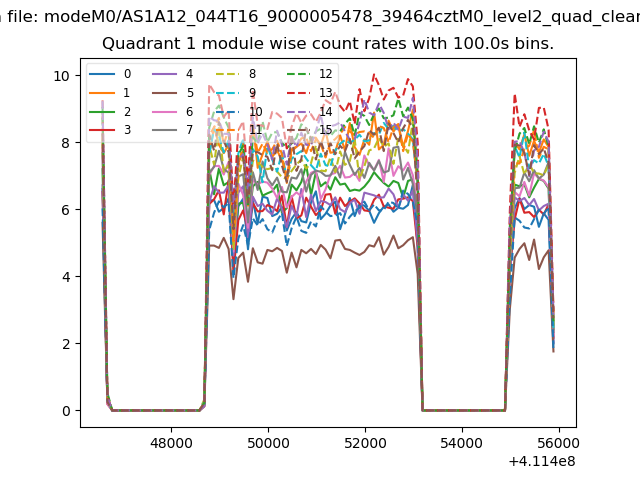
| Module-wise count rates for Quadrant A Data is divided into 100 sec bins |
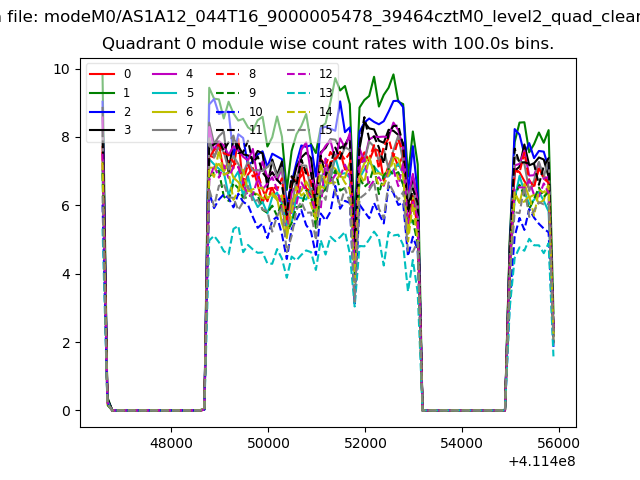 |
 |
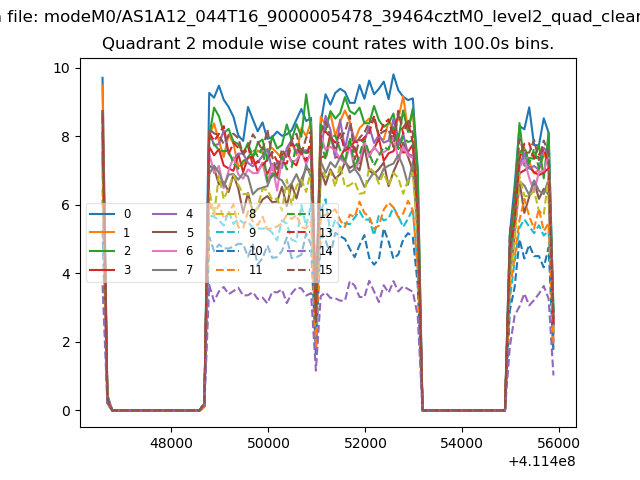
| Module-wise count rates for Quadrant B Data is divided into 100 sec bins |
 |
 |
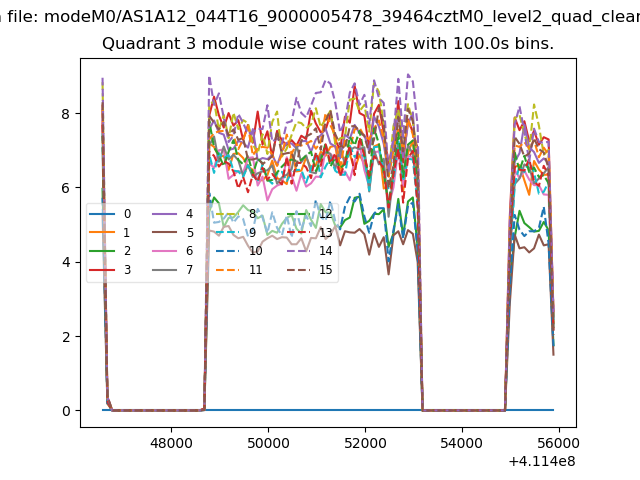
| Module-wise count rates for Quadrant C Data is divided into 100 sec bins |
 |
 |
| Module-wise count rates for Quadrant D Data is divided into 100 sec bins |
 |
 |
| Parameter | Plot |
|---|---|
| CZT HV Monitor | 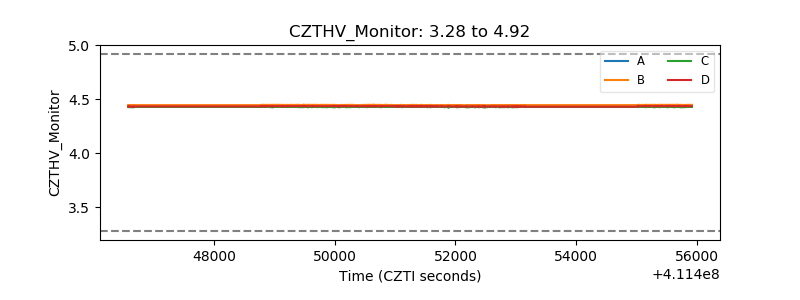 |
| D_VDD | 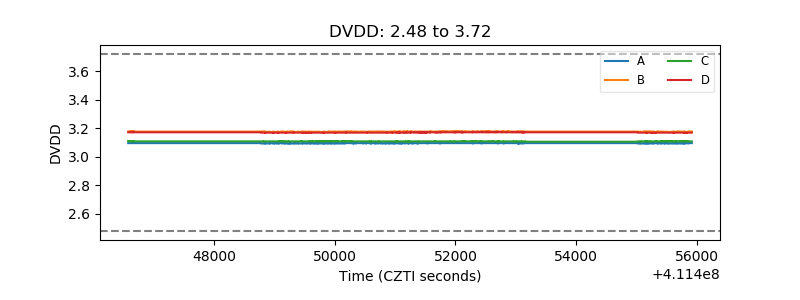 |
| Temperature 1 | 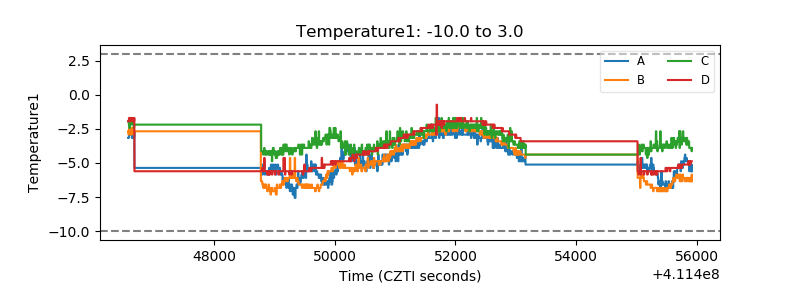 |
| Veto HV Monitor | 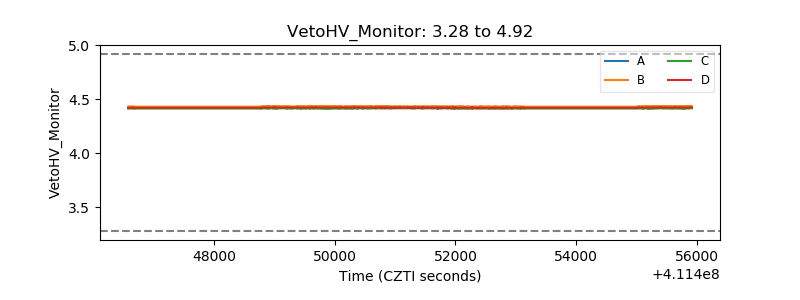 |
| Veto LLD | 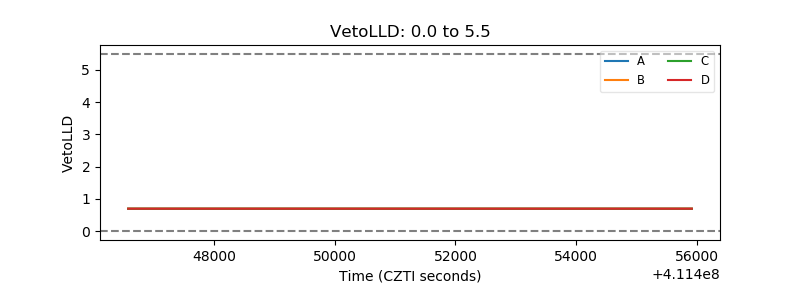 |
| Alpha Counter | 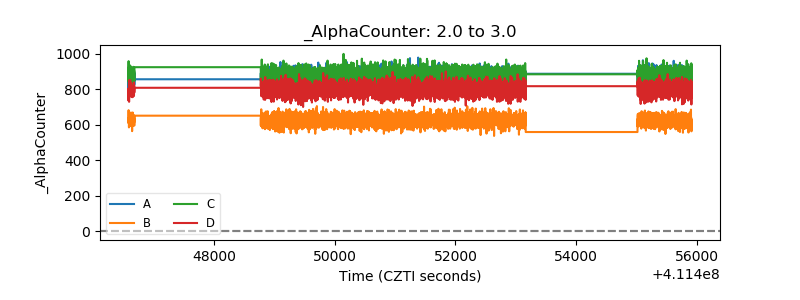 |
| _CPM_Rate | 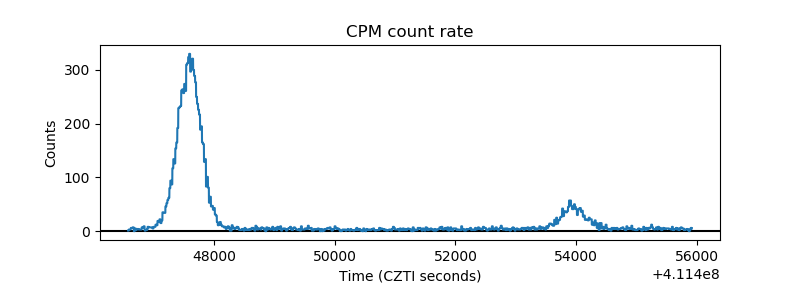 |
| CZT Counter | 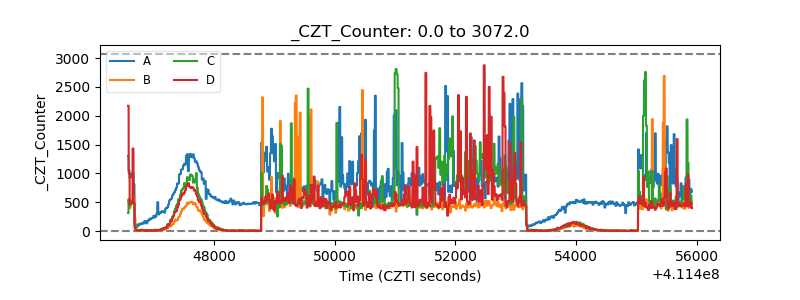 |
| +2.5 Volts monitor | 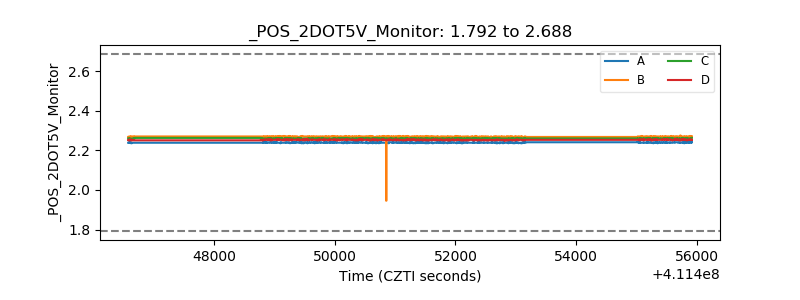 |
| +5 Volts monitor | 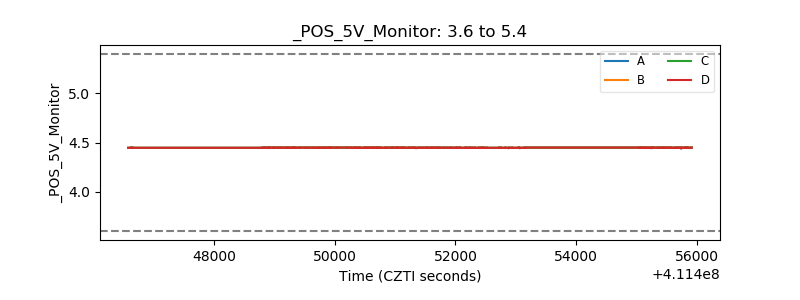 |
| _ROLL_ROT | 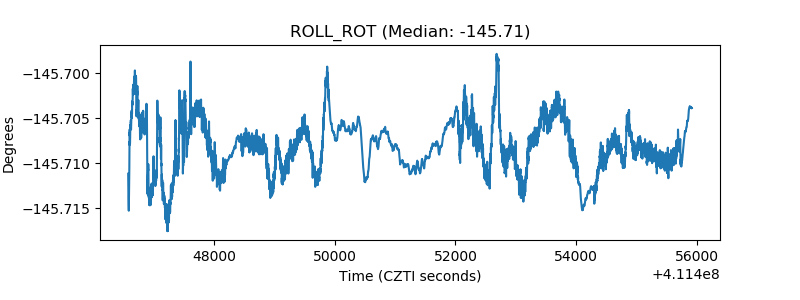 |
| _Roll_DEC | 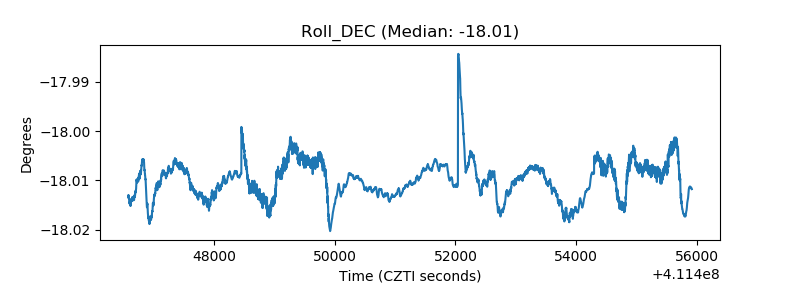 |
| _Roll_RA | 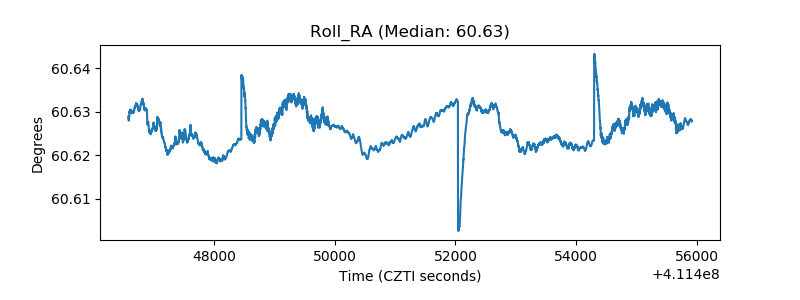 |
| Veto Counter | 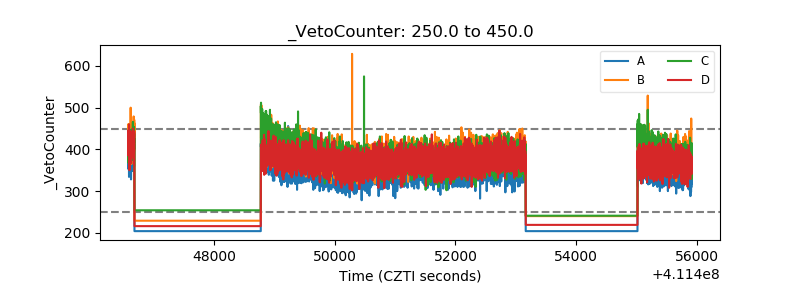 |