| Param | Original file | Final file |
|---|---|---|
| Filename | modeM0/AS1A12_044T16_9000005478_39465cztM0_level2.fits | modeM0/AS1A12_044T16_9000005478_39465cztM0_level2_quad_clean.evt |
| Size (bytes) | 468,956,160 | 96,140,160 |
| Size | 447.2 MB | 91.7 MB |
| Events in quadrant A | 4,523,326 | 645,675 |
| Events in quadrant B | 3,149,546 | 665,452 |
| Events in quadrant C | 5,515,835 | 596,868 |
| Events in quadrant D | 3,708,114 | 586,444 |
| Mode SS | |||
|---|---|---|---|
| Quadrant | BADHDUFLAG | Total packets | Discarded packets |
| A | 0 | 124 | 0 |
| B | 0 | 124 | 0 |
| C | 0 | 124 | 0 |
| D | 0 | 124 | 0 |
| Mode M0 | |||
|---|---|---|---|
| Quadrant | BADHDUFLAG | Total packets | Discarded packets |
| A | 0 | 17388 | 2 |
| B | 0 | 13449 | 1 |
| C | 0 | 20342 | 1 |
| D | 0 | 15156 | 1 |
| Mode M9 | |||
|---|---|---|---|
| Quadrant | BADHDUFLAG | Total packets | Discarded packets |
| A | 0 | 34 | 0 |
| B | 0 | 34 | 0 |
| C | 0 | 34 | 0 |
| D | 0 | 34 | 0 |
| Quadrant | Total seconds | Saturated seconds | Saturation percentage |
|---|---|---|---|
| A | 5958 | 166 | 2.786170% |
| B | 5958 | 118 | 1.980530% |
| C | 5958 | 630 | 10.574018% |
| D | 5958 | 160 | 2.685465% |
Noise dominated data is calculated using 1-second bins in cleaned event files. If a bin has >2000 counts, and if more than 50% of those come from <1% of pixels, then it is considered to be noise-dominated and hence unusable.
| Quadrant | # 1 sec bins | Bins with >0 counts | Bins with >2000 counts | High rate bins dominated by noise | Noise dominated (total time) | Noise dominated (detector-on time) | Marked lightcurve |
|---|---|---|---|---|---|---|---|
| A | 9334 | 5960 | 115 | 115 | 1.23% | 1.93% | 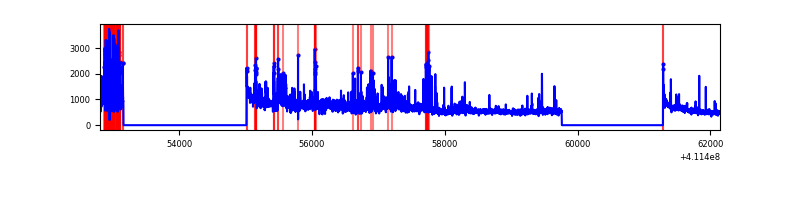 |
| B | 9334 | 5960 | 62 | 62 | 0.66% | 1.04% | 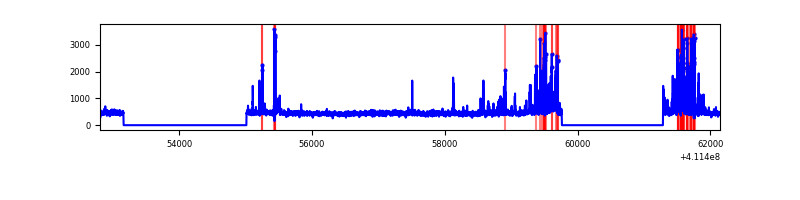 |
| C | 9334 | 5960 | 543 | 543 | 5.82% | 9.11% | 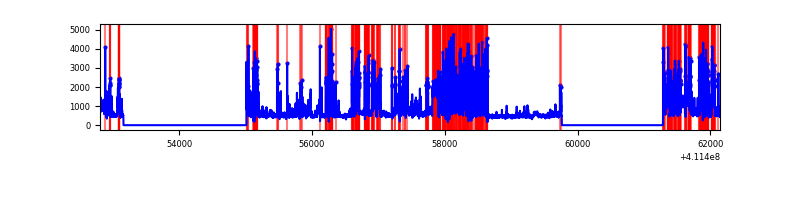 |
| D | 9334 | 5960 | 141 | 141 | 1.51% | 2.37% | 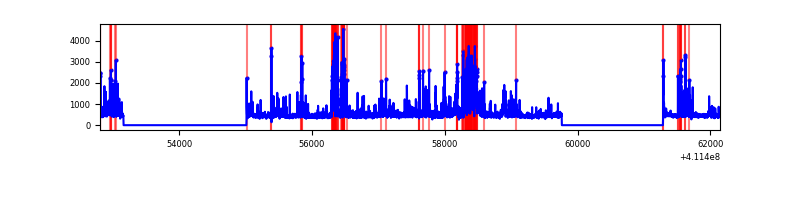 |
Top three noisy pixels from each quadrant. If the there are fewer than three noisy pixels in the level2.evt file, extra rows are filled as -1
| Pixel properties | Quadrant properties | ||||||
|---|---|---|---|---|---|---|---|
| Quadrant | DetID | PixID | Counts | Sigma | Mean | Median | Sigma |
| A | 15 | 222 | 1327907 | 9980.12 | 655 | 641 | 133.0 |
| A | 10 | 83 | 461516 | 3465.46 | 655 | 641 | 133.0 |
| A | 15 | 174 | 115494 | 863.61 | 655 | 641 | 133.0 |
| B | 5 | 255 | 349514 | 2732.68 | 654 | 635 | 127.7 |
| B | 8 | 3 | 204754 | 1598.81 | 654 | 635 | 127.7 |
| B | 0 | 230 | 17298 | 130.52 | 654 | 635 | 127.7 |
| C | 15 | 208 | 2746502 | 18846.95 | 622 | 626 | 145.7 |
| C | 15 | 214 | 242369 | 1659.26 | 622 | 626 | 145.7 |
| C | 9 | 187 | 95362 | 650.24 | 622 | 626 | 145.7 |
| D | 2 | 249 | 575452 | 3685.44 | 638 | 620 | 156.0 |
| D | 12 | 227 | 315478 | 2018.66 | 638 | 620 | 156.0 |
| D | 13 | 249 | 123998 | 791.02 | 638 | 620 | 156.0 |
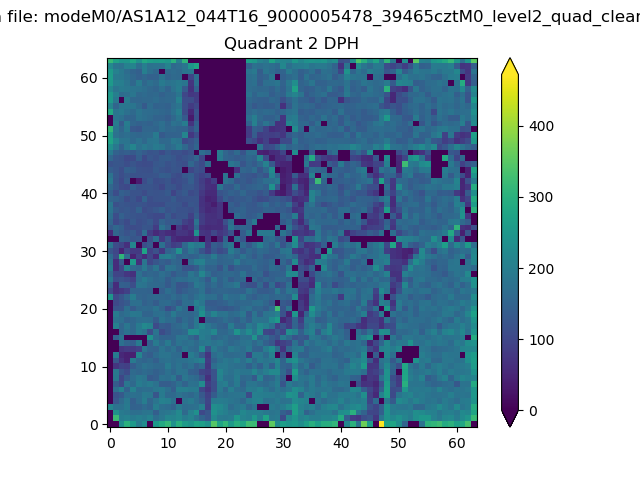
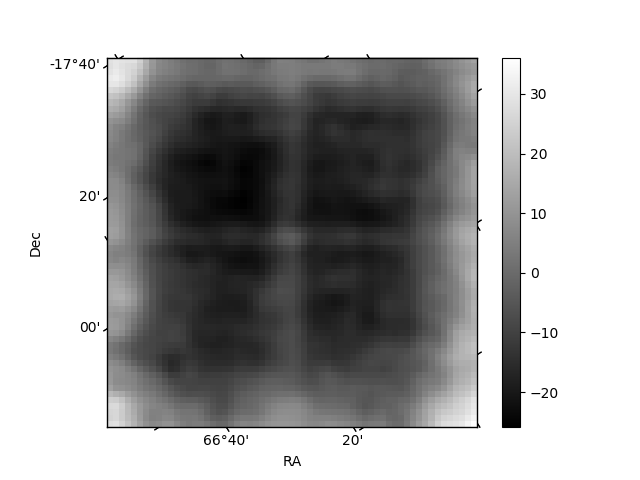
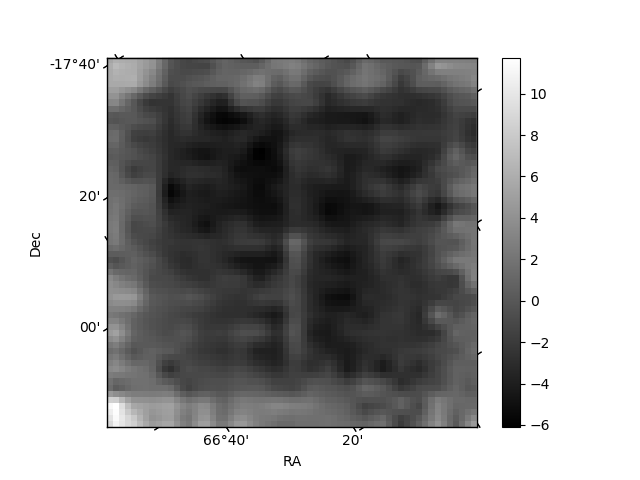
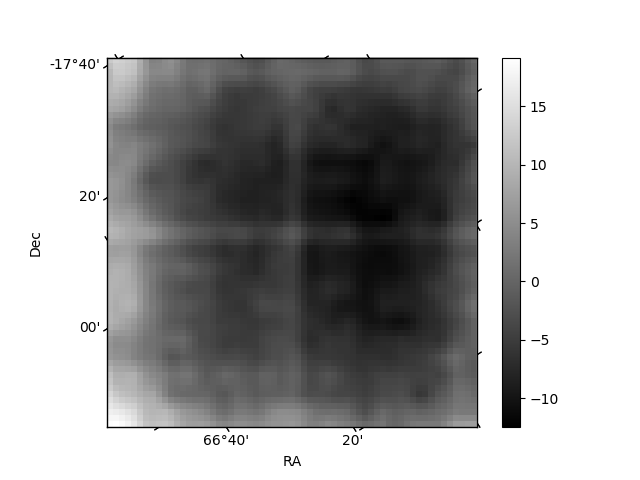
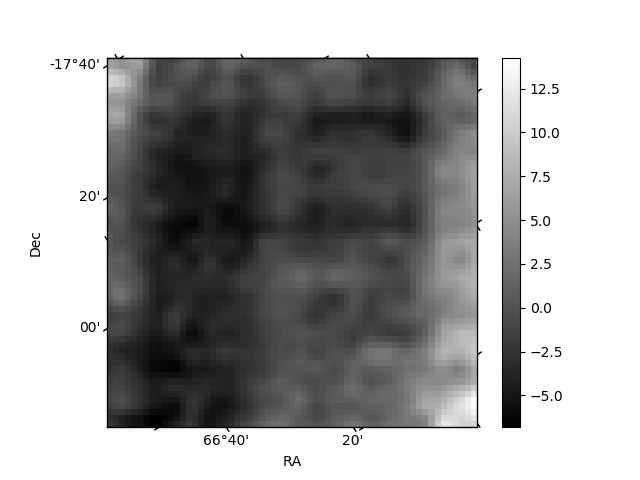
Histogram calculated using DETX and DETY for each event in the final _common_clean file
| Quadrant A | 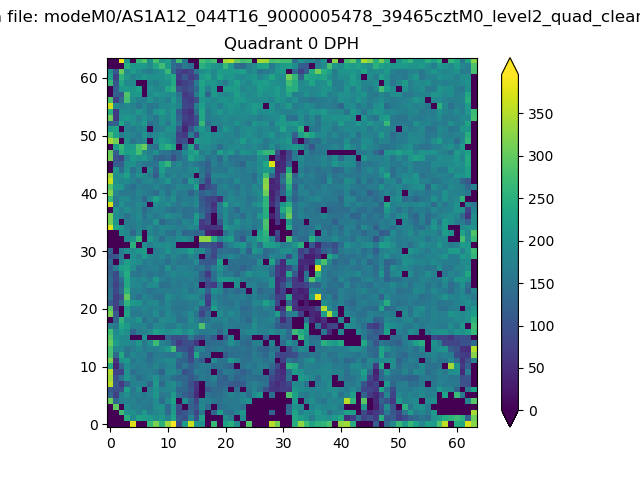 |
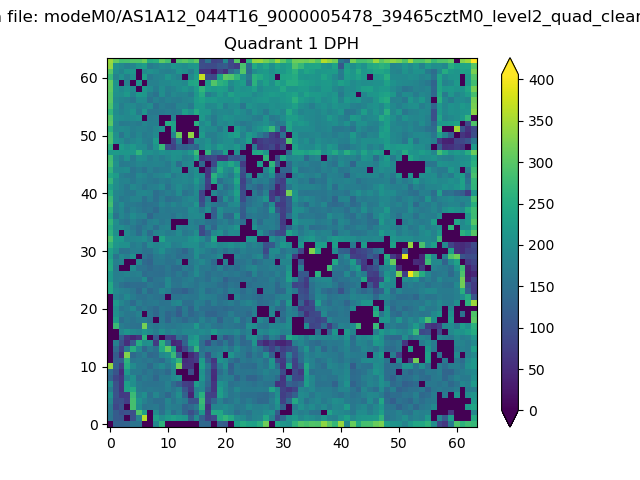 |
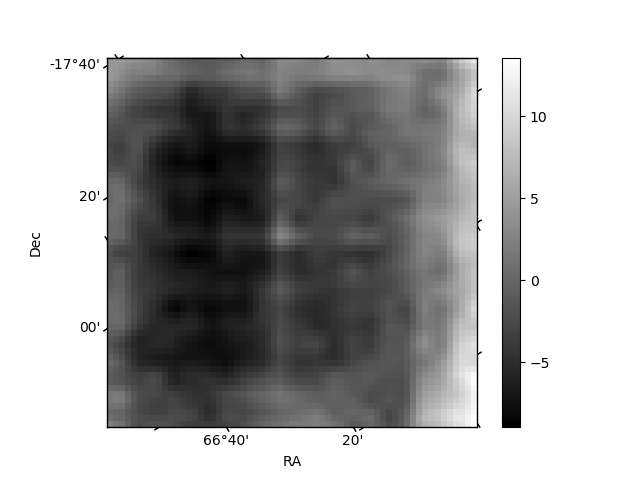
Quadrant B |
|---|---|---|---|
| Quadrant D | 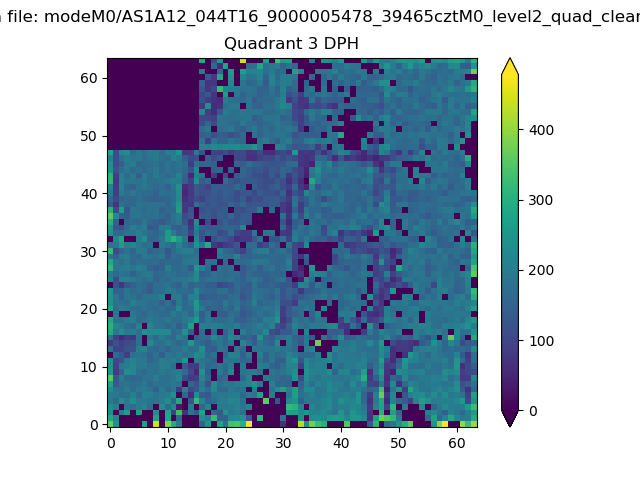 |
 |
Quadrant C |
| Plot type | Count rate plots | Images |
|---|---|---|
| Comparison with Poisson distribution Blue bars denote a histogram of data divided into 1 sec bins. Red curve is a Poisson curve with rate = median count rate of data. |
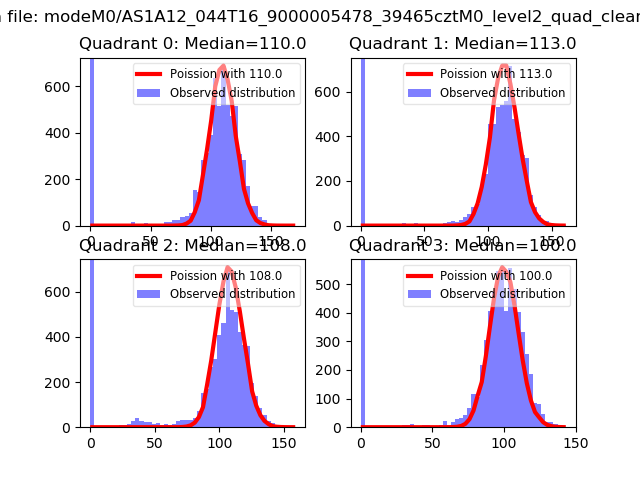 |
 |
| Quadrant-wise count rates Data is divided into 100 sec bins |
 |
|
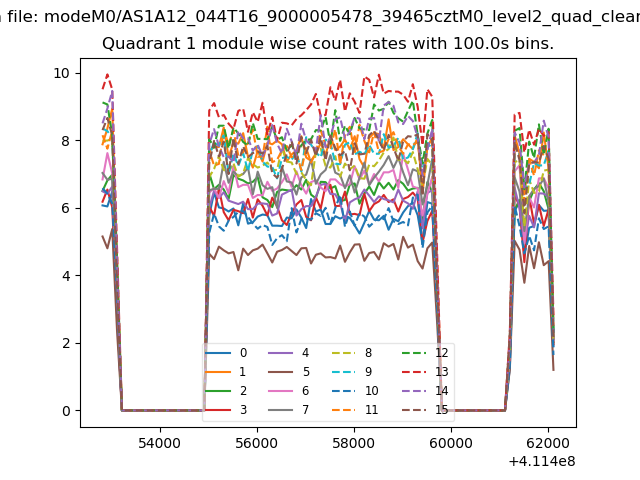
| Module-wise count rates for Quadrant A Data is divided into 100 sec bins |
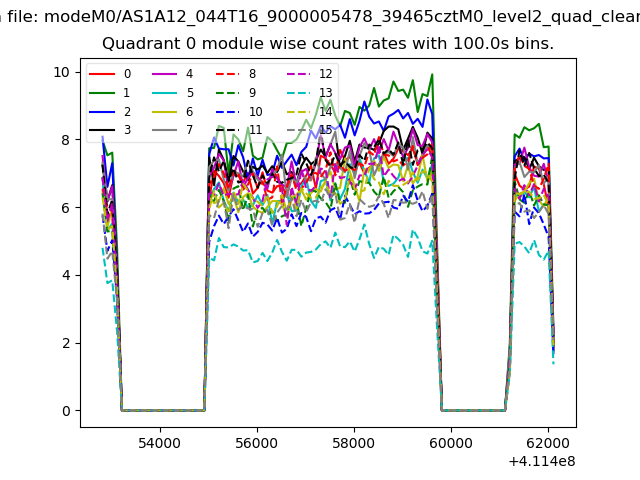 |
 |
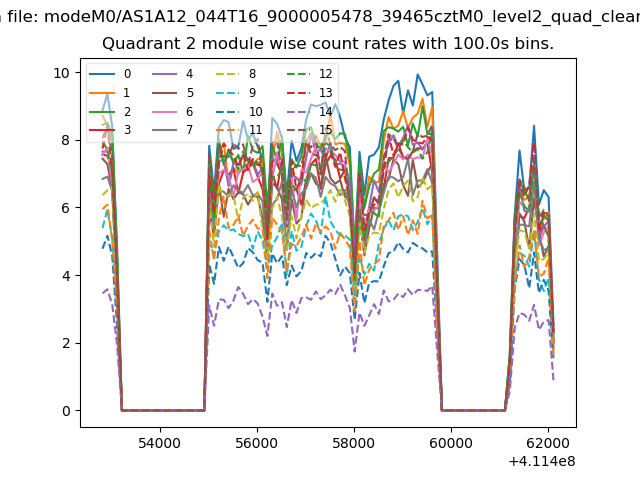
| Module-wise count rates for Quadrant B Data is divided into 100 sec bins |
 |
 |
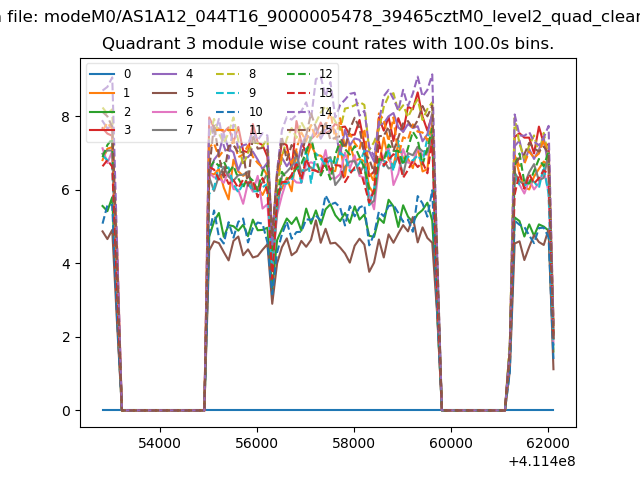
| Module-wise count rates for Quadrant C Data is divided into 100 sec bins |
 |
 |
| Module-wise count rates for Quadrant D Data is divided into 100 sec bins |
 |
 |
| Parameter | Plot |
|---|---|
| CZT HV Monitor | 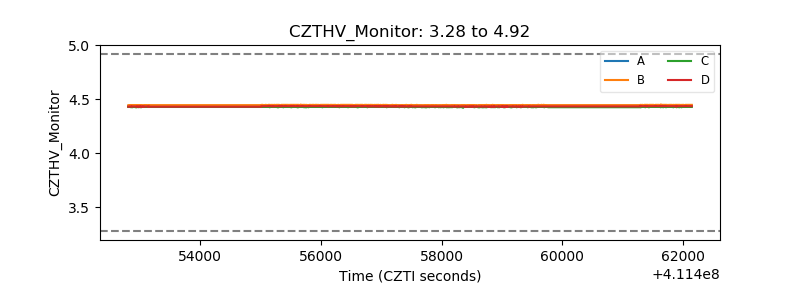 |
| D_VDD | 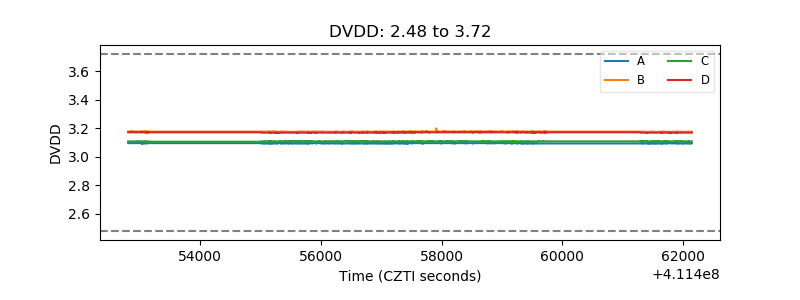 |
| Temperature 1 |  |
| Veto HV Monitor | 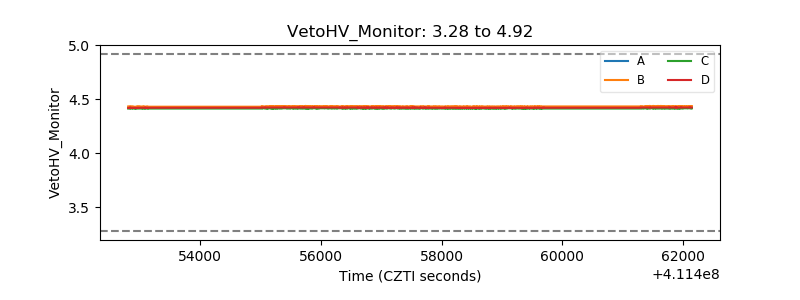 |
| Veto LLD | 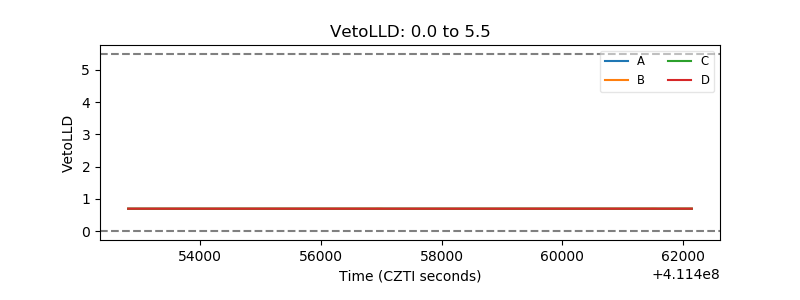 |
| Alpha Counter | 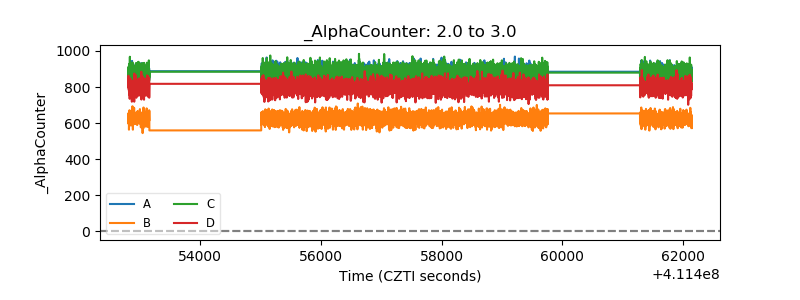 |
| _CPM_Rate | 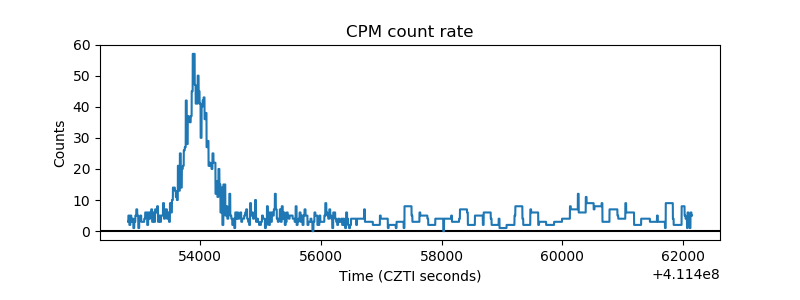 |
| CZT Counter |  |
| +2.5 Volts monitor | 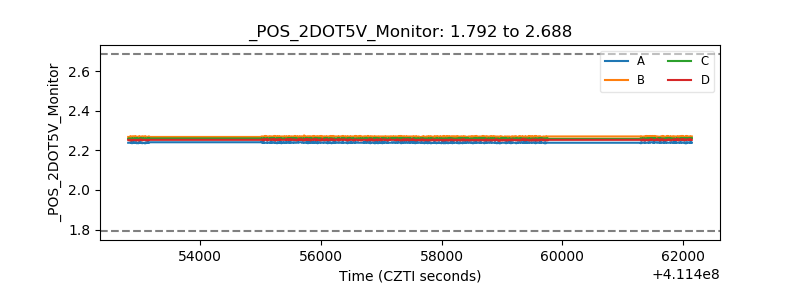 |
| +5 Volts monitor |  |
| _ROLL_ROT | 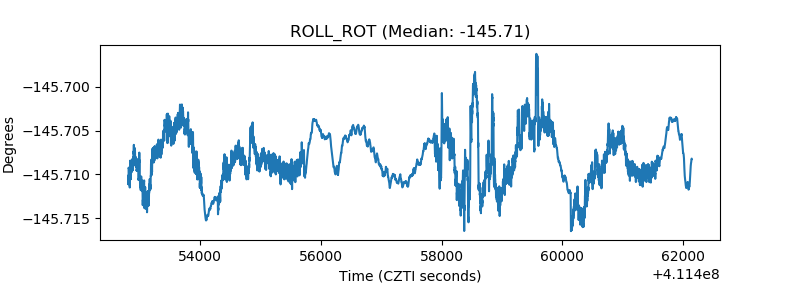 |
| _Roll_DEC | 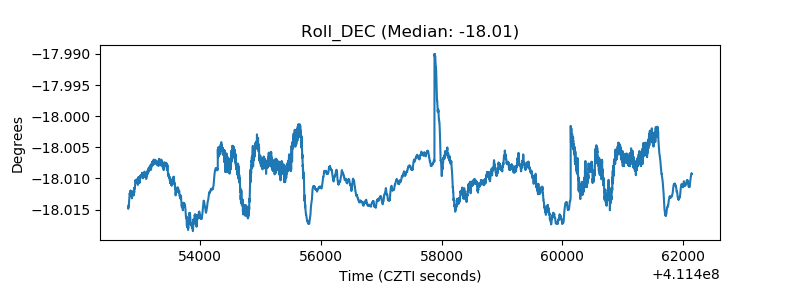 |
| _Roll_RA | 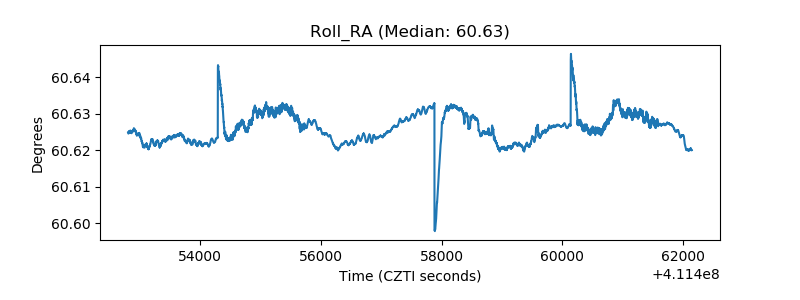 |
| Veto Counter | 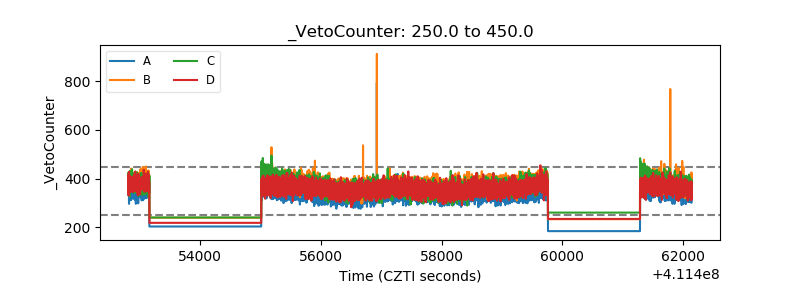 |