| Param | Original file | Final file |
|---|---|---|
| Filename | modeM0/AS1A12_044T16_9000005478_39466cztM0_level2.fits | modeM0/AS1A12_044T16_9000005478_39466cztM0_level2_quad_clean.evt |
| Size (bytes) | 439,934,400 | 100,598,400 |
| Size | 419.6 MB | 95.9 MB |
| Events in quadrant A | 3,311,603 | 682,080 |
| Events in quadrant B | 3,709,825 | 685,004 |
| Events in quadrant C | 5,293,925 | 625,807 |
| Events in quadrant D | 3,484,578 | 617,729 |
| Mode SS | |||
|---|---|---|---|
| Quadrant | BADHDUFLAG | Total packets | Discarded packets |
| A | 0 | 128 | 0 |
| B | 0 | 128 | 0 |
| C | 0 | 128 | 0 |
| D | 0 | 128 | 0 |
| Mode M0 | |||
|---|---|---|---|
| Quadrant | BADHDUFLAG | Total packets | Discarded packets |
| A | 0 | 13658 | 3 |
| B | 0 | 15162 | 2 |
| C | 0 | 19758 | 2 |
| D | 0 | 14628 | 2 |
| Mode M9 | |||
|---|---|---|---|
| Quadrant | BADHDUFLAG | Total packets | Discarded packets |
| A | 0 | 29 | 0 |
| B | 0 | 29 | 0 |
| C | 0 | 29 | 0 |
| D | 0 | 29 | 0 |
| Quadrant | Total seconds | Saturated seconds | Saturation percentage |
|---|---|---|---|
| A | 6239 | 22 | 0.352621% |
| B | 6239 | 176 | 2.820965% |
| C | 6239 | 609 | 9.761180% |
| D | 6239 | 116 | 1.859272% |
Noise dominated data is calculated using 1-second bins in cleaned event files. If a bin has >2000 counts, and if more than 50% of those come from <1% of pixels, then it is considered to be noise-dominated and hence unusable.
| Quadrant | # 1 sec bins | Bins with >0 counts | Bins with >2000 counts | High rate bins dominated by noise | Noise dominated (total time) | Noise dominated (detector-on time) | Marked lightcurve |
|---|---|---|---|---|---|---|---|
| A | 9106 | 6241 | 7 | 7 | 0.08% | 0.11% | 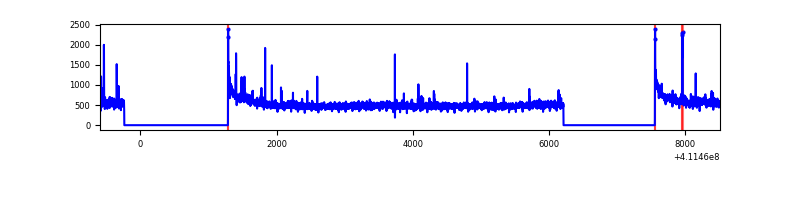 |
| B | 9106 | 6241 | 105 | 105 | 1.15% | 1.68% | 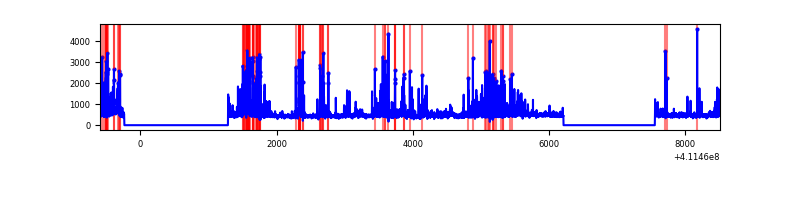 |
| C | 9106 | 6241 | 481 | 481 | 5.28% | 7.71% | 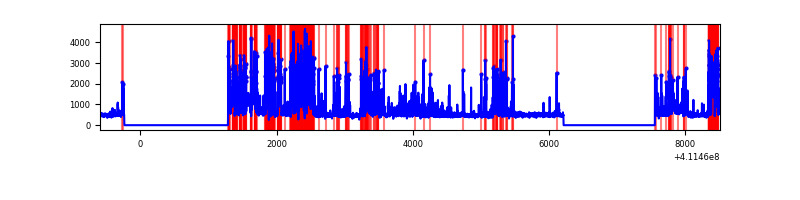 |
| D | 9106 | 6241 | 76 | 76 | 0.83% | 1.22% | 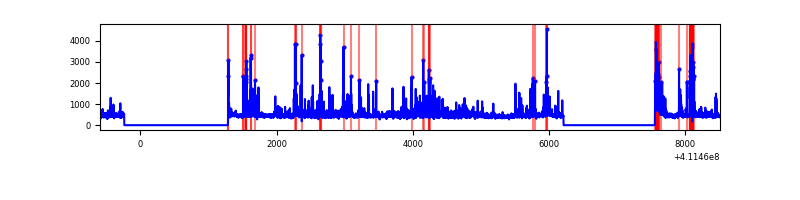 |
Top three noisy pixels from each quadrant. If the there are fewer than three noisy pixels in the level2.evt file, extra rows are filled as -1
| Pixel properties | Quadrant properties | ||||||
|---|---|---|---|---|---|---|---|
| Quadrant | DetID | PixID | Counts | Sigma | Mean | Median | Sigma |
| A | 10 | 83 | 469647 | 3342.27 | 692 | 678 | 140.3 |
| A | 15 | 222 | 103959 | 736.07 | 692 | 678 | 140.3 |
| A | 15 | 174 | 26483 | 183.91 | 692 | 678 | 140.3 |
| B | 5 | 255 | 826217 | 6218.13 | 682 | 663 | 132.8 |
| B | 8 | 3 | 160948 | 1207.28 | 682 | 663 | 132.8 |
| B | 12 | 111 | 17275 | 125.12 | 682 | 663 | 132.8 |
| C | 15 | 208 | 2464906 | 16138.11 | 650 | 654 | 152.7 |
| C | 15 | 214 | 253774 | 1657.65 | 650 | 654 | 152.7 |
| C | 9 | 187 | 31137 | 199.63 | 650 | 654 | 152.7 |
| D | 2 | 249 | 402606 | 2437.13 | 671 | 652 | 164.9 |
| D | 2 | 153 | 160231 | 967.56 | 671 | 652 | 164.9 |
| D | 12 | 227 | 154945 | 935.51 | 671 | 652 | 164.9 |
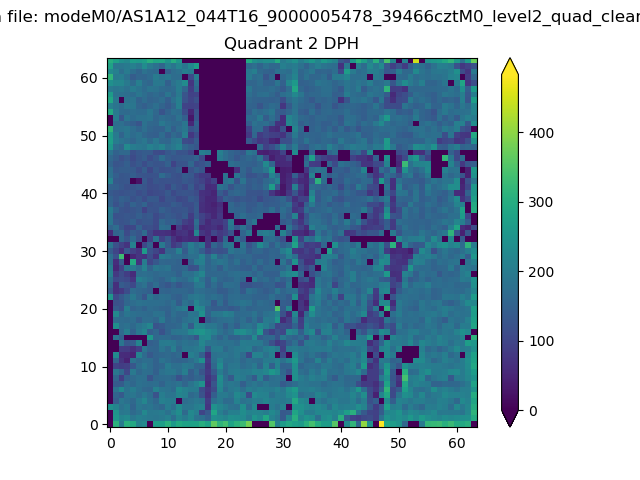
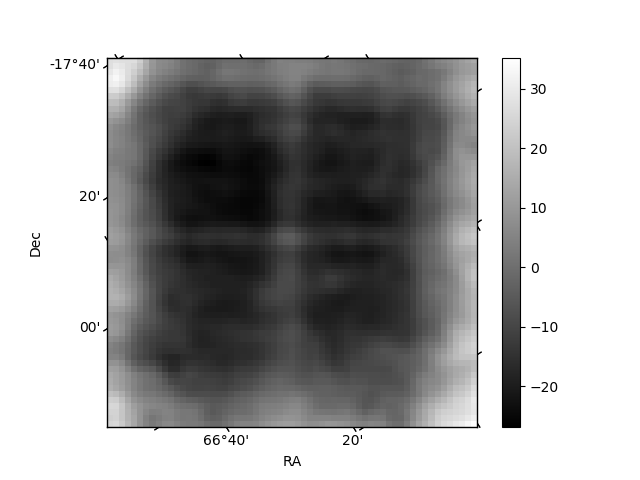
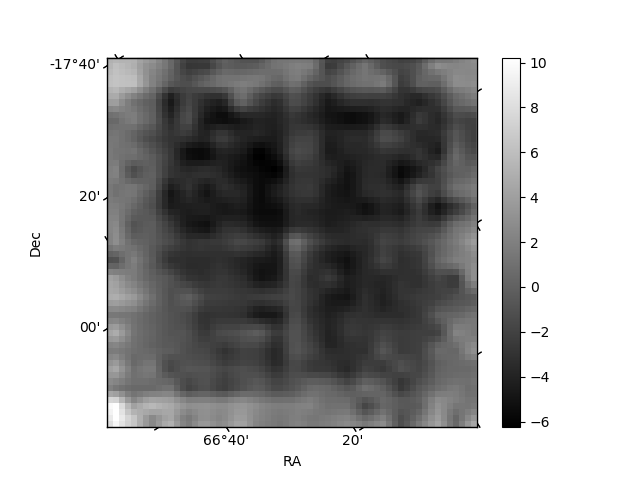
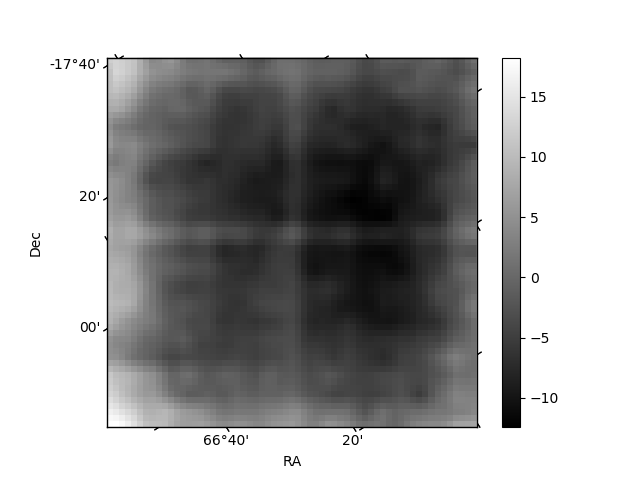
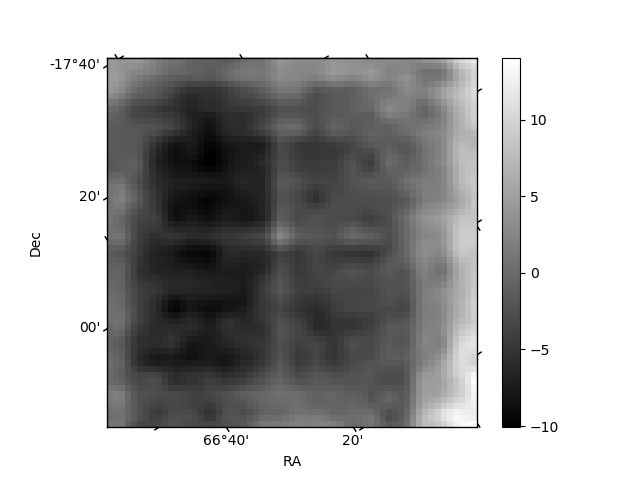
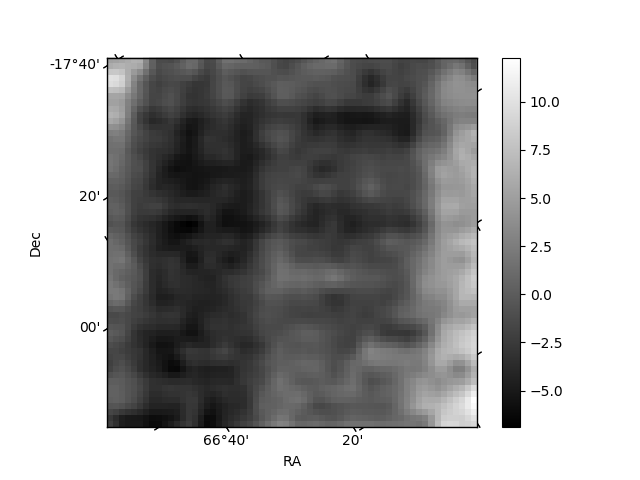
Histogram calculated using DETX and DETY for each event in the final _common_clean file
| Quadrant A | 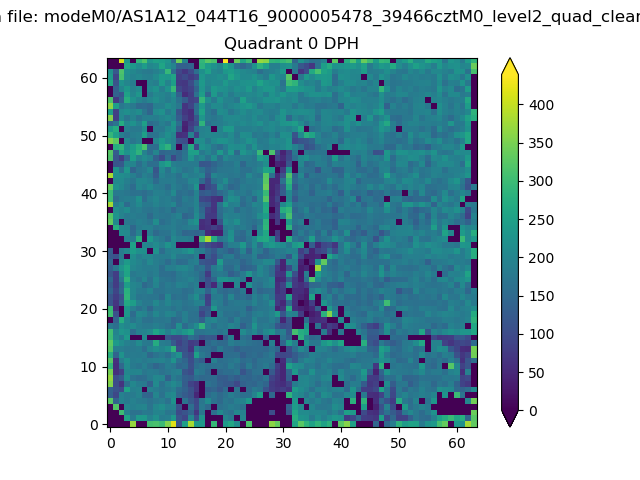 |
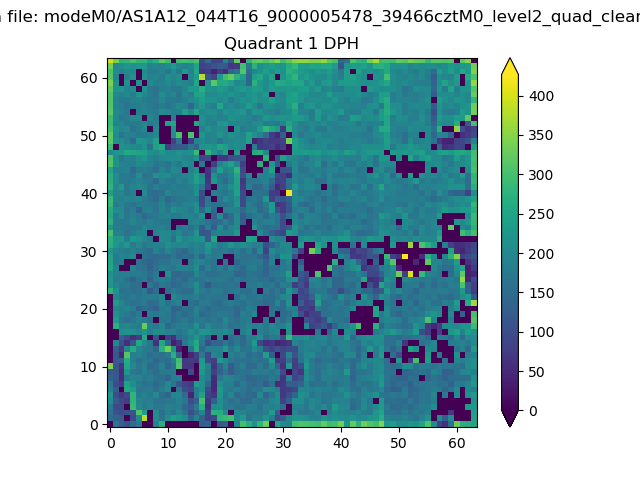 |
Quadrant B |
|---|---|---|---|
| Quadrant D | 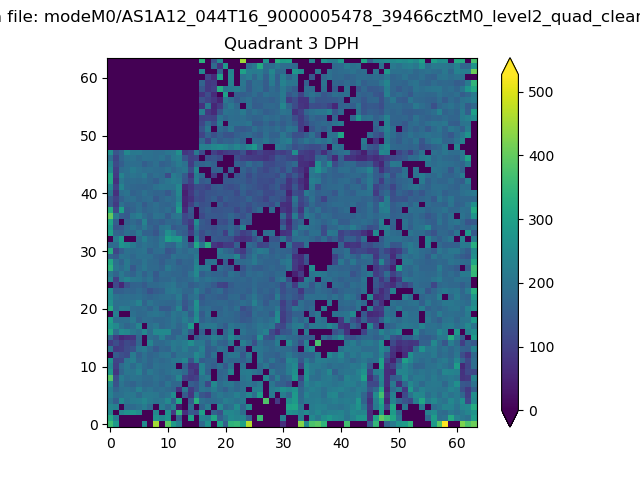 |
 |
Quadrant C |
| Plot type | Count rate plots | Images |
|---|---|---|
| Comparison with Poisson distribution Blue bars denote a histogram of data divided into 1 sec bins. Red curve is a Poisson curve with rate = median count rate of data. |
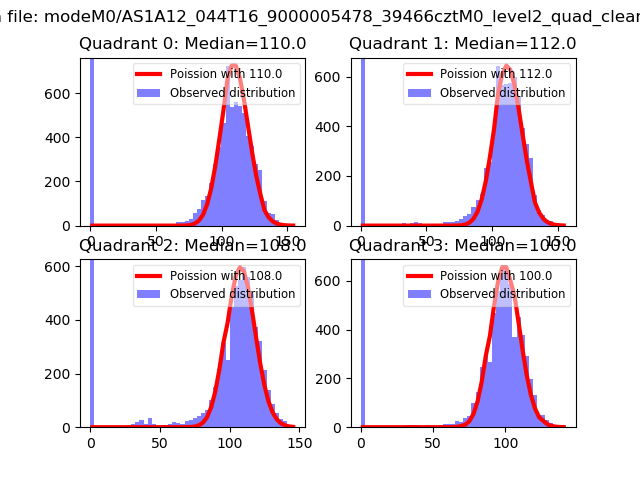 |
 |
| Quadrant-wise count rates Data is divided into 100 sec bins |
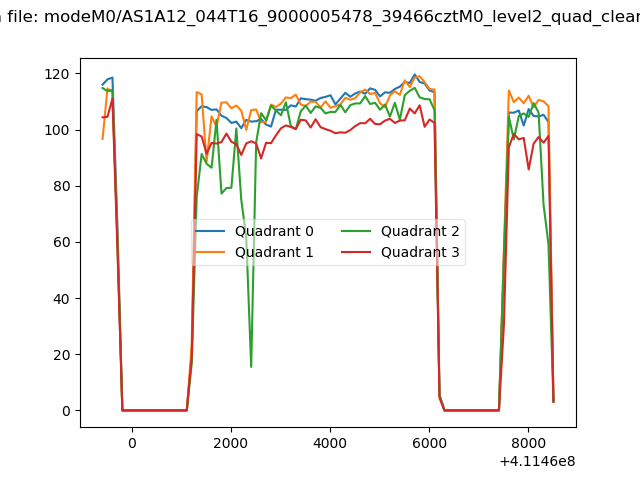 |
|
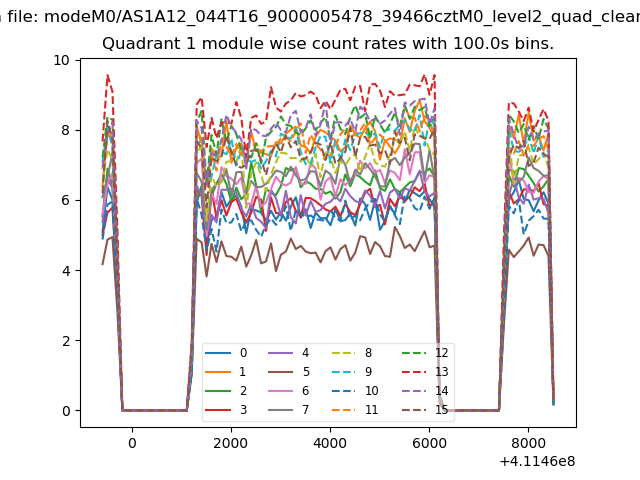
| Module-wise count rates for Quadrant A Data is divided into 100 sec bins |
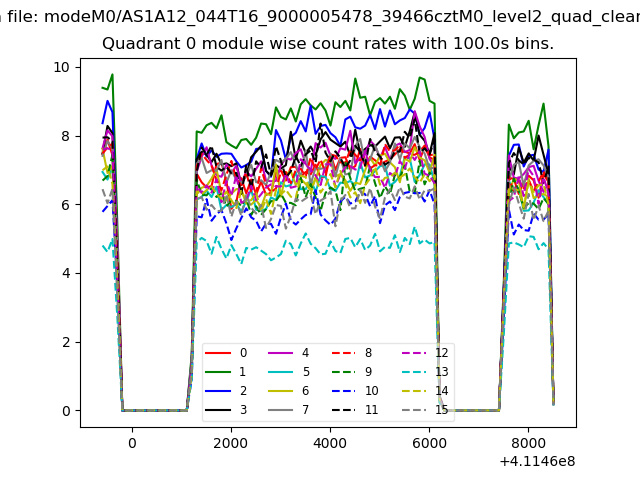 |
 |
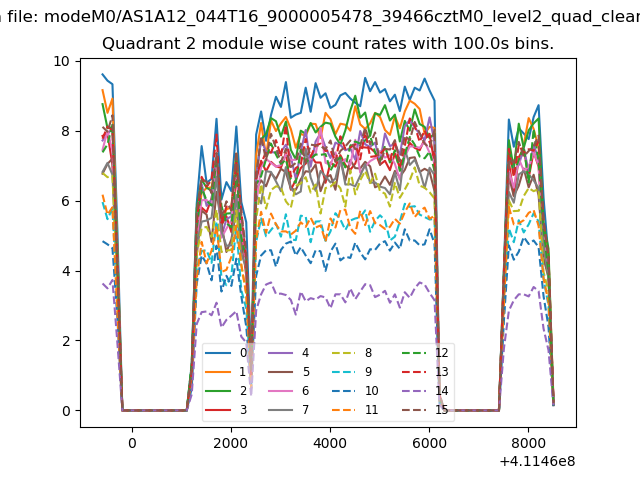
| Module-wise count rates for Quadrant B Data is divided into 100 sec bins |
 |
 |
| Module-wise count rates for Quadrant C Data is divided into 100 sec bins |
 |
 |
| Module-wise count rates for Quadrant D Data is divided into 100 sec bins |
 |
 |
| Parameter | Plot |
|---|---|
| CZT HV Monitor |  |
| D_VDD | 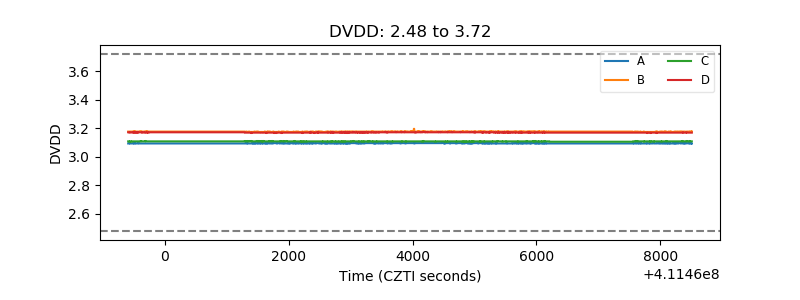 |
| Temperature 1 | 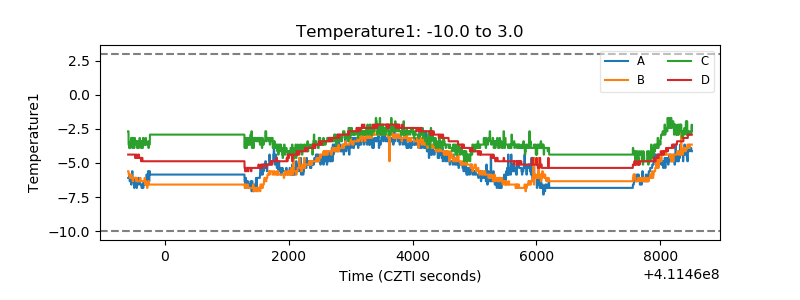 |
| Veto HV Monitor | 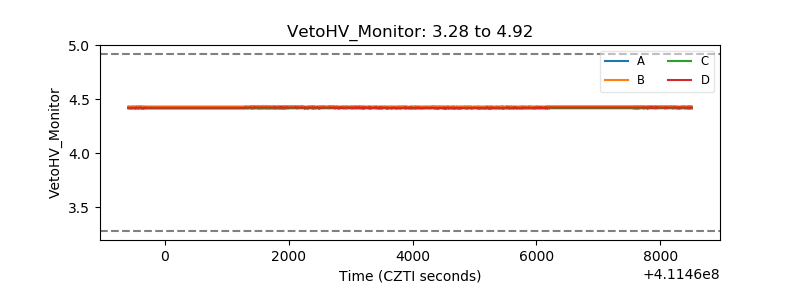 |
| Veto LLD | 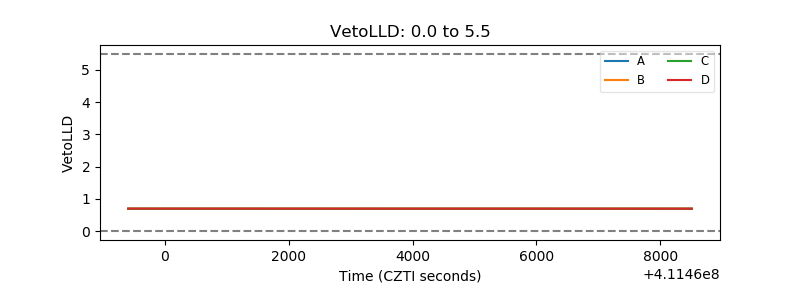 |
| Alpha Counter | 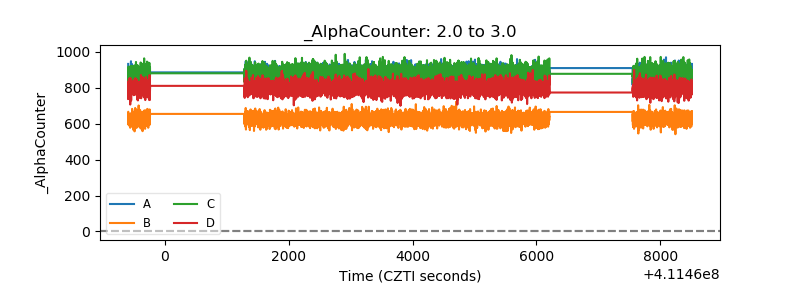 |
| _CPM_Rate | 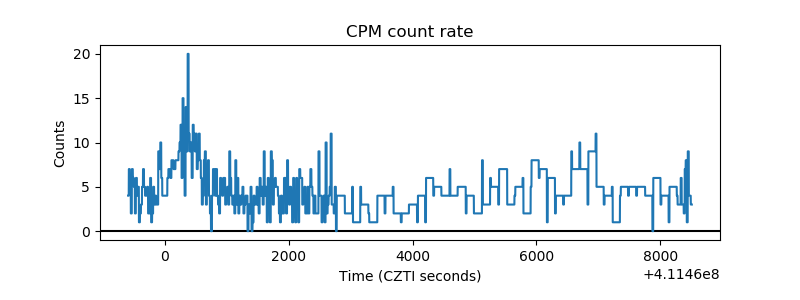 |
| CZT Counter | 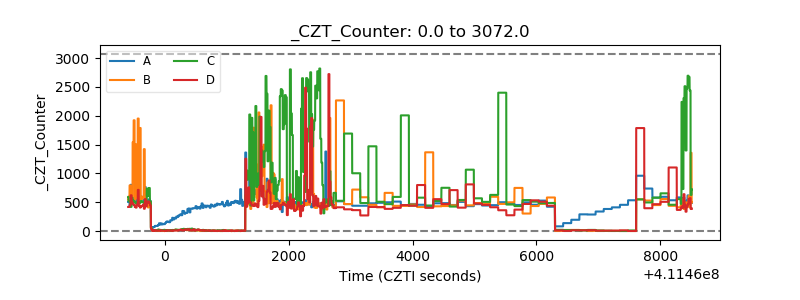 |
| +2.5 Volts monitor | 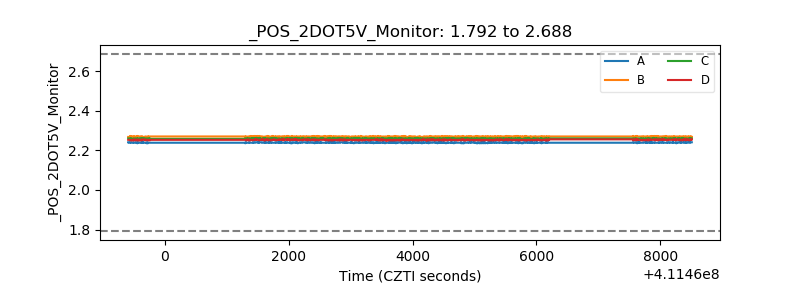 |
| +5 Volts monitor | 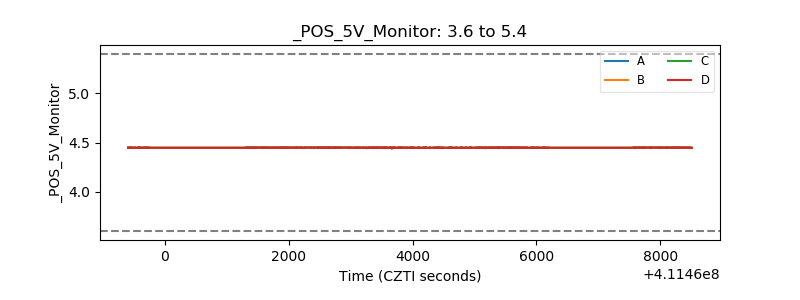 |
| _ROLL_ROT | 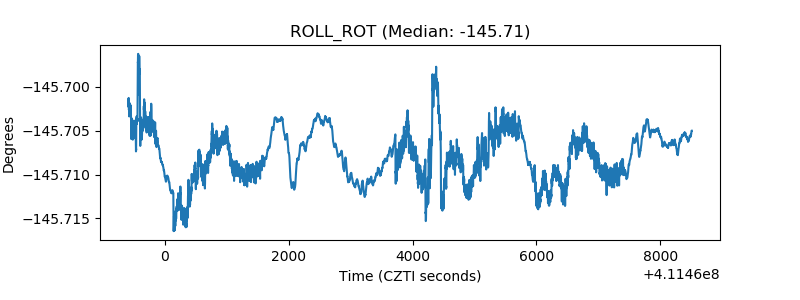 |
| _Roll_DEC | 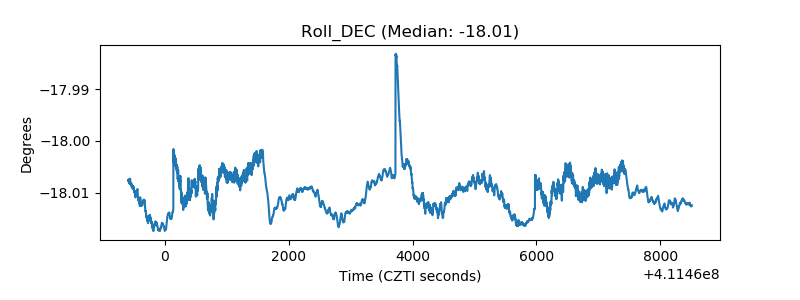 |
| _Roll_RA | 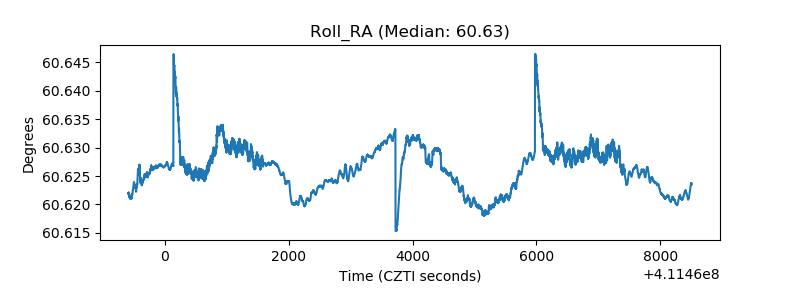 |
| Veto Counter | 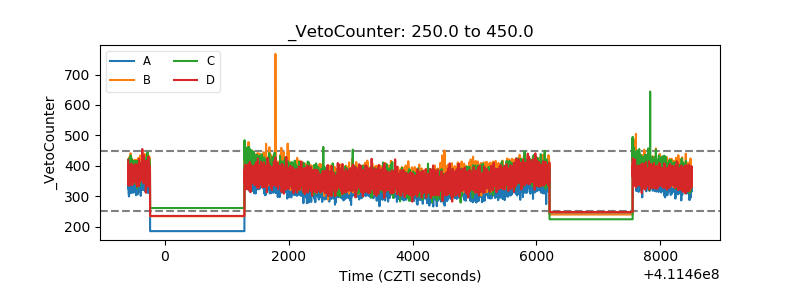 |