| Param | Original file | Final file |
|---|---|---|
| Filename | modeM0/AS1A12_044T16_9000005478_39467cztM0_level2.fits | modeM0/AS1A12_044T16_9000005478_39467cztM0_level2_quad_clean.evt |
| Size (bytes) | 322,796,160 | 70,793,280 |
| Size | 307.8 MB | 67.5 MB |
| Events in quadrant A | 2,648,498 | 477,751 |
| Events in quadrant B | 2,523,453 | 481,470 |
| Events in quadrant C | 3,941,829 | 444,414 |
| Events in quadrant D | 2,492,292 | 430,777 |
| Mode SS | |||
|---|---|---|---|
| Quadrant | BADHDUFLAG | Total packets | Discarded packets |
| A | 0 | 88 | 0 |
| B | 0 | 88 | 0 |
| C | 0 | 88 | 0 |
| D | 0 | 88 | 0 |
| Mode M0 | |||
|---|---|---|---|
| Quadrant | BADHDUFLAG | Total packets | Discarded packets |
| A | 0 | 10448 | 1 |
| B | 0 | 10496 | 1 |
| C | 0 | 14604 | 1 |
| D | 0 | 10496 | 1 |
| Mode M9 | |||
|---|---|---|---|
| Quadrant | BADHDUFLAG | Total packets | Discarded packets |
| A | 0 | 14 | 0 |
| B | 0 | 14 | 0 |
| C | 0 | 14 | 0 |
| D | 0 | 14 | 0 |
| Quadrant | Total seconds | Saturated seconds | Saturation percentage |
|---|---|---|---|
| A | 4400 | 21 | 0.477273% |
| B | 4400 | 109 | 2.477273% |
| C | 4400 | 360 | 8.181818% |
| D | 4400 | 112 | 2.545455% |
Noise dominated data is calculated using 1-second bins in cleaned event files. If a bin has >2000 counts, and if more than 50% of those come from <1% of pixels, then it is considered to be noise-dominated and hence unusable.
| Quadrant | # 1 sec bins | Bins with >0 counts | Bins with >2000 counts | High rate bins dominated by noise | Noise dominated (total time) | Noise dominated (detector-on time) | Marked lightcurve |
|---|---|---|---|---|---|---|---|
| A | 5743 | 4401 | 13 | 13 | 0.23% | 0.30% | 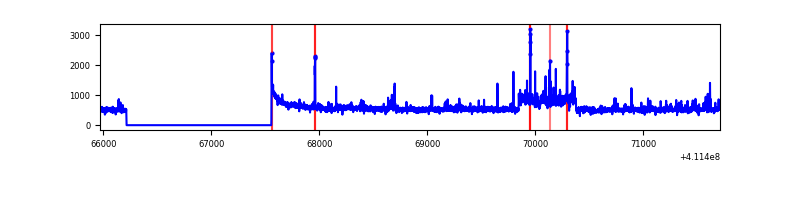 |
| B | 5743 | 4401 | 59 | 59 | 1.03% | 1.34% | 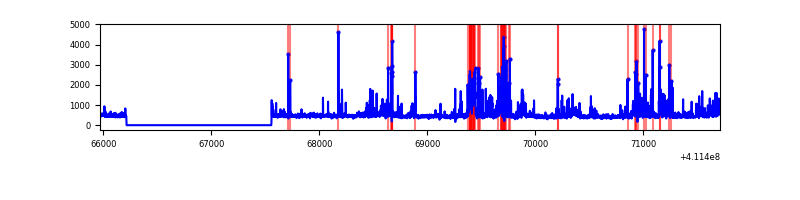 |
| C | 5743 | 4401 | 328 | 328 | 5.71% | 7.45% | 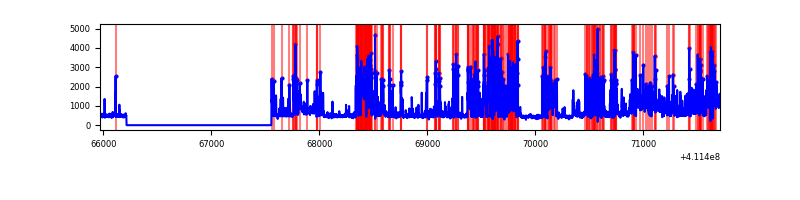 |
| D | 5743 | 4401 | 76 | 76 | 1.32% | 1.73% | 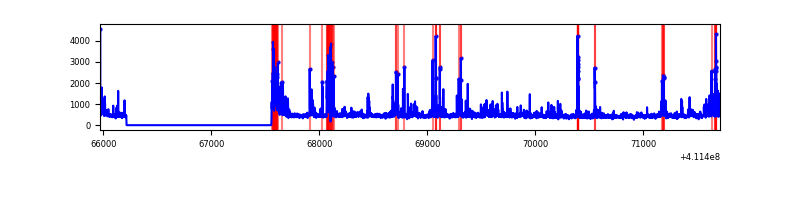 |
Top three noisy pixels from each quadrant. If the there are fewer than three noisy pixels in the level2.evt file, extra rows are filled as -1
| Pixel properties | Quadrant properties | ||||||
|---|---|---|---|---|---|---|---|
| Quadrant | DetID | PixID | Counts | Sigma | Mean | Median | Sigma |
| A | 15 | 222 | 412988 | 4187.58 | 479 | 470 | 98.5 |
| A | 10 | 83 | 303826 | 3079.45 | 479 | 470 | 98.5 |
| A | 2 | 79 | 28056 | 280.03 | 479 | 470 | 98.5 |
| B | 5 | 255 | 371893 | 3990.13 | 471 | 457 | 93.1 |
| B | 8 | 3 | 281861 | 3022.96 | 471 | 457 | 93.1 |
| B | 12 | 111 | 11645 | 120.19 | 471 | 457 | 93.1 |
| C | 15 | 208 | 1977694 | 18582.73 | 451 | 454 | 106.4 |
| C | 15 | 214 | 178180 | 1670.33 | 451 | 454 | 106.4 |
| C | 9 | 187 | 14820 | 135.02 | 451 | 454 | 106.4 |
| D | 2 | 249 | 402063 | 3482.56 | 462 | 448 | 115.3 |
| D | 12 | 227 | 110306 | 952.62 | 462 | 448 | 115.3 |
| D | 10 | 118 | 69636 | 599.96 | 462 | 448 | 115.3 |
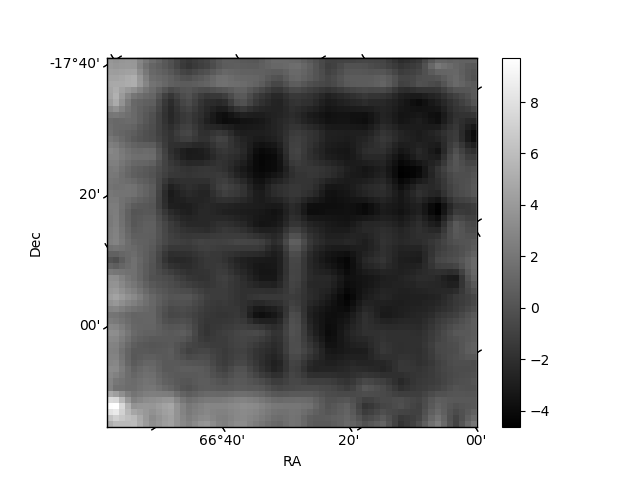
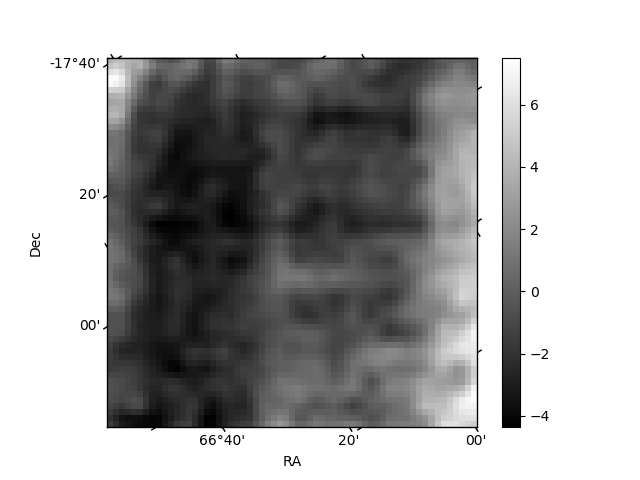
Histogram calculated using DETX and DETY for each event in the final _common_clean file
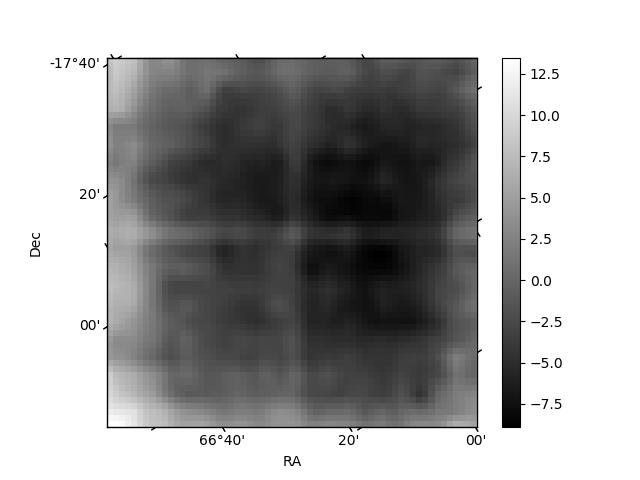
| Quadrant A | 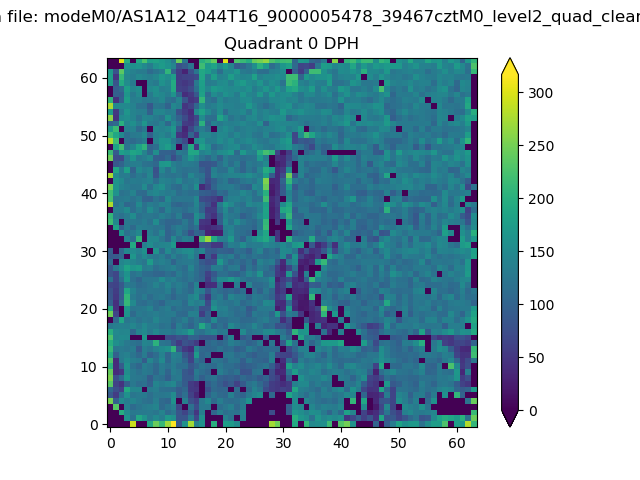 |
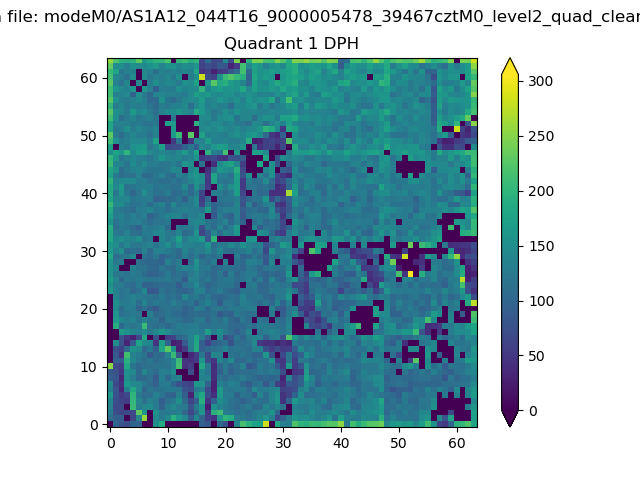 |
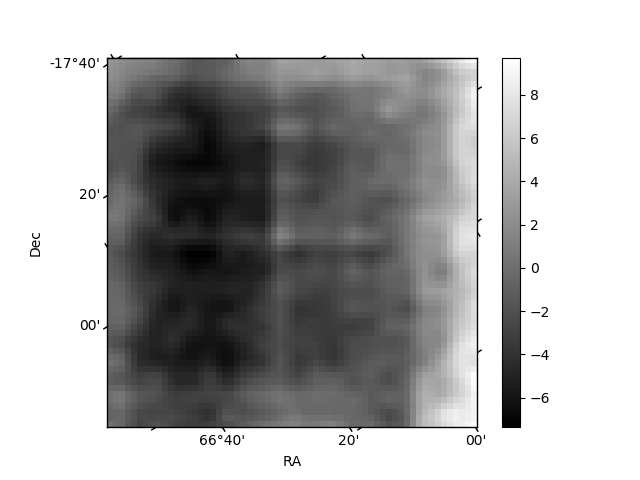
Quadrant B |
|---|---|---|---|
| Quadrant D | 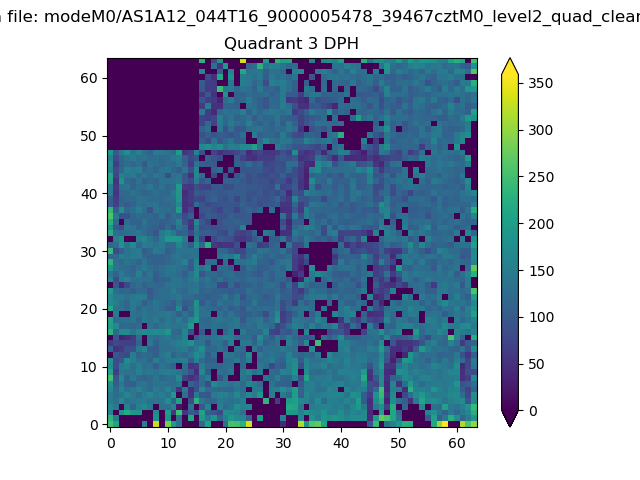 |
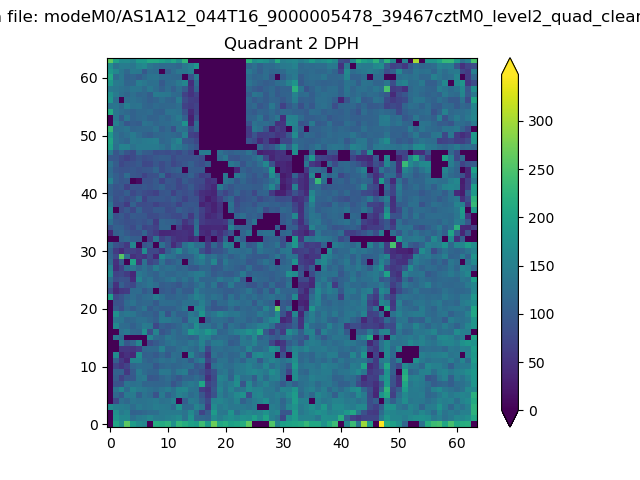 |
Quadrant C |
| Plot type | Count rate plots | Images |
|---|---|---|
| Comparison with Poisson distribution Blue bars denote a histogram of data divided into 1 sec bins. Red curve is a Poisson curve with rate = median count rate of data. |
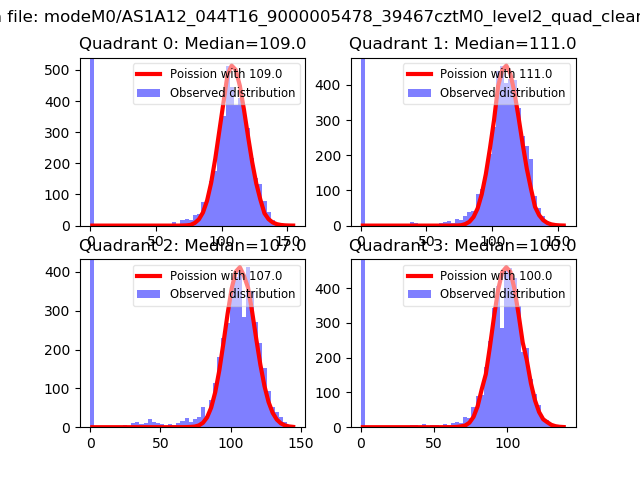 |
 |
| Quadrant-wise count rates Data is divided into 100 sec bins |
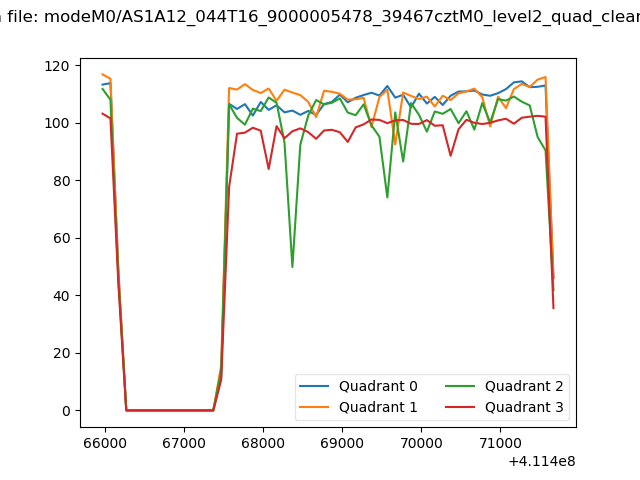 |
|
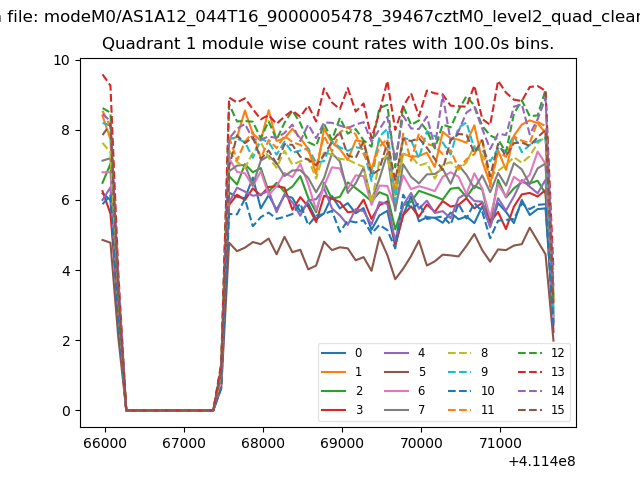
| Module-wise count rates for Quadrant A Data is divided into 100 sec bins |
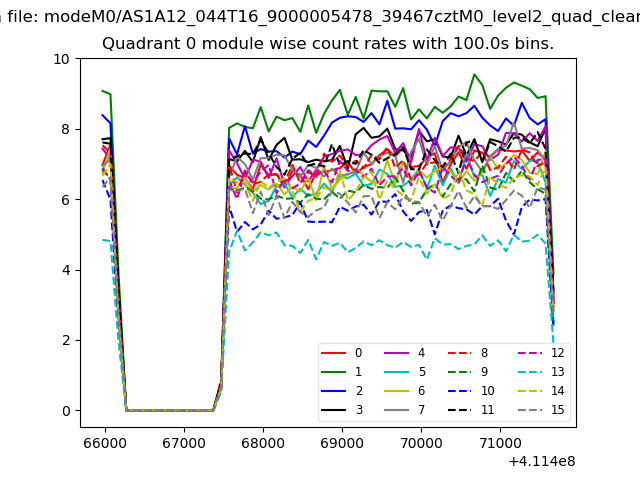 |
 |
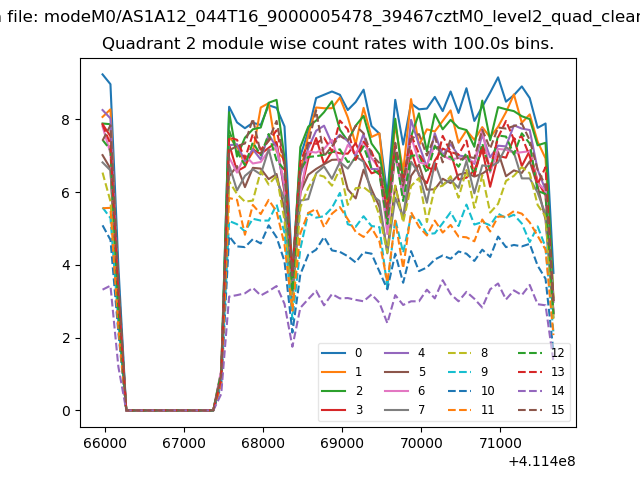
| Module-wise count rates for Quadrant B Data is divided into 100 sec bins |
 |
 |
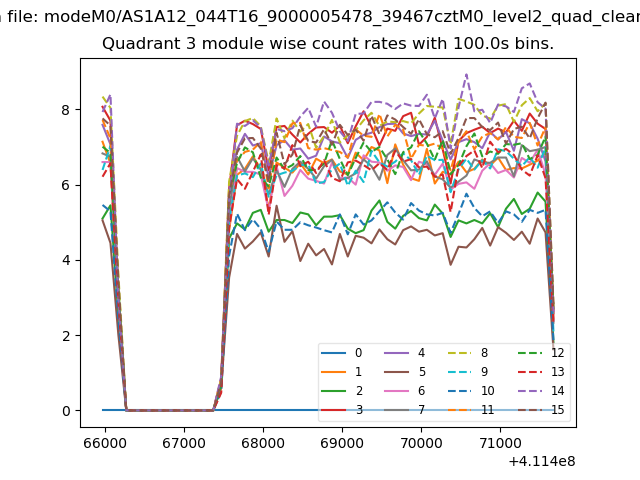
| Module-wise count rates for Quadrant C Data is divided into 100 sec bins |
 |
 |
| Module-wise count rates for Quadrant D Data is divided into 100 sec bins |
 |
 |
| Parameter | Plot |
|---|---|
| CZT HV Monitor | 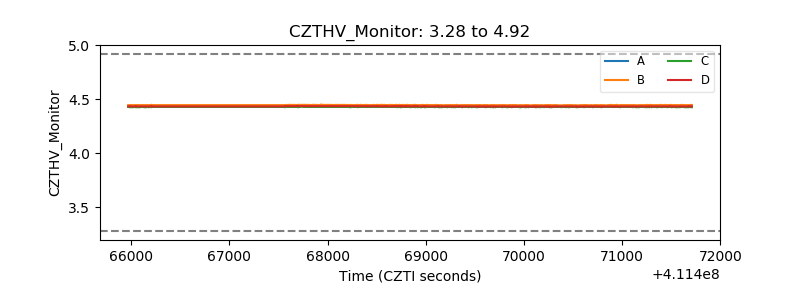 |
| D_VDD | 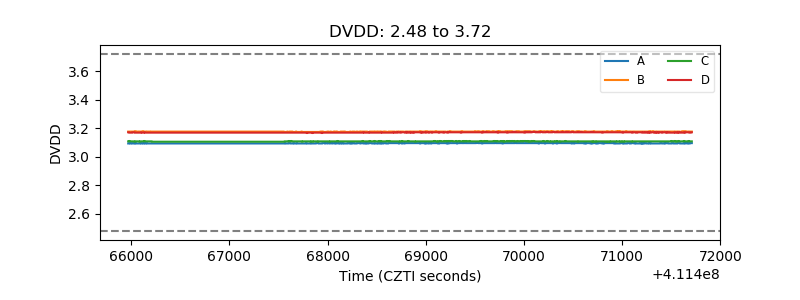 |
| Temperature 1 | 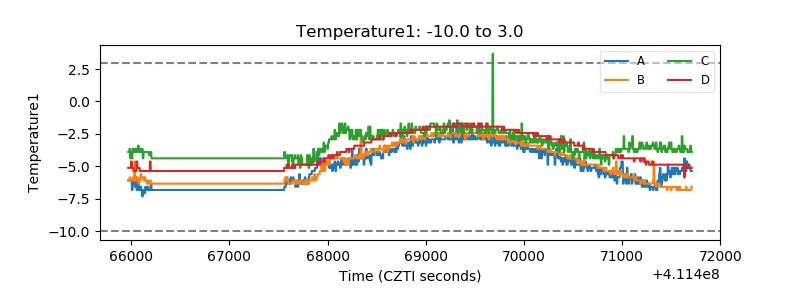 |
| Veto HV Monitor | 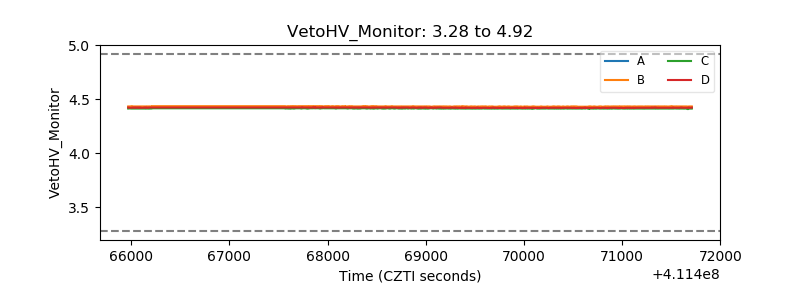 |
| Veto LLD | 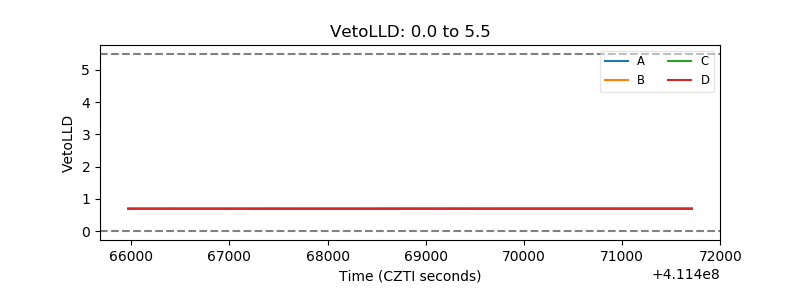 |
| Alpha Counter |  |
| _CPM_Rate | 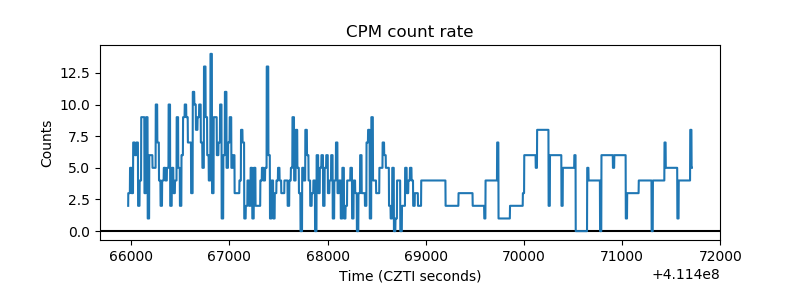 |
| CZT Counter | 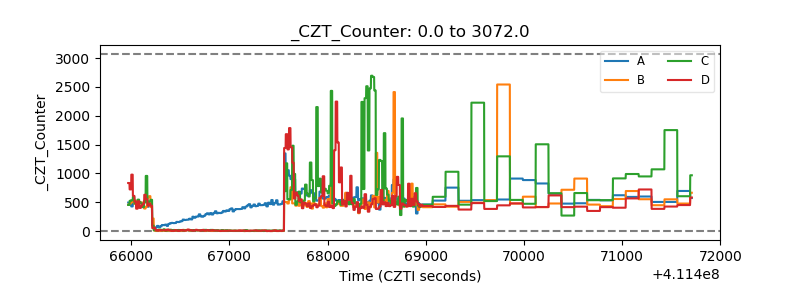 |
| +2.5 Volts monitor | 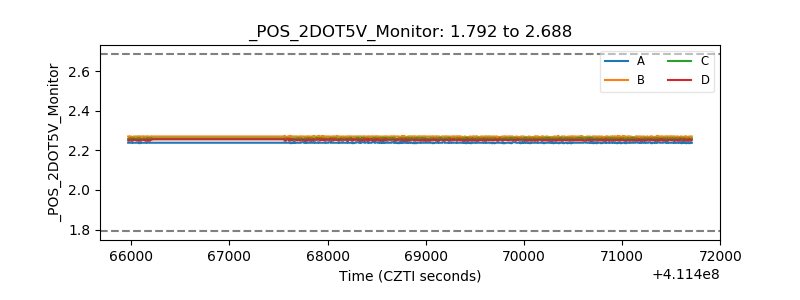 |
| +5 Volts monitor | 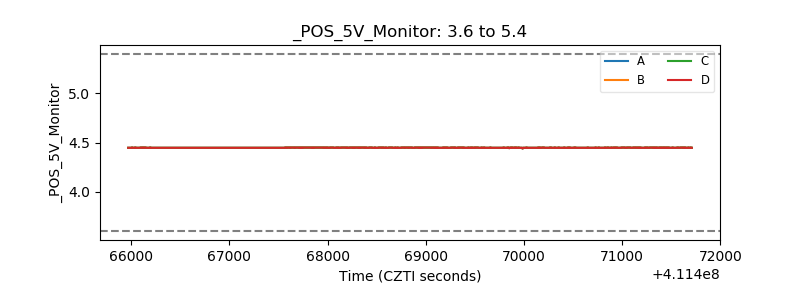 |
| _ROLL_ROT |  |
| _Roll_DEC | 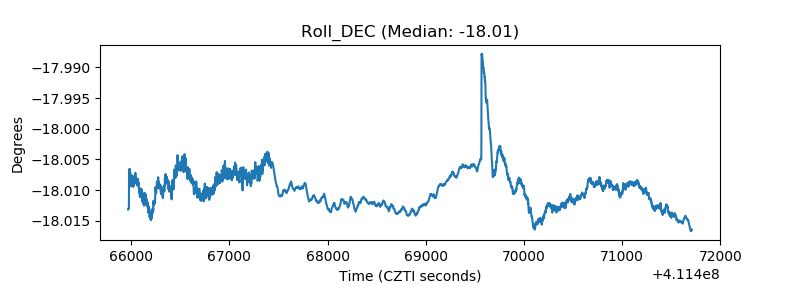 |
| _Roll_RA | 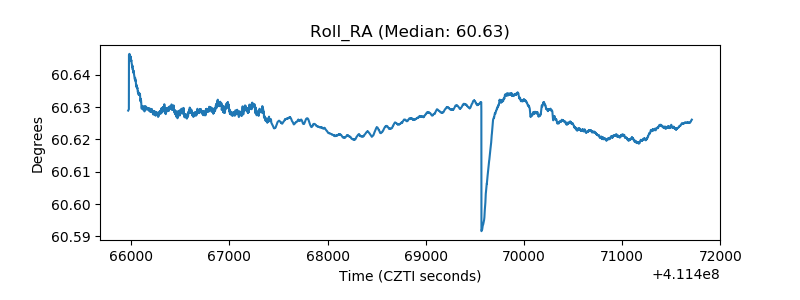 |
| Veto Counter | 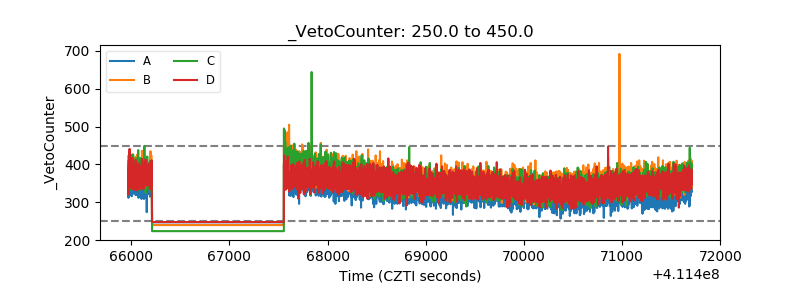 |