| Param | Original file | Final file |
|---|---|---|
| Filename | modeM0/AS1A12_044T16_9000005478_39470cztM0_level2.fits | modeM0/AS1A12_044T16_9000005478_39470cztM0_level2_quad_clean.evt |
| Size (bytes) | 651,000,960 | 144,792,000 |
| Size | 620.8 MB | 138.1 MB |
| Events in quadrant A | 5,015,317 | 976,452 |
| Events in quadrant B | 5,324,340 | 989,587 |
| Events in quadrant C | 8,046,703 | 898,910 |
| Events in quadrant D | 5,007,583 | 889,059 |
| Mode SS | |||
|---|---|---|---|
| Quadrant | BADHDUFLAG | Total packets | Discarded packets |
| A | 0 | 182 | 0 |
| B | 0 | 182 | 0 |
| C | 0 | 182 | 0 |
| D | 0 | 182 | 0 |
| Mode M0 | |||
|---|---|---|---|
| Quadrant | BADHDUFLAG | Total packets | Discarded packets |
| A | 0 | 20338 | 2 |
| B | 0 | 21972 | 2 |
| C | 0 | 29864 | 2 |
| D | 0 | 21211 | 2 |
| Mode M9 | |||
|---|---|---|---|
| Quadrant | BADHDUFLAG | Total packets | Discarded packets |
| A | 0 | 14 | 0 |
| B | 0 | 14 | 0 |
| C | 0 | 14 | 0 |
| D | 0 | 15 | 0 |
| Quadrant | Total seconds | Saturated seconds | Saturation percentage |
|---|---|---|---|
| A | 9082 | 32 | 0.352345% |
| B | 9082 | 244 | 2.686633% |
| C | 9082 | 847 | 9.326140% |
| D | 9082 | 162 | 1.783748% |
Noise dominated data is calculated using 1-second bins in cleaned event files. If a bin has >2000 counts, and if more than 50% of those come from <1% of pixels, then it is considered to be noise-dominated and hence unusable.
| Quadrant | # 1 sec bins | Bins with >0 counts | Bins with >2000 counts | High rate bins dominated by noise | Noise dominated (total time) | Noise dominated (detector-on time) | Marked lightcurve |
|---|---|---|---|---|---|---|---|
| A | 10425 | 9083 | 15 | 15 | 0.14% | 0.17% | 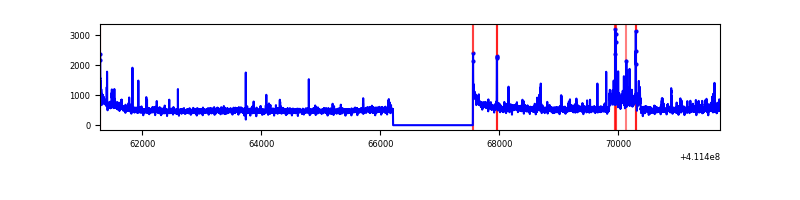 |
| B | 10425 | 9083 | 145 | 145 | 1.39% | 1.60% | 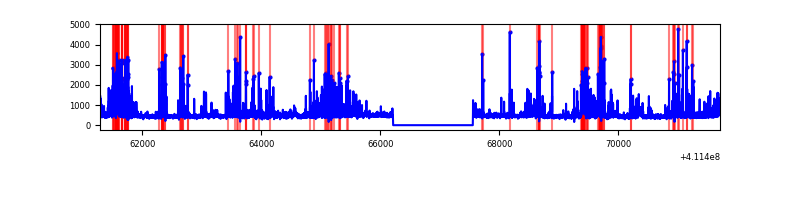 |
| C | 10425 | 9083 | 719 | 719 | 6.90% | 7.92% | 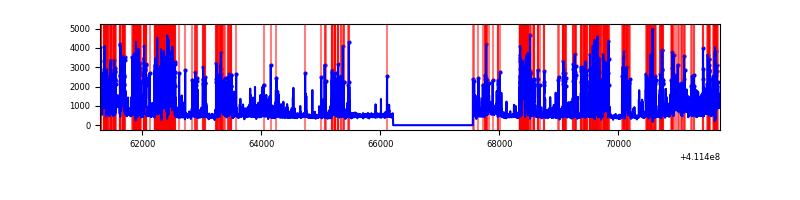 |
| D | 10425 | 9083 | 112 | 112 | 1.07% | 1.23% | 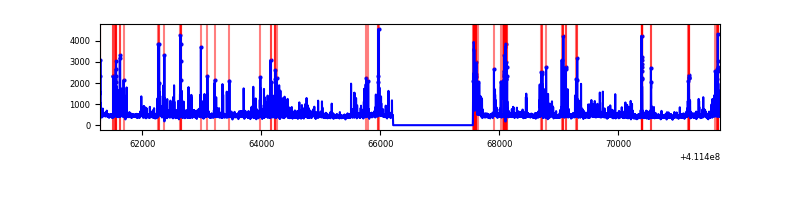 |
Top three noisy pixels from each quadrant. If the there are fewer than three noisy pixels in the level2.evt file, extra rows are filled as -1
| Pixel properties | Quadrant properties | ||||||
|---|---|---|---|---|---|---|---|
| Quadrant | DetID | PixID | Counts | Sigma | Mean | Median | Sigma |
| A | 10 | 83 | 615684 | 3059.34 | 994 | 974 | 200.9 |
| A | 15 | 222 | 449550 | 2232.51 | 994 | 974 | 200.9 |
| A | 2 | 79 | 38164 | 185.09 | 994 | 974 | 200.9 |
| B | 5 | 255 | 1094867 | 5770.53 | 977 | 951 | 189.6 |
| B | 8 | 3 | 340179 | 1789.46 | 977 | 951 | 189.6 |
| B | 12 | 111 | 24420 | 123.8 | 977 | 951 | 189.6 |
| C | 15 | 208 | 4000449 | 18360.42 | 930 | 936 | 217.8 |
| C | 15 | 214 | 364060 | 1666.98 | 930 | 936 | 217.8 |
| C | 9 | 187 | 42724 | 191.83 | 930 | 936 | 217.8 |
| D | 2 | 249 | 547387 | 2301.44 | 961 | 932 | 237.4 |
| D | 12 | 227 | 253000 | 1061.61 | 961 | 932 | 237.4 |
| D | 2 | 153 | 160143 | 670.53 | 961 | 932 | 237.4 |
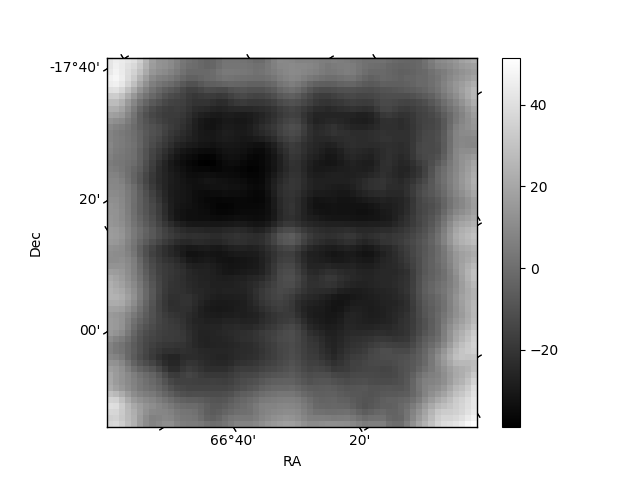
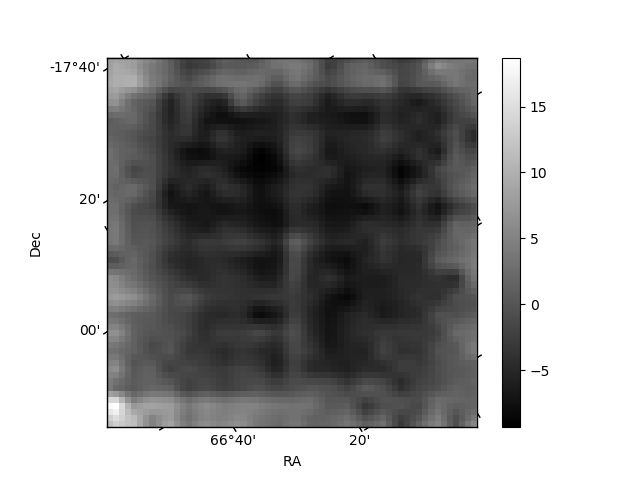
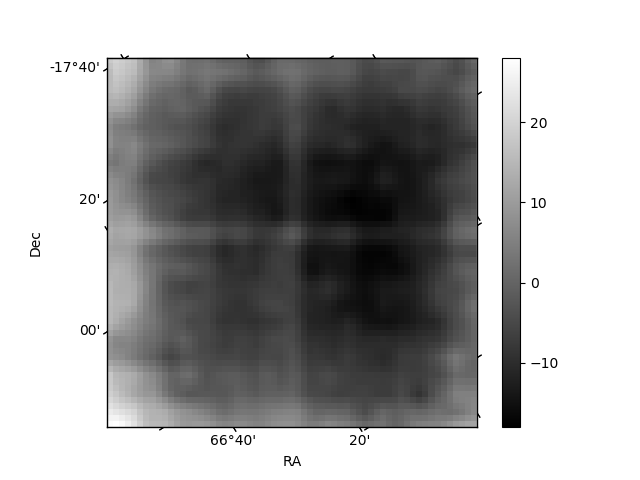
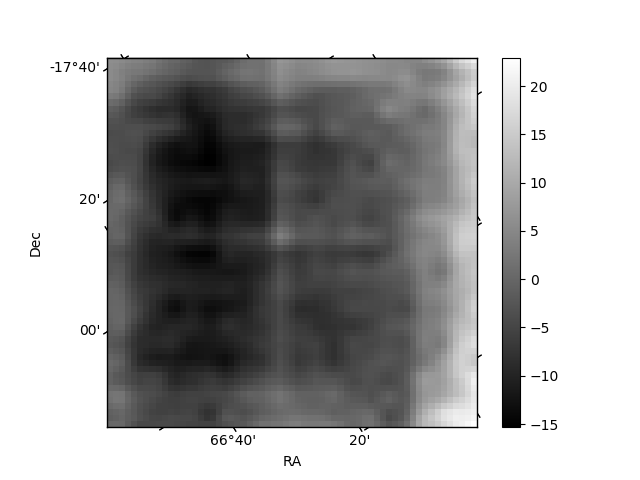
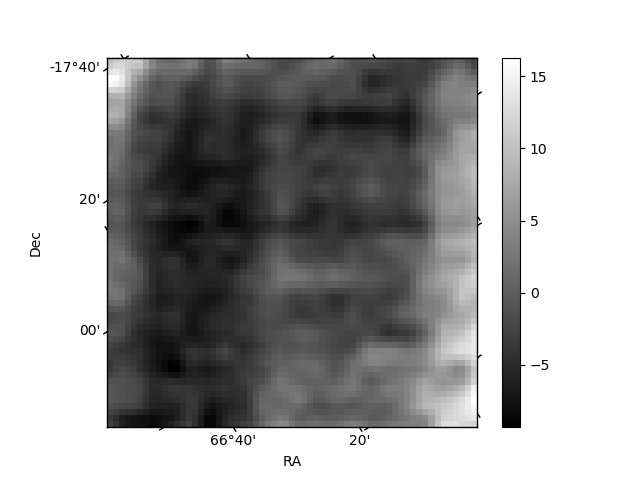
Histogram calculated using DETX and DETY for each event in the final _common_clean file
| Quadrant A | 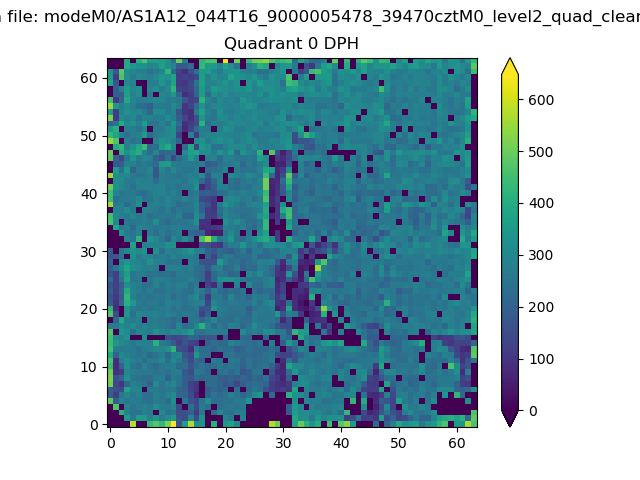 |
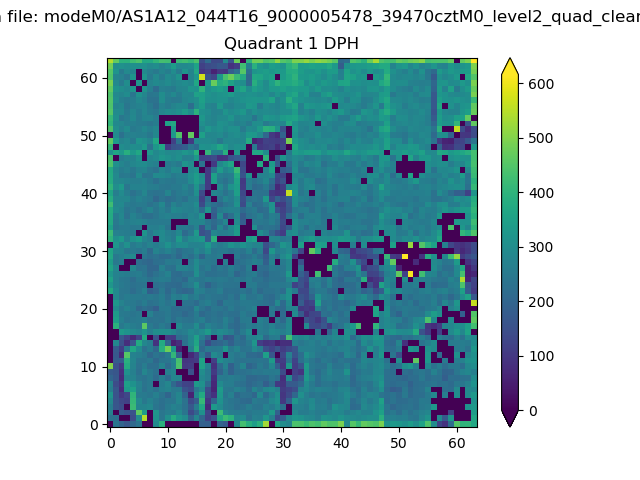 |
Quadrant B |
|---|---|---|---|
| Quadrant D | 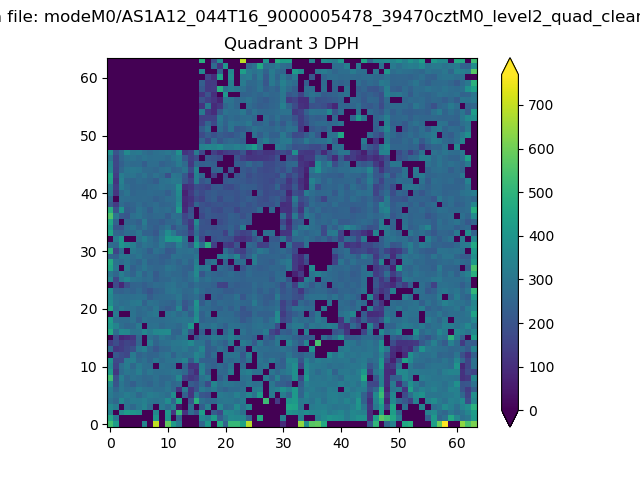 |
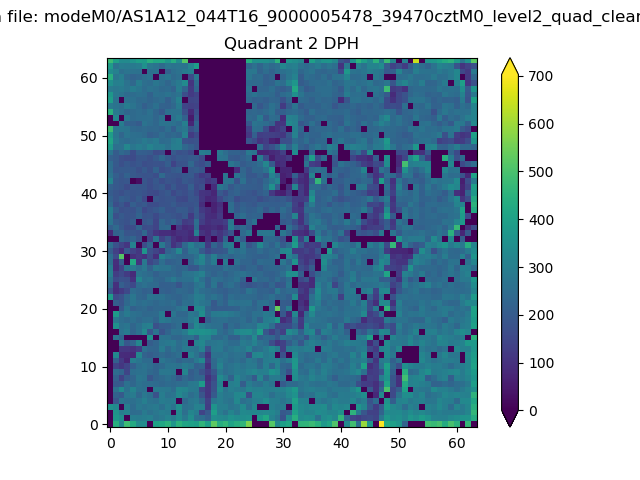 |
Quadrant C |
| Plot type | Count rate plots | Images |
|---|---|---|
| Comparison with Poisson distribution Blue bars denote a histogram of data divided into 1 sec bins. Red curve is a Poisson curve with rate = median count rate of data. |
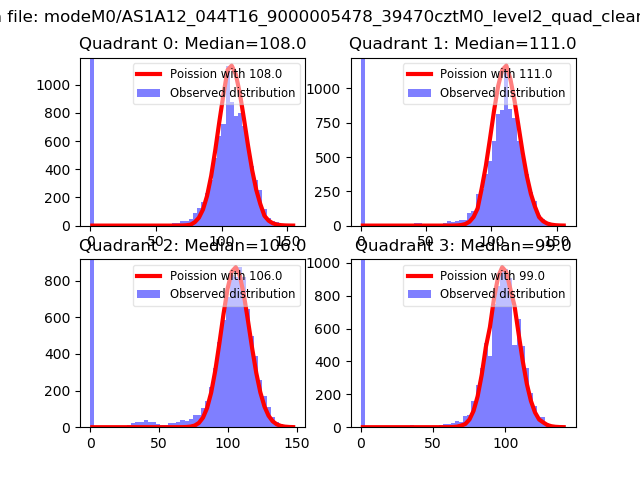 |
 |
| Quadrant-wise count rates Data is divided into 100 sec bins |
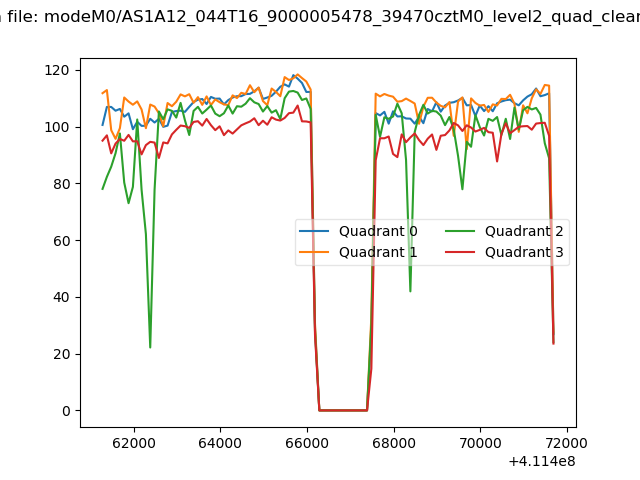 |
|
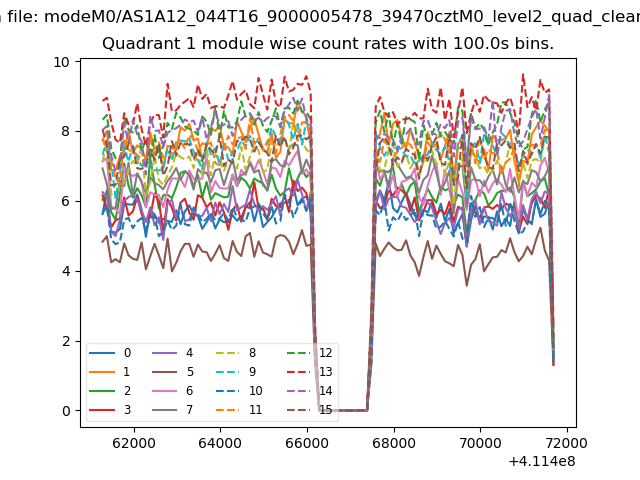
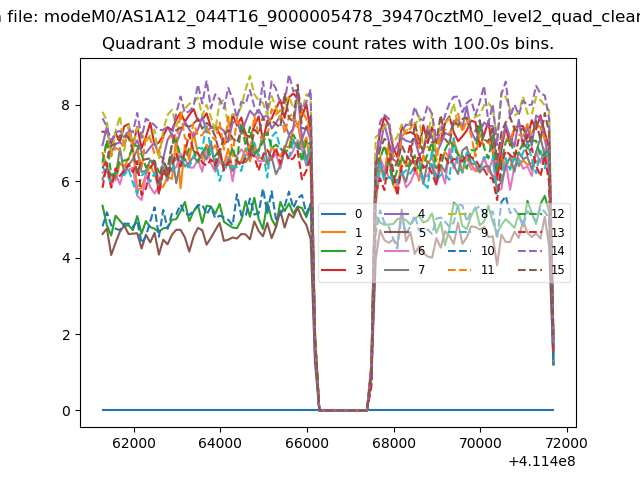
| Module-wise count rates for Quadrant A Data is divided into 100 sec bins |
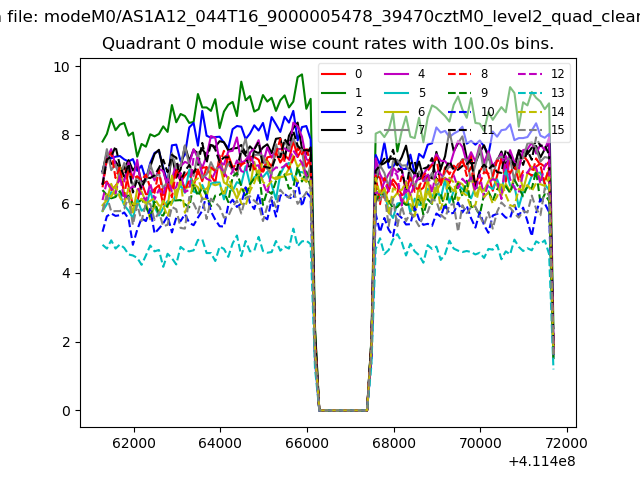 |
 |
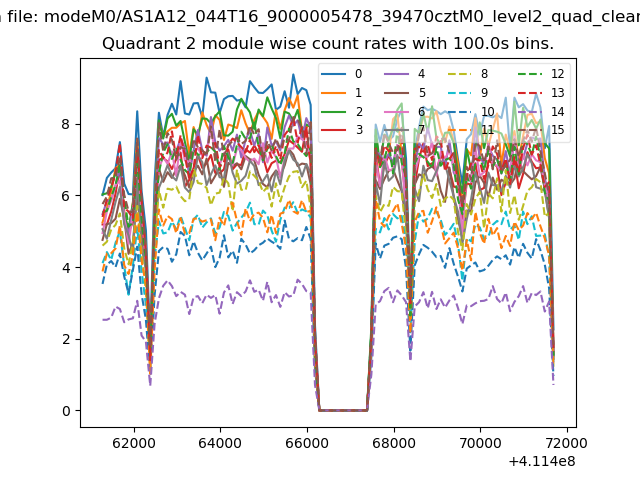
| Module-wise count rates for Quadrant B Data is divided into 100 sec bins |
 |
 |
| Module-wise count rates for Quadrant C Data is divided into 100 sec bins |
 |
 |
| Module-wise count rates for Quadrant D Data is divided into 100 sec bins |
 |
 |
| Parameter | Plot |
|---|---|
| CZT HV Monitor |  |
| D_VDD | 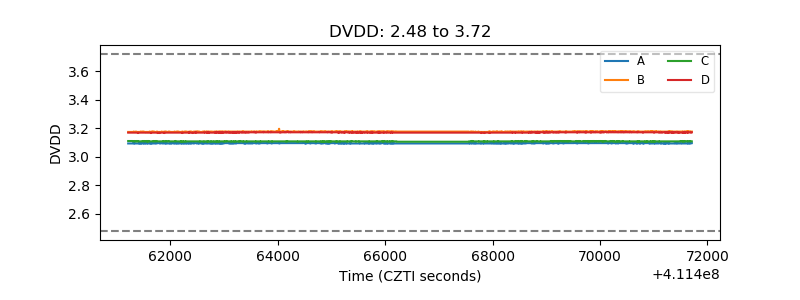 |
| Temperature 1 | 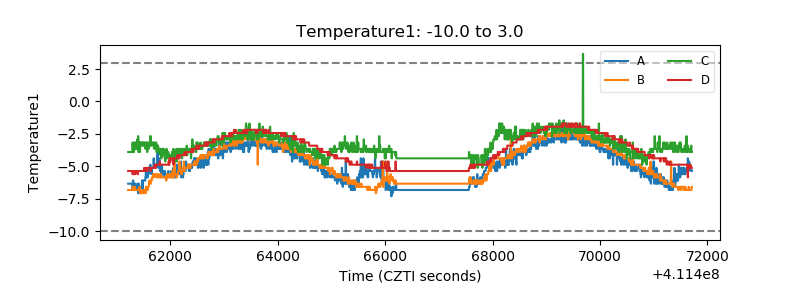 |
| Veto HV Monitor | 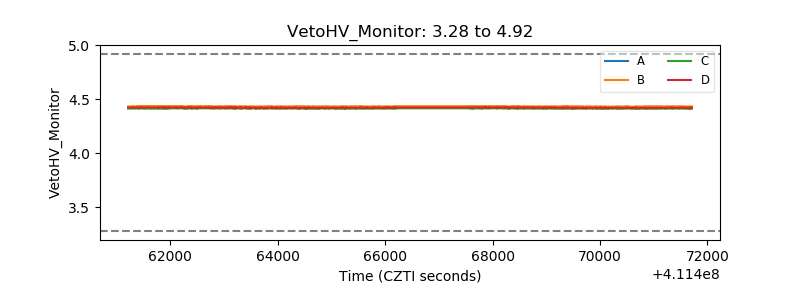 |
| Veto LLD | 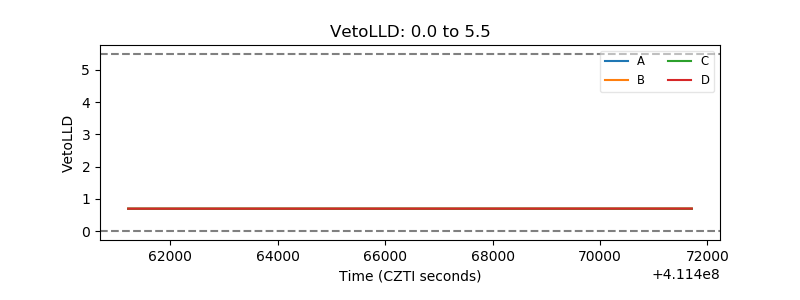 |
| Alpha Counter | 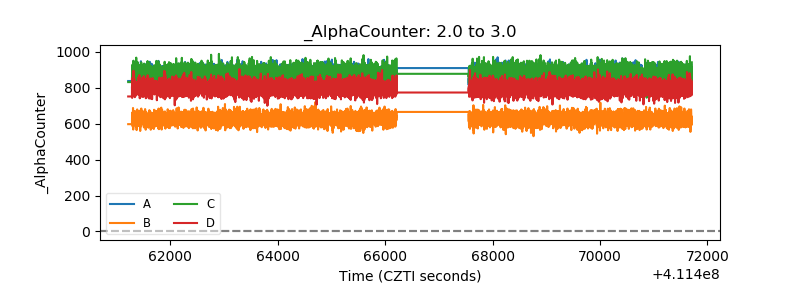 |
| _CPM_Rate | 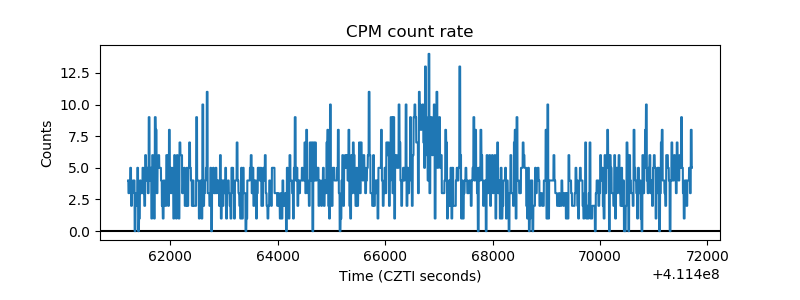 |
| CZT Counter |  |
| +2.5 Volts monitor | 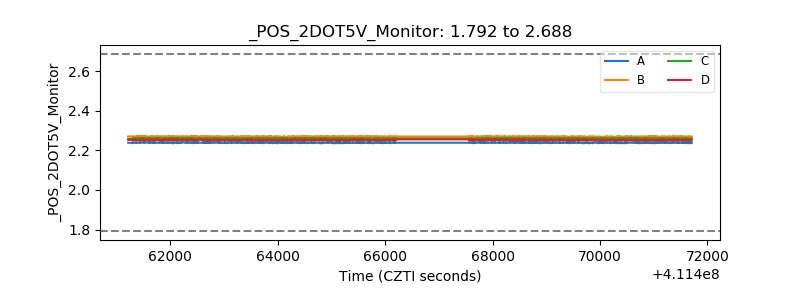 |
| +5 Volts monitor | 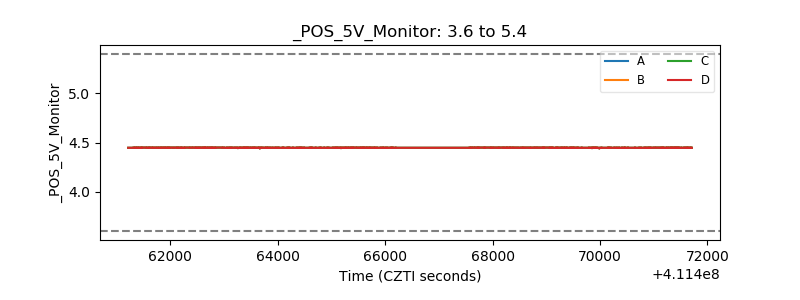 |
| _ROLL_ROT | 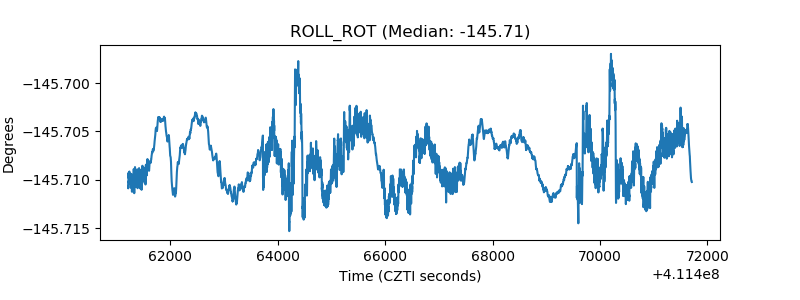 |
| _Roll_DEC | 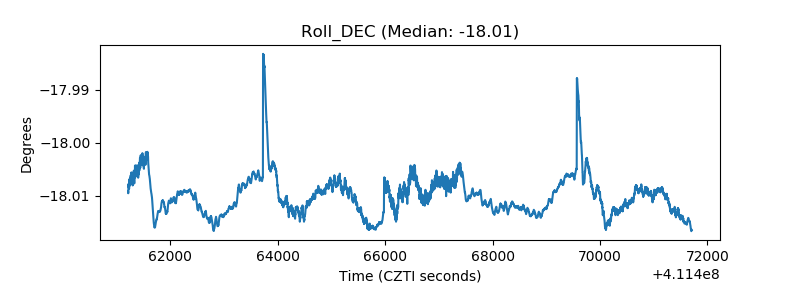 |
| _Roll_RA | 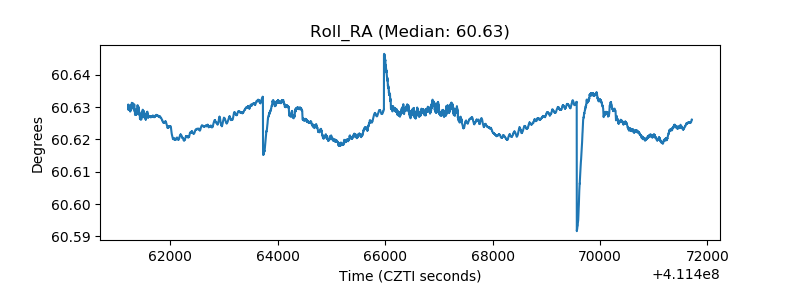 |
| Veto Counter | 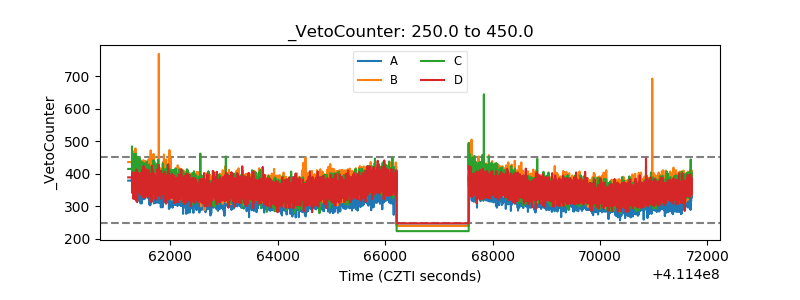 |