| Param | Original file | Final file |
|---|---|---|
| Filename | modeM0/AS1A12_044T05_9000005480_39467cztM0_level2.fits | modeM0/AS1A12_044T05_9000005480_39467cztM0_level2_quad_clean.evt |
| Size (bytes) | 86,794,560 | 14,584,320 |
| Size | 82.8 MB | 13.9 MB |
| Events in quadrant A | 993,329 | 93,668 |
| Events in quadrant B | 485,447 | 102,979 |
| Events in quadrant C | 1,170,947 | 84,002 |
| Events in quadrant D | 487,989 | 89,266 |
| Mode M9 | |||
|---|---|---|---|
| Quadrant | BADHDUFLAG | Total packets | Discarded packets |
| A | 0 | 6 | 0 |
| B | 0 | 6 | 0 |
| C | 0 | 6 | 0 |
| D | 0 | 6 | 0 |
| Mode SS | |||
|---|---|---|---|
| Quadrant | BADHDUFLAG | Total packets | Discarded packets |
| A | 0 | 18 | 0 |
| B | 0 | 18 | 0 |
| C | 0 | 18 | 0 |
| D | 0 | 18 | 0 |
| Mode M0 | |||
|---|---|---|---|
| Quadrant | BADHDUFLAG | Total packets | Discarded packets |
| A | 0 | 3627 | 2 |
| B | 0 | 2021 | 1 |
| C | 0 | 4110 | 1 |
| D | 0 | 2045 | 1 |
| Quadrant | Total seconds | Saturated seconds | Saturation percentage |
|---|---|---|---|
| A | 927 | 92 | 9.924488% |
| B | 927 | 11 | 1.186624% |
| C | 927 | 196 | 21.143474% |
| D | 927 | 8 | 0.862999% |
Noise dominated data is calculated using 1-second bins in cleaned event files. If a bin has >2000 counts, and if more than 50% of those come from <1% of pixels, then it is considered to be noise-dominated and hence unusable.
| Quadrant | # 1 sec bins | Bins with >0 counts | Bins with >2000 counts | High rate bins dominated by noise | Noise dominated (total time) | Noise dominated (detector-on time) | Marked lightcurve |
|---|---|---|---|---|---|---|---|
| A | 927 | 927 | 64 | 64 | 6.90% | 6.90% | 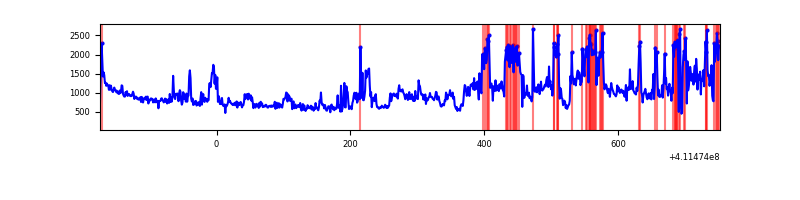 |
| B | 927 | 927 | 2 | 2 | 0.22% | 0.22% | 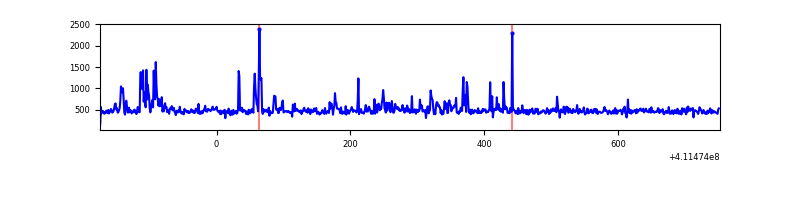 |
| C | 927 | 927 | 146 | 146 | 15.75% | 15.75% | 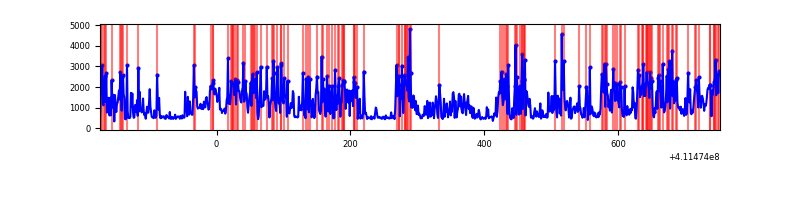 |
| D | 927 | 927 | 5 | 5 | 0.54% | 0.54% | 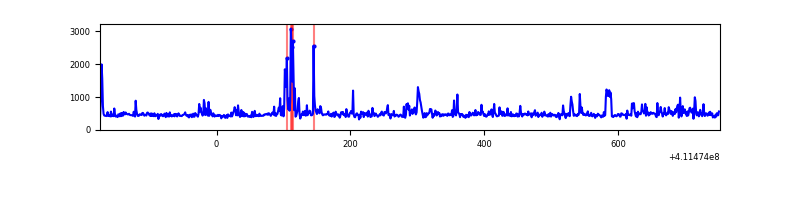 |
Top three noisy pixels from each quadrant. If the there are fewer than three noisy pixels in the level2.evt file, extra rows are filled as -1
| Pixel properties | Quadrant properties | ||||||
|---|---|---|---|---|---|---|---|
| Quadrant | DetID | PixID | Counts | Sigma | Mean | Median | Sigma |
| A | 15 | 222 | 424991 | 18206.94 | 105 | 103 | 23.3 |
| A | 10 | 83 | 132920 | 5691.36 | 105 | 103 | 23.3 |
| A | 15 | 174 | 19347 | 824.63 | 105 | 103 | 23.3 |
| B | 5 | 255 | 35161 | 1551.3 | 105 | 102 | 22.6 |
| B | 8 | 3 | 23906 | 1053.29 | 105 | 102 | 22.6 |
| B | 0 | 230 | 5034 | 218.23 | 105 | 102 | 22.6 |
| C | 15 | 208 | 749686 | 31218.43 | 95 | 95 | 24.0 |
| C | 15 | 214 | 40618 | 1687.65 | 95 | 95 | 24.0 |
| C | 9 | 187 | 3650 | 148.04 | 95 | 95 | 24.0 |
| D | 12 | 233 | 32153 | 1163.87 | 104 | 100 | 27.5 |
| D | 12 | 227 | 12527 | 451.23 | 104 | 100 | 27.5 |
| D | 12 | 0 | 10685 | 384.35 | 104 | 100 | 27.5 |
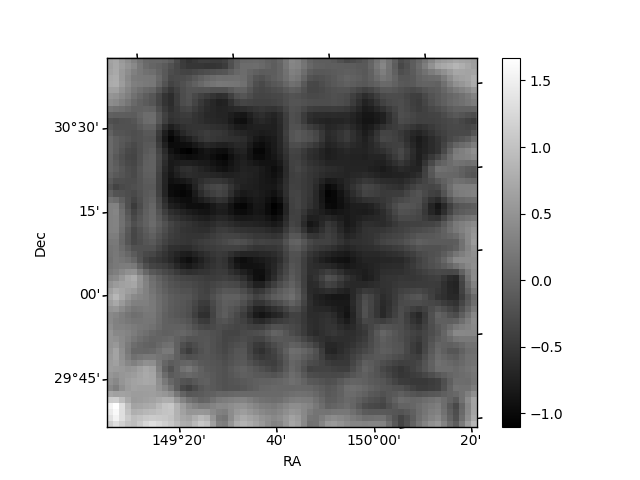
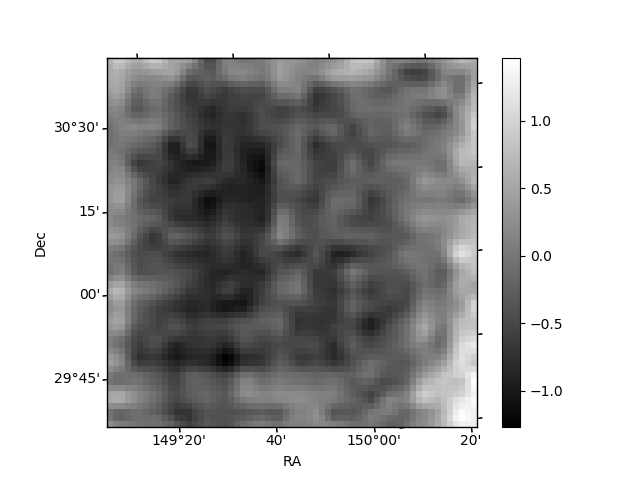
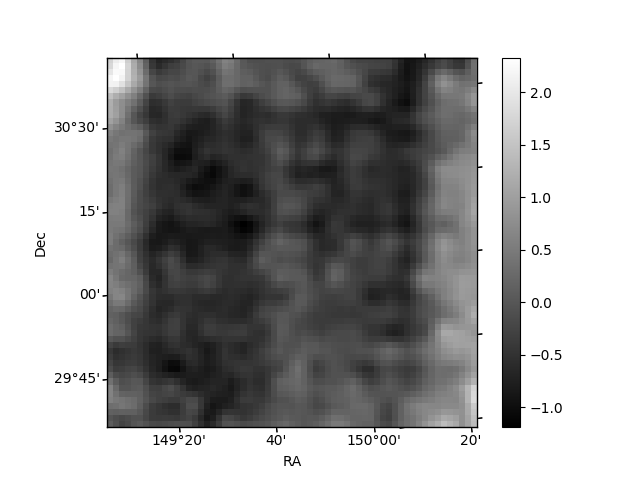
Histogram calculated using DETX and DETY for each event in the final _common_clean file
| Quadrant A | 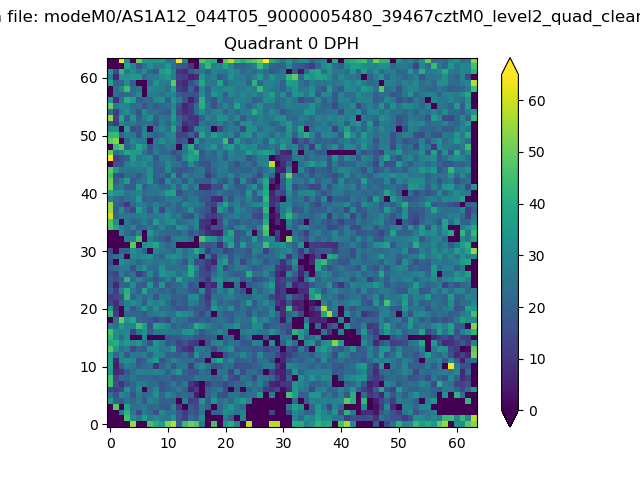 |
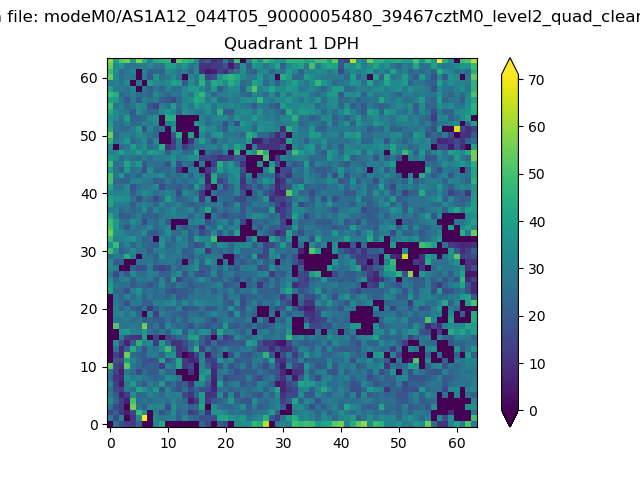 |
Quadrant B |
|---|---|---|---|
| Quadrant D | 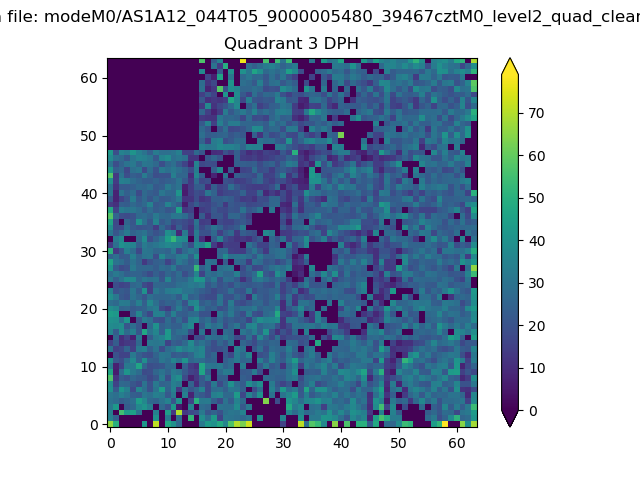 |
 |
Quadrant C |
| Plot type | Count rate plots | Images |
|---|---|---|
| Comparison with Poisson distribution Blue bars denote a histogram of data divided into 1 sec bins. Red curve is a Poisson curve with rate = median count rate of data. |
 |
 |
| Quadrant-wise count rates Data is divided into 100 sec bins |
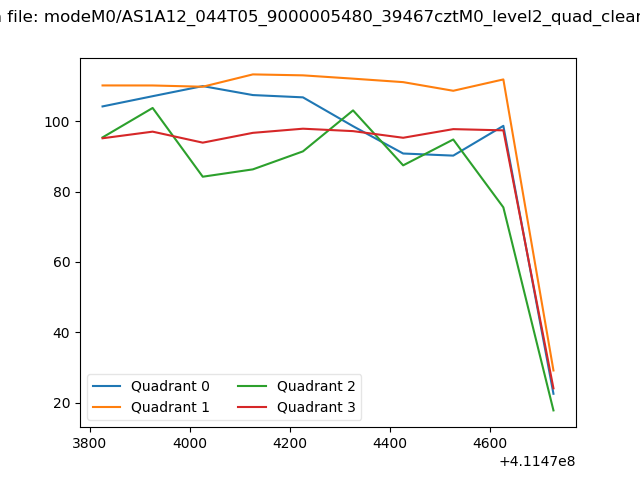 |
|
| Module-wise count rates for Quadrant A Data is divided into 100 sec bins |
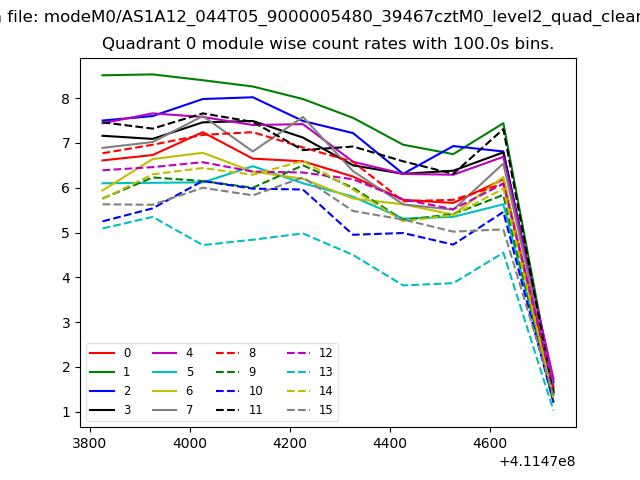 |
 |
| Module-wise count rates for Quadrant B Data is divided into 100 sec bins |
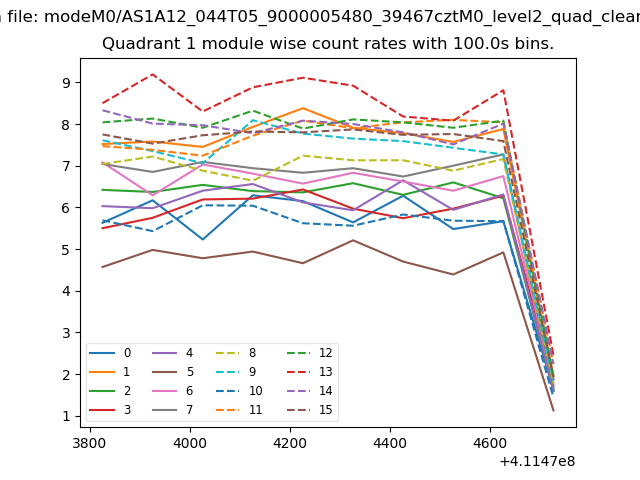 |
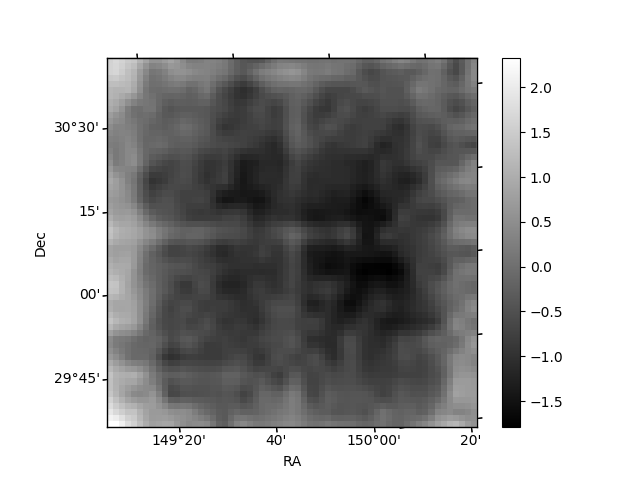 |
| Module-wise count rates for Quadrant C Data is divided into 100 sec bins |
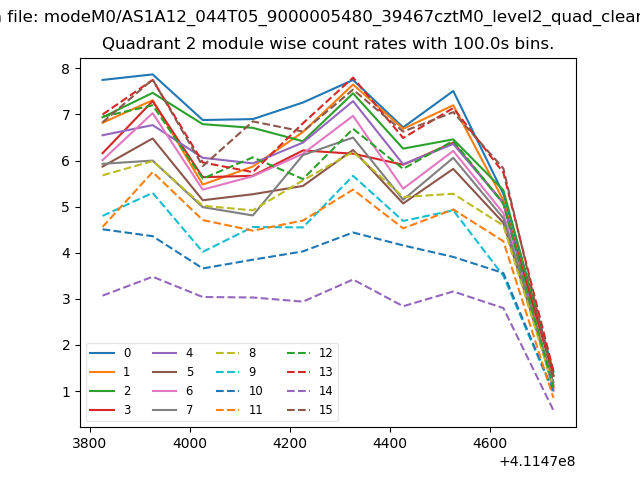 |
 |
| Module-wise count rates for Quadrant D Data is divided into 100 sec bins |
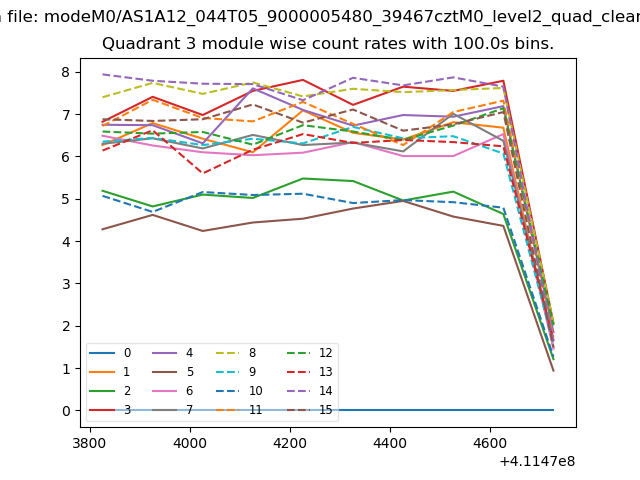 |
 |
| Parameter | Plot |
|---|---|
| CZT HV Monitor |  |
| D_VDD | 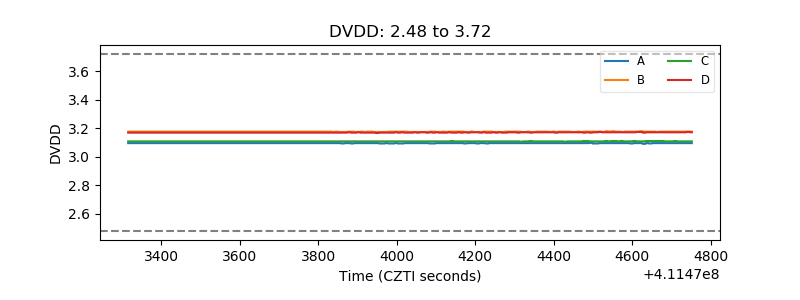 |
| Temperature 1 | 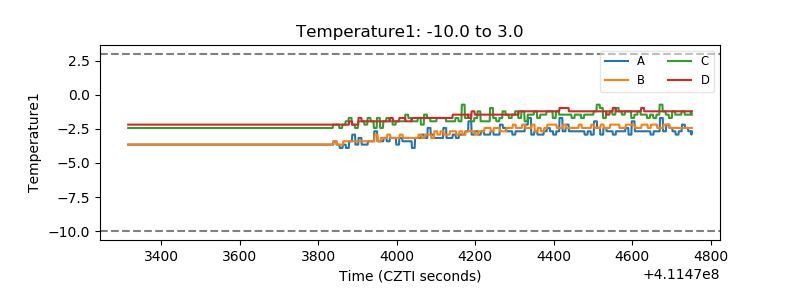 |
| Veto HV Monitor | 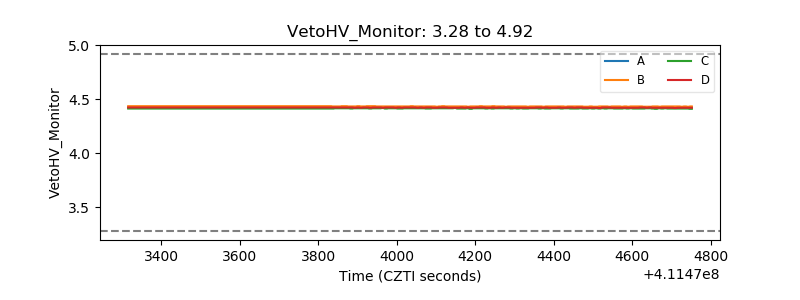 |
| Veto LLD | 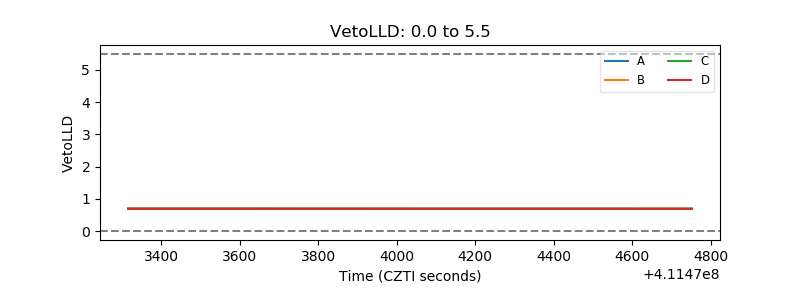 |
| Alpha Counter | 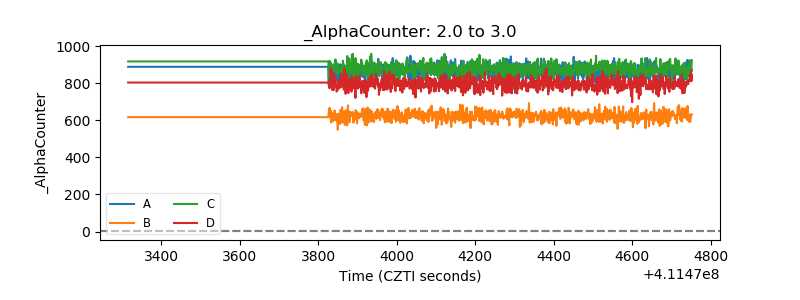 |
| _CPM_Rate | 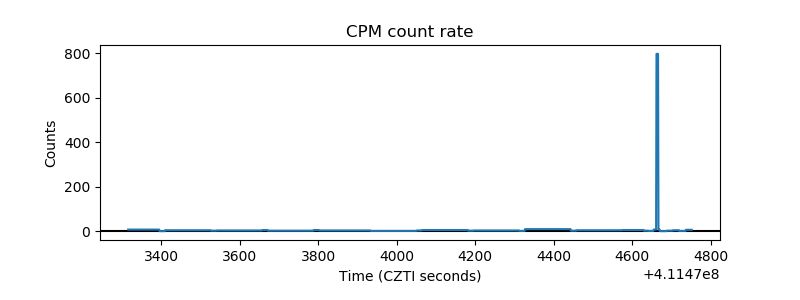 |
| CZT Counter | 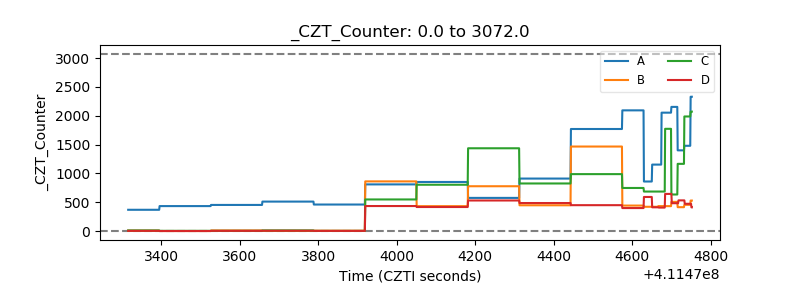 |
| +2.5 Volts monitor | 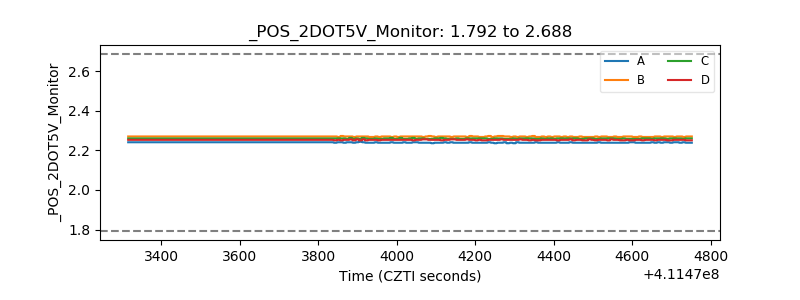 |
| +5 Volts monitor | 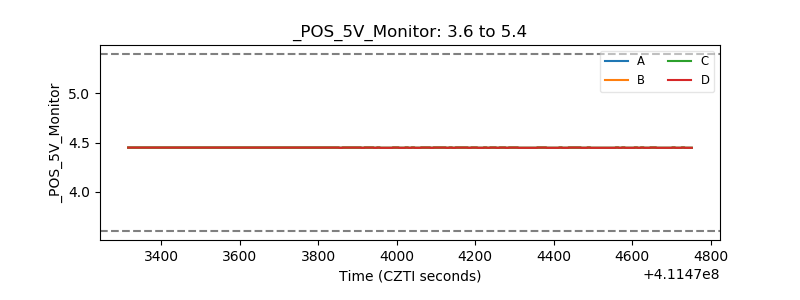 |
| _ROLL_ROT | 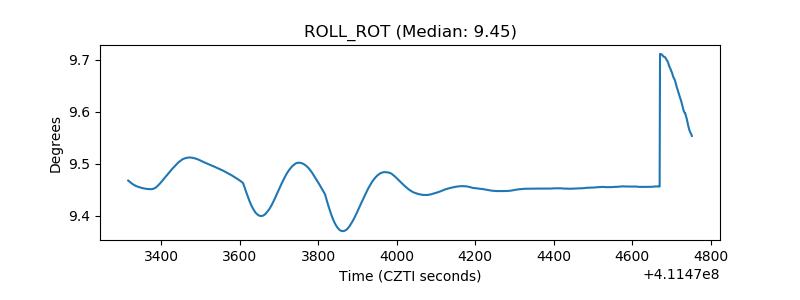 |
| _Roll_DEC | 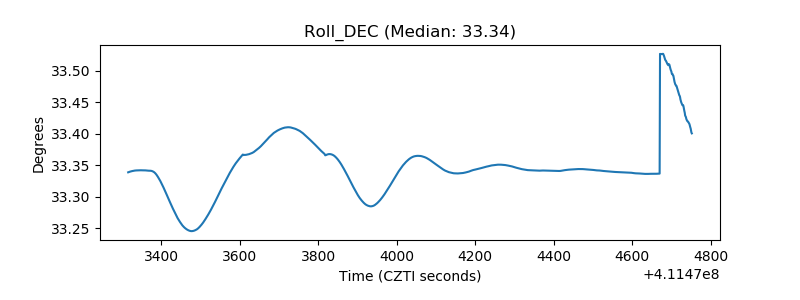 |
| _Roll_RA | 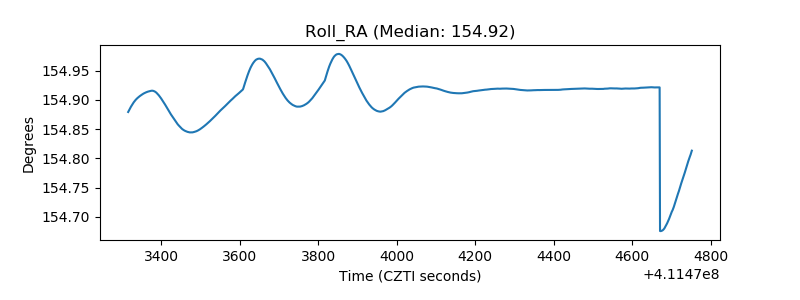 |
| Veto Counter | 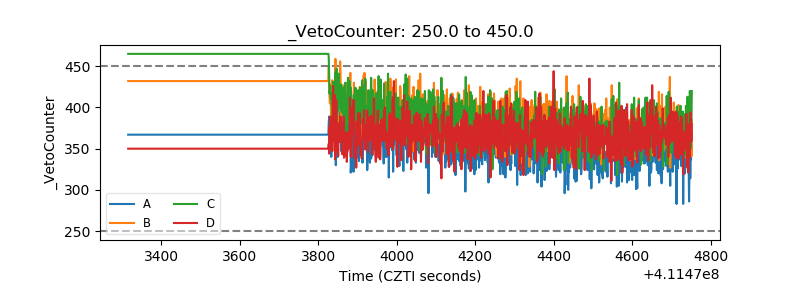 |