| Param | Original file | Final file |
|---|---|---|
| Filename | modeM0/AS1A12_044T05_9000005480_39469cztM0_level2.fits | modeM0/AS1A12_044T05_9000005480_39469cztM0_level2_quad_clean.evt |
| Size (bytes) | 829,719,360 | 169,934,400 |
| Size | 791.3 MB | 162.1 MB |
| Events in quadrant A | 7,564,539 | 1,143,247 |
| Events in quadrant B | 5,227,900 | 1,209,947 |
| Events in quadrant C | 9,351,567 | 1,053,690 |
| Events in quadrant D | 7,733,051 | 990,139 |
| Mode M9 | |||
|---|---|---|---|
| Quadrant | BADHDUFLAG | Total packets | Discarded packets |
| A | 0 | 31 | 0 |
| B | 0 | 31 | 0 |
| C | 0 | 31 | 0 |
| D | 0 | 32 | 0 |
| Mode SS | |||
|---|---|---|---|
| Quadrant | BADHDUFLAG | Total packets | Discarded packets |
| A | 0 | 220 | 0 |
| B | 0 | 220 | 0 |
| C | 0 | 220 | 0 |
| D | 0 | 220 | 0 |
| Mode M0 | |||
|---|---|---|---|
| Quadrant | BADHDUFLAG | Total packets | Discarded packets |
| A | 0 | 29200 | 4 |
| B | 0 | 22744 | 3 |
| C | 0 | 34729 | 3 |
| D | 0 | 30548 | 3 |
| Quadrant | Total seconds | Saturated seconds | Saturation percentage |
|---|---|---|---|
| A | 10804 | 457 | 4.229915% |
| B | 10804 | 63 | 0.583117% |
| C | 10804 | 1064 | 9.848204% |
| D | 10804 | 766 | 7.089967% |
Noise dominated data is calculated using 1-second bins in cleaned event files. If a bin has >2000 counts, and if more than 50% of those come from <1% of pixels, then it is considered to be noise-dominated and hence unusable.
| Quadrant | # 1 sec bins | Bins with >0 counts | Bins with >2000 counts | High rate bins dominated by noise | Noise dominated (total time) | Noise dominated (detector-on time) | Marked lightcurve |
|---|---|---|---|---|---|---|---|
| A | 13580 | 10806 | 320 | 320 | 2.36% | 2.96% | 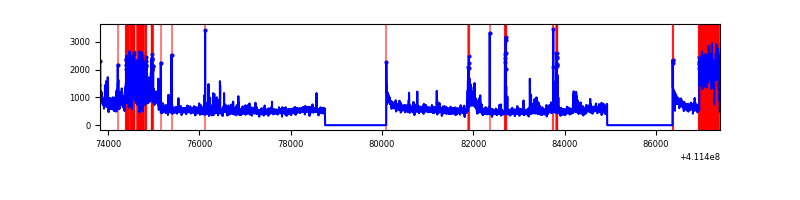 |
| B | 13580 | 10806 | 26 | 26 | 0.19% | 0.24% | 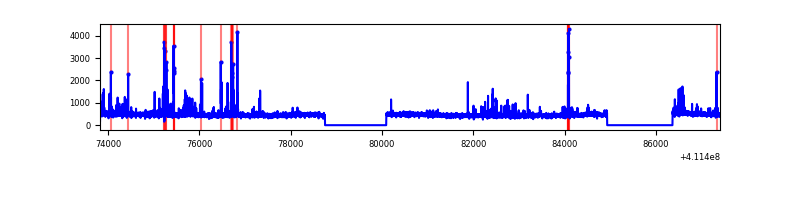 |
| C | 13580 | 10806 | 805 | 805 | 5.93% | 7.45% | 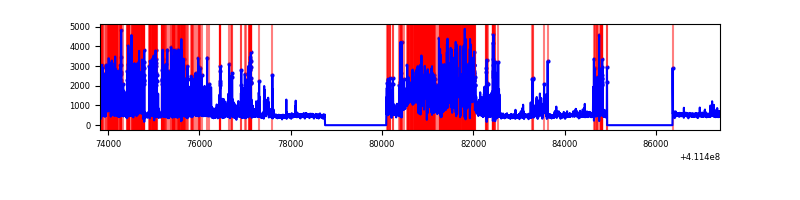 |
| D | 13580 | 10806 | 603 | 603 | 4.44% | 5.58% | 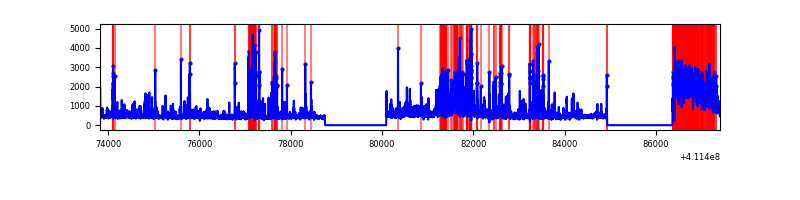 |
Top three noisy pixels from each quadrant. If the there are fewer than three noisy pixels in the level2.evt file, extra rows are filled as -1
| Pixel properties | Quadrant properties | ||||||
|---|---|---|---|---|---|---|---|
| Quadrant | DetID | PixID | Counts | Sigma | Mean | Median | Sigma |
| A | 15 | 222 | 1760433 | 7298.99 | 1193 | 1169 | 241.0 |
| A | 10 | 83 | 802607 | 3325.08 | 1193 | 1169 | 241.0 |
| A | 15 | 174 | 284980 | 1177.5 | 1193 | 1169 | 241.0 |
| B | 5 | 255 | 261028 | 1124.11 | 1197 | 1163 | 231.2 |
| B | 8 | 3 | 167332 | 718.8 | 1197 | 1163 | 231.2 |
| B | 12 | 111 | 30067 | 125.03 | 1197 | 1163 | 231.2 |
| C | 15 | 208 | 4430432 | 16797.3 | 1132 | 1140 | 263.7 |
| C | 15 | 214 | 437627 | 1655.3 | 1132 | 1140 | 263.7 |
| C | 9 | 187 | 53500 | 198.57 | 1132 | 1140 | 263.7 |
| D | 12 | 0 | 1854377 | 6631.75 | 1145 | 1111 | 279.5 |
| D | 13 | 249 | 472213 | 1685.8 | 1145 | 1111 | 279.5 |
| D | 2 | 249 | 341788 | 1219.08 | 1145 | 1111 | 279.5 |
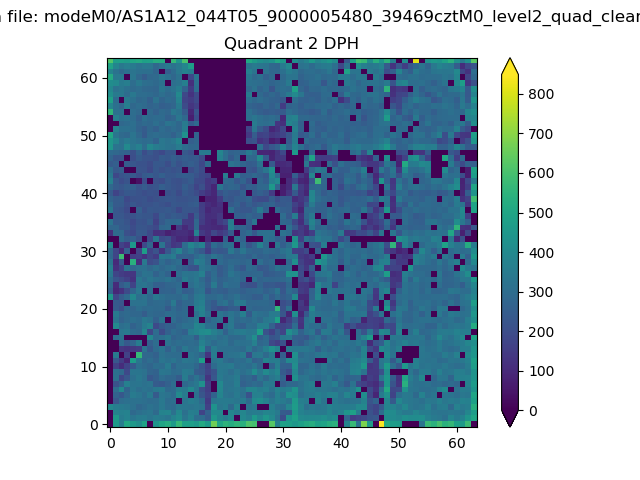
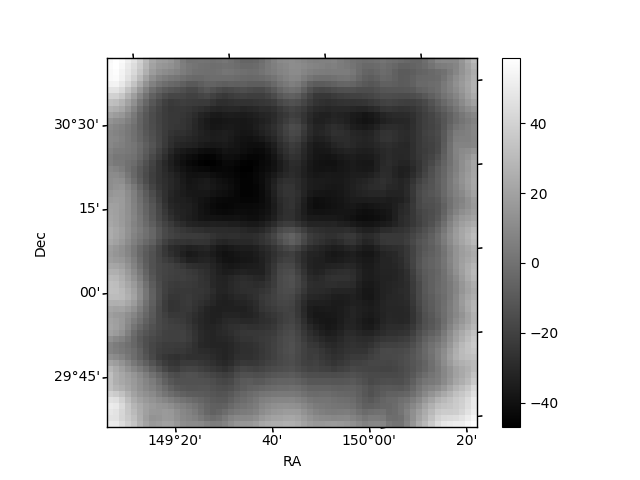
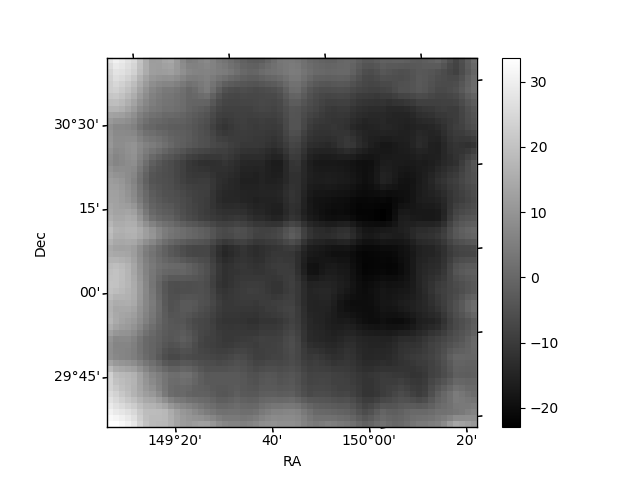
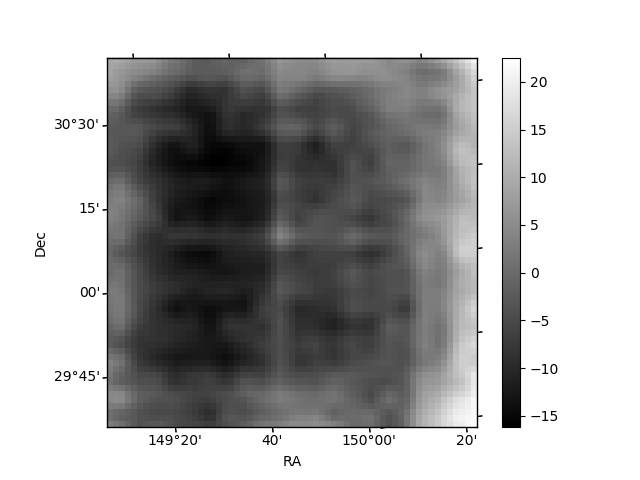
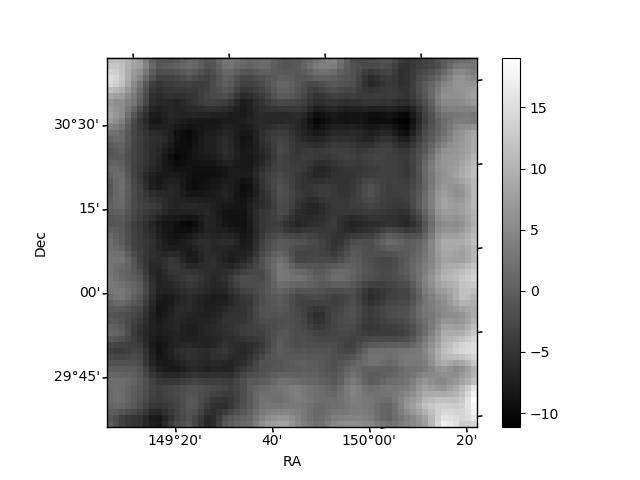
Histogram calculated using DETX and DETY for each event in the final _common_clean file
| Quadrant A | 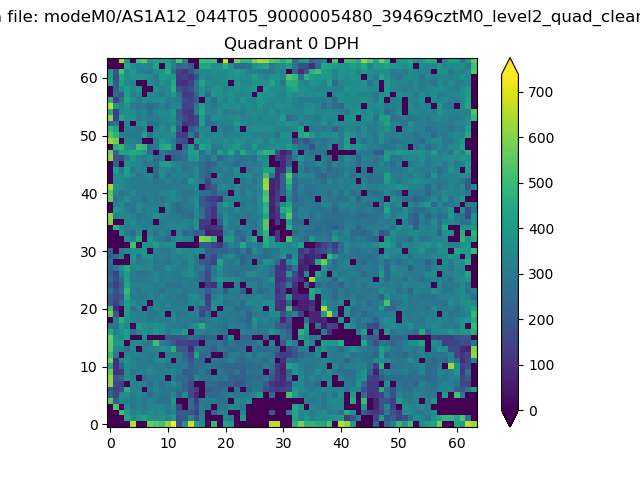 |
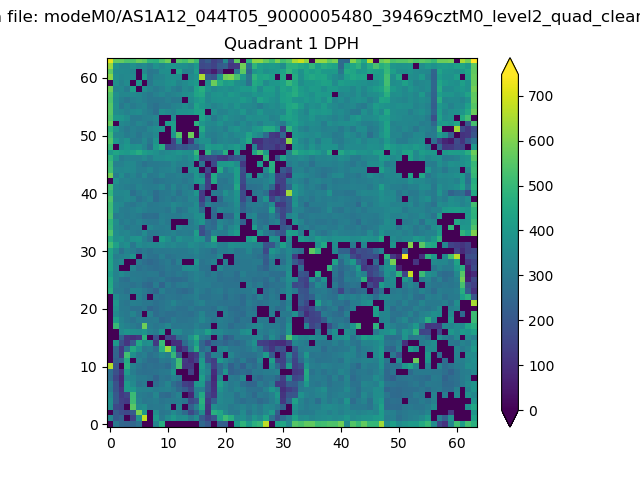 |
Quadrant B |
|---|---|---|---|
| Quadrant D | 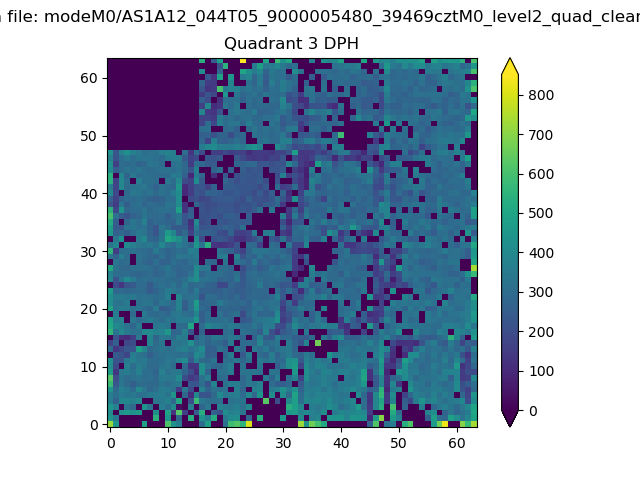 |
 |
Quadrant C |
| Plot type | Count rate plots | Images |
|---|---|---|
| Comparison with Poisson distribution Blue bars denote a histogram of data divided into 1 sec bins. Red curve is a Poisson curve with rate = median count rate of data. |
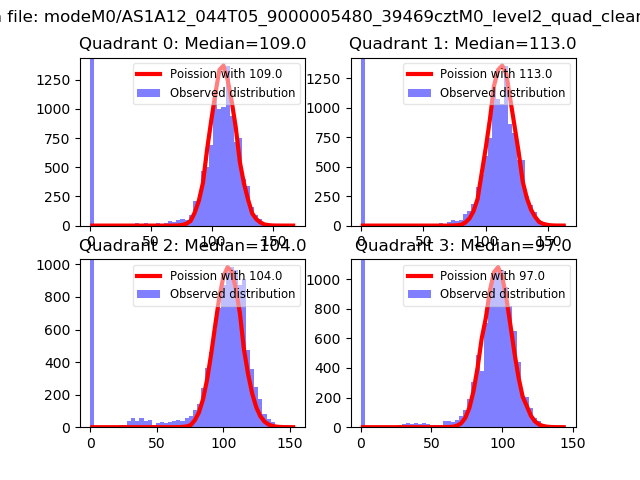 |
 |
| Quadrant-wise count rates Data is divided into 100 sec bins |
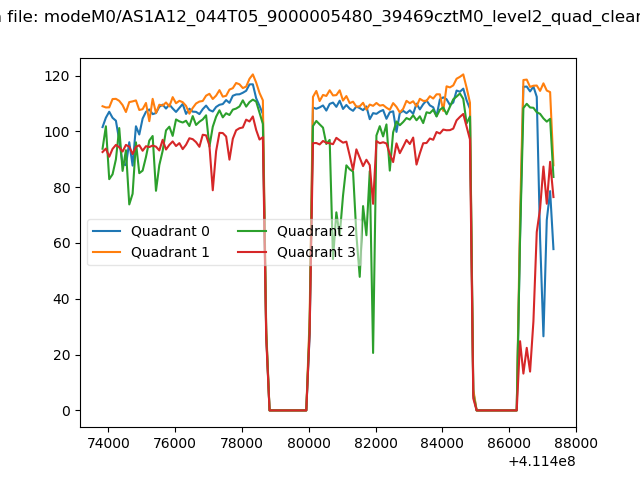 |
|
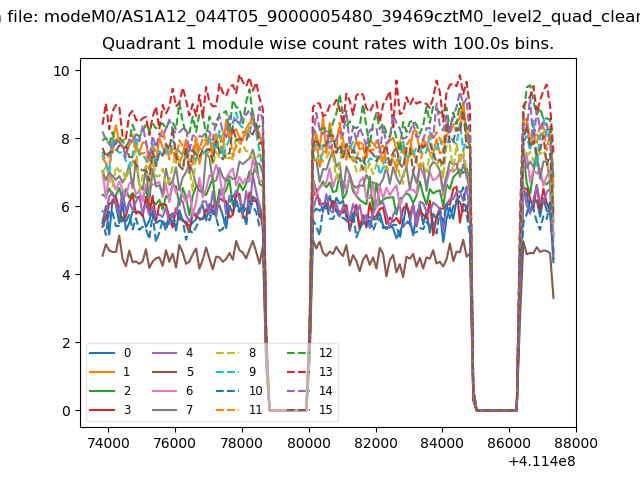
| Module-wise count rates for Quadrant A Data is divided into 100 sec bins |
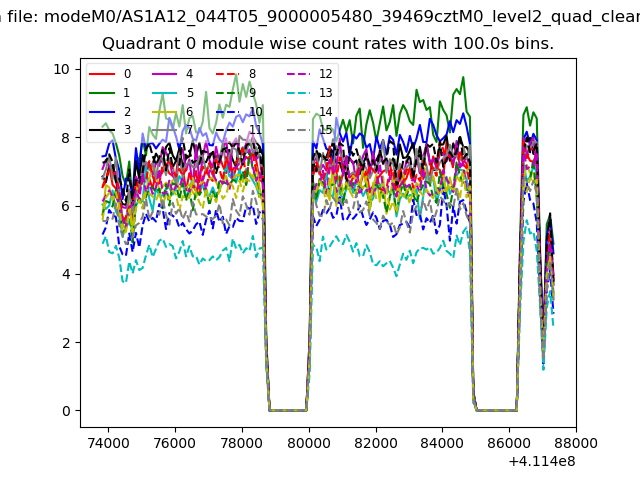 |
 |
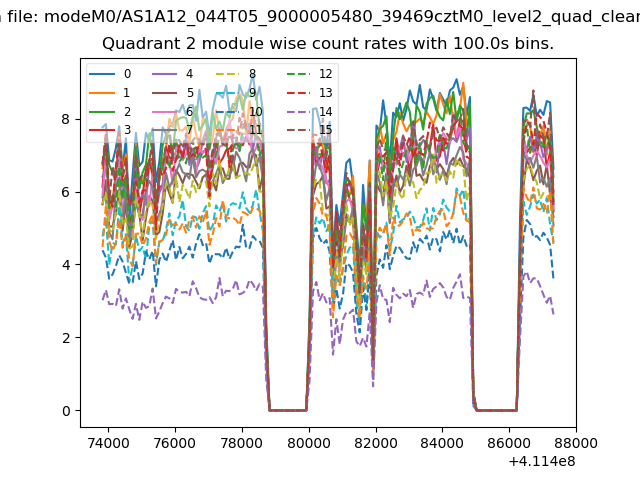
| Module-wise count rates for Quadrant B Data is divided into 100 sec bins |
 |
 |
| Module-wise count rates for Quadrant C Data is divided into 100 sec bins |
 |
 |
| Module-wise count rates for Quadrant D Data is divided into 100 sec bins |
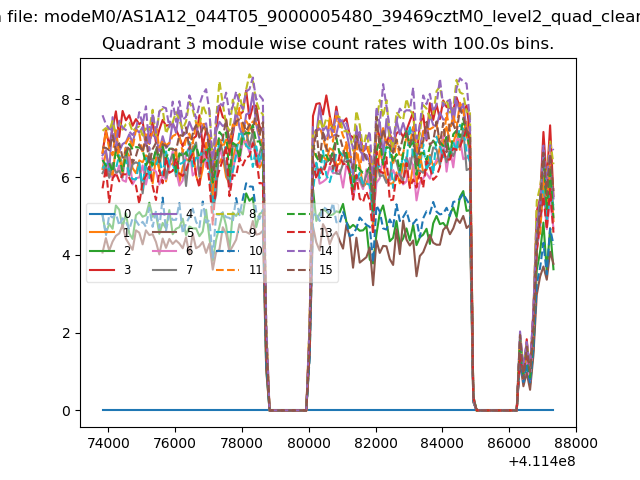 |
 |
| Parameter | Plot |
|---|---|
| CZT HV Monitor | 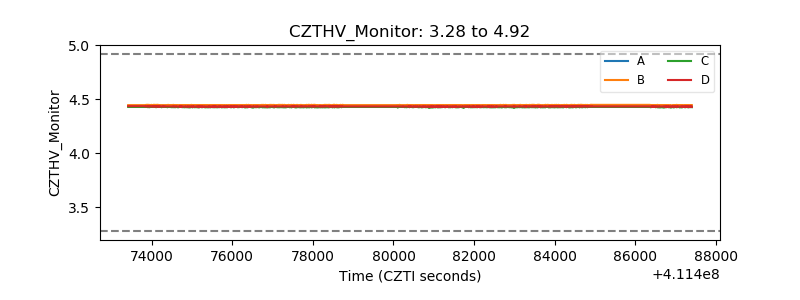 |
| D_VDD | 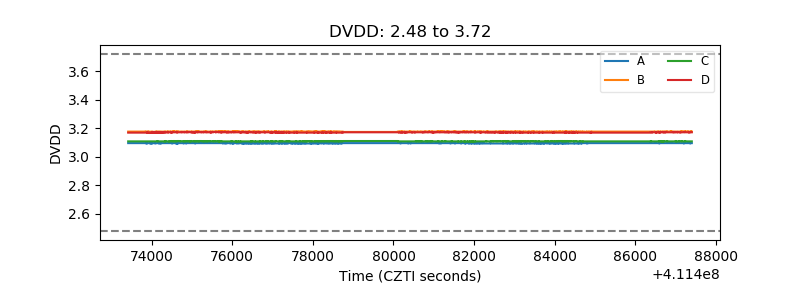 |
| Temperature 1 | 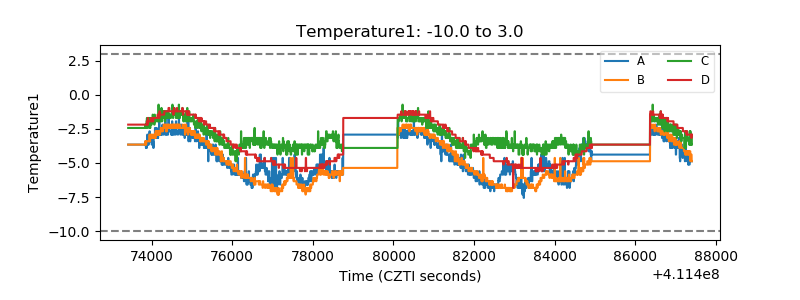 |
| Veto HV Monitor | 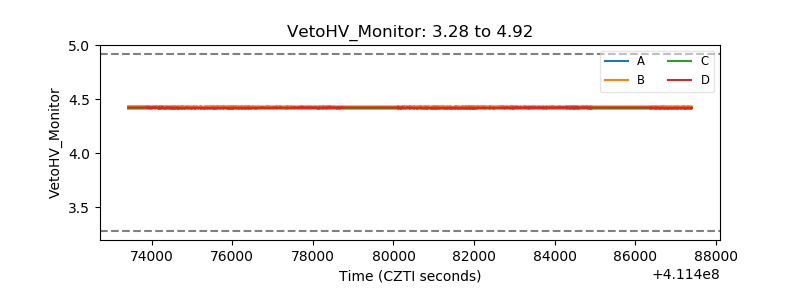 |
| Veto LLD | 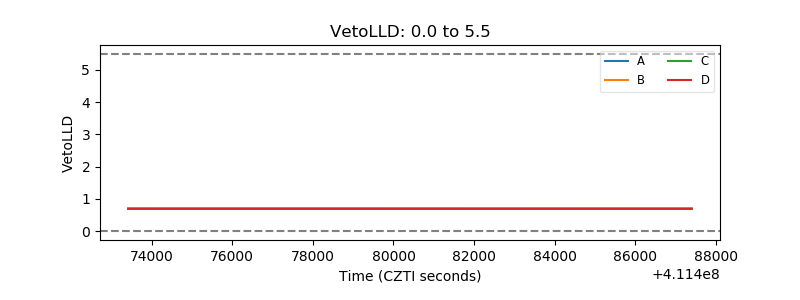 |
| Alpha Counter | 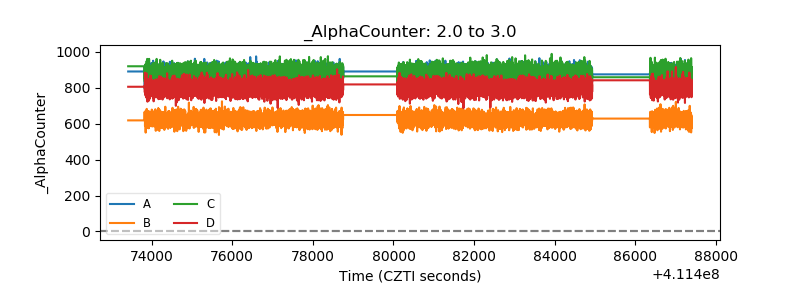 |
| _CPM_Rate | 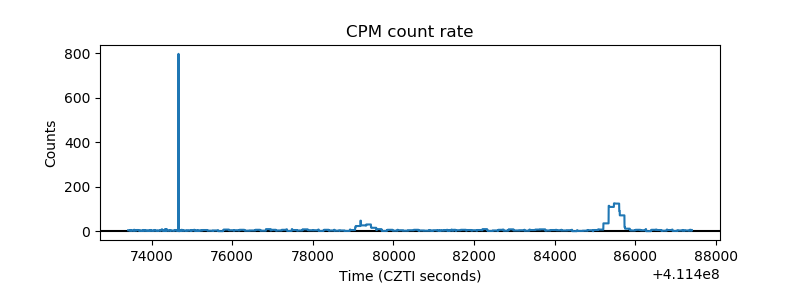 |
| CZT Counter | 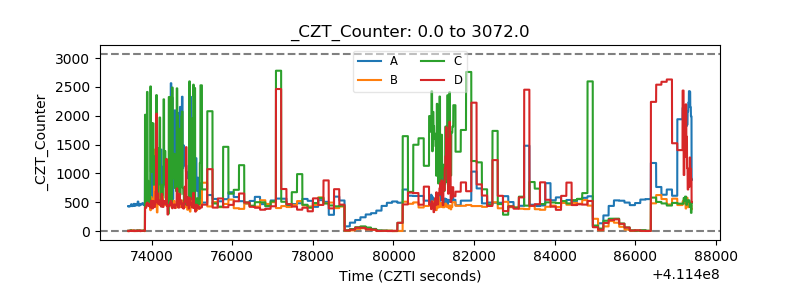 |
| +2.5 Volts monitor | 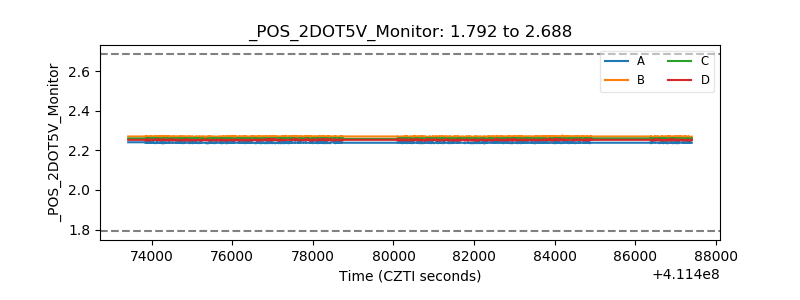 |
| +5 Volts monitor | 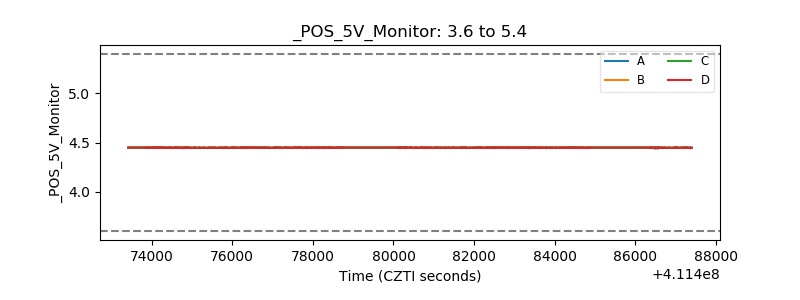 |
| _ROLL_ROT | 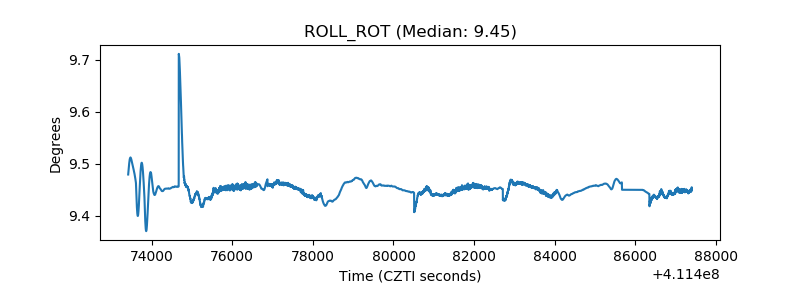 |
| _Roll_DEC | 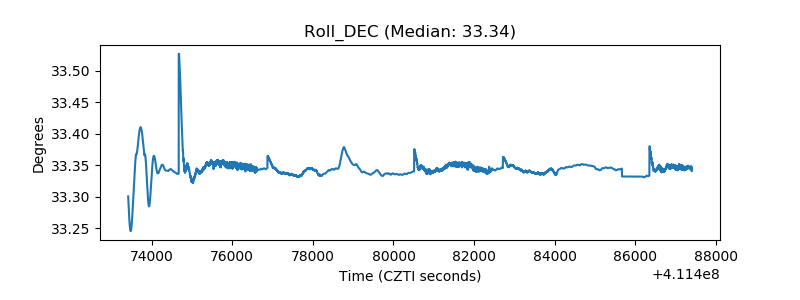 |
| _Roll_RA | 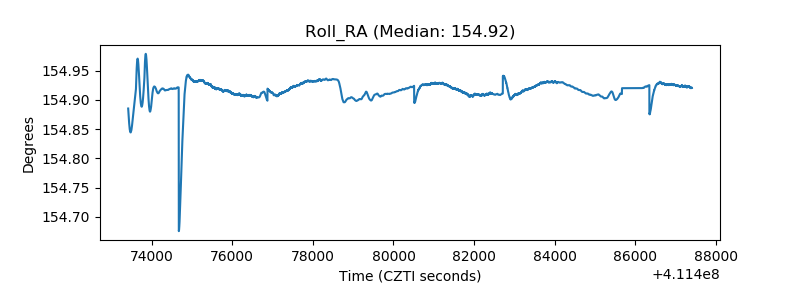 |
| Veto Counter | 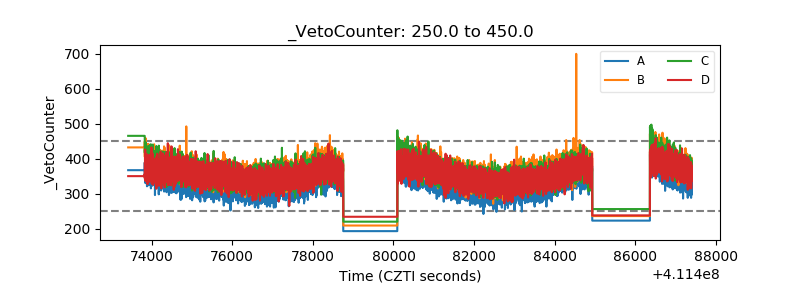 |