| Param | Original file | Final file |
|---|---|---|
| Filename | modeM0/AS1A12_044T05_9000005480_39470cztM0_level2.fits | modeM0/AS1A12_044T05_9000005480_39470cztM0_level2_quad_clean.evt |
| Size (bytes) | 1,229,863,680 | 239,670,720 |
| Size | 1.1 GB | 228.6 MB |
| Events in quadrant A | 12,118,382 | 1,600,935 |
| Events in quadrant B | 7,284,713 | 1,721,795 |
| Events in quadrant C | 13,601,709 | 1,488,154 |
| Events in quadrant D | 11,331,735 | 1,383,858 |
| Mode M9 | |||
|---|---|---|---|
| Quadrant | BADHDUFLAG | Total packets | Discarded packets |
| A | 0 | 49 | 0 |
| B | 0 | 49 | 0 |
| C | 0 | 49 | 0 |
| D | 0 | 49 | 0 |
| Mode SS | |||
|---|---|---|---|
| Quadrant | BADHDUFLAG | Total packets | Discarded packets |
| A | 0 | 314 | 0 |
| B | 0 | 314 | 0 |
| C | 0 | 314 | 0 |
| D | 0 | 314 | 0 |
| Mode M0 | |||
|---|---|---|---|
| Quadrant | BADHDUFLAG | Total packets | Discarded packets |
| A | 0 | 45696 | 5 |
| B | 0 | 32075 | 4 |
| C | 0 | 50528 | 4 |
| D | 0 | 44371 | 4 |
| Quadrant | Total seconds | Saturated seconds | Saturation percentage |
|---|---|---|---|
| A | 15382 | 852 | 5.538942% |
| B | 15382 | 72 | 0.468080% |
| C | 15382 | 1570 | 10.206735% |
| D | 15382 | 1220 | 7.931348% |
Noise dominated data is calculated using 1-second bins in cleaned event files. If a bin has >2000 counts, and if more than 50% of those come from <1% of pixels, then it is considered to be noise-dominated and hence unusable.
| Quadrant | # 1 sec bins | Bins with >0 counts | Bins with >2000 counts | High rate bins dominated by noise | Noise dominated (total time) | Noise dominated (detector-on time) | Marked lightcurve |
|---|---|---|---|---|---|---|---|
| A | 19711 | 15385 | 658 | 658 | 3.34% | 4.28% | 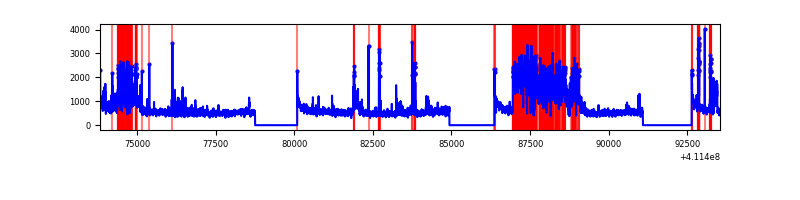 |
| B | 19711 | 15385 | 30 | 30 | 0.15% | 0.19% | 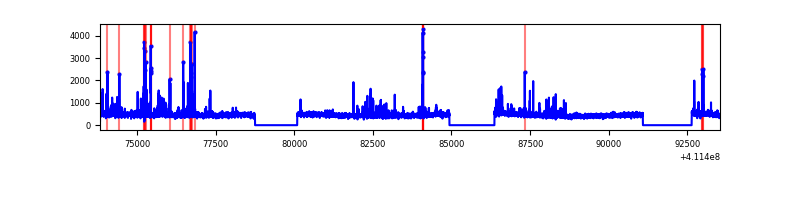 |
| C | 19711 | 15385 | 1208 | 1208 | 6.13% | 7.85% |  |
| D | 19711 | 15385 | 1043 | 1043 | 5.29% | 6.78% | 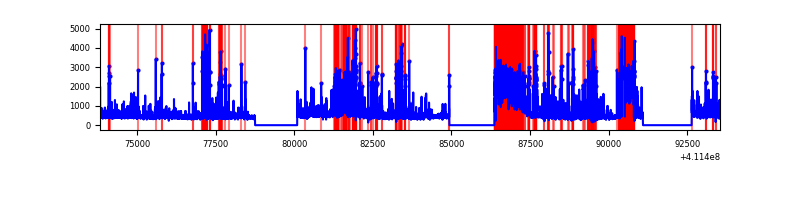 |
Top three noisy pixels from each quadrant. If the there are fewer than three noisy pixels in the level2.evt file, extra rows are filled as -1
| Pixel properties | Quadrant properties | ||||||
|---|---|---|---|---|---|---|---|
| Quadrant | DetID | PixID | Counts | Sigma | Mean | Median | Sigma |
| A | 15 | 222 | 3938995 | 11579.46 | 1685 | 1653 | 340.0 |
| A | 10 | 83 | 1110655 | 3261.5 | 1685 | 1653 | 340.0 |
| A | 15 | 174 | 288436 | 843.41 | 1685 | 1653 | 340.0 |
| B | 5 | 255 | 307305 | 937.84 | 1698 | 1650 | 325.9 |
| B | 8 | 3 | 190719 | 580.12 | 1698 | 1650 | 325.9 |
| B | 12 | 111 | 42724 | 126.03 | 1698 | 1650 | 325.9 |
| C | 15 | 208 | 6596945 | 17633.21 | 1607 | 1615 | 374.0 |
| C | 15 | 214 | 620272 | 1654.03 | 1607 | 1615 | 374.0 |
| C | 9 | 187 | 93076 | 244.53 | 1607 | 1615 | 374.0 |
| D | 12 | 0 | 1961530 | 4991.38 | 1612 | 1566 | 392.7 |
| D | 13 | 249 | 1588528 | 4041.47 | 1612 | 1566 | 392.7 |
| D | 2 | 249 | 426803 | 1082.94 | 1612 | 1566 | 392.7 |
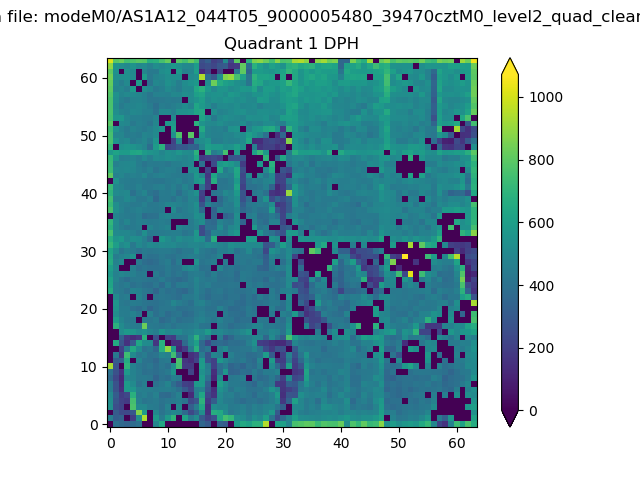
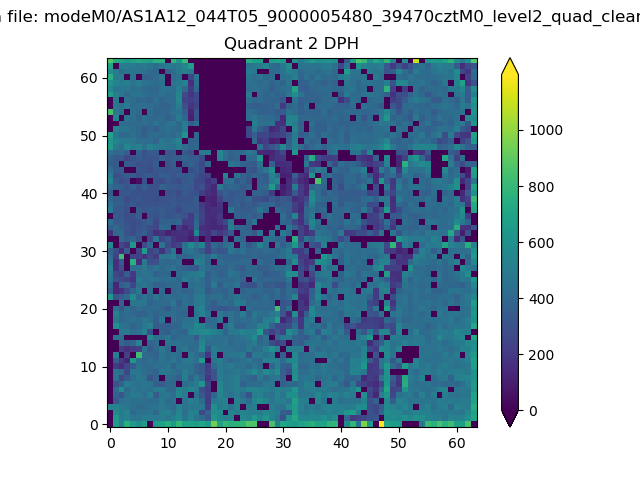
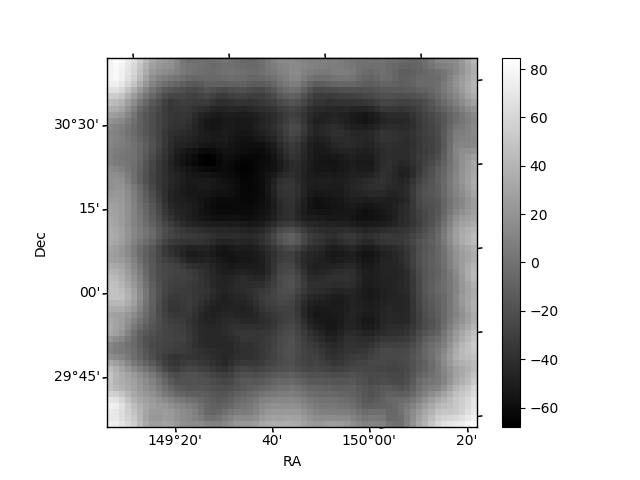
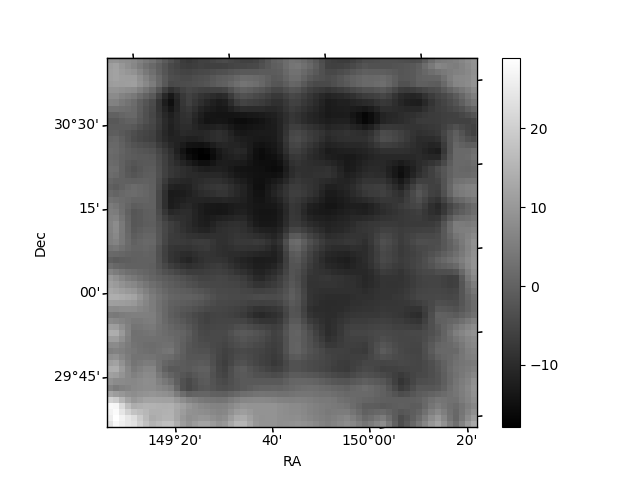
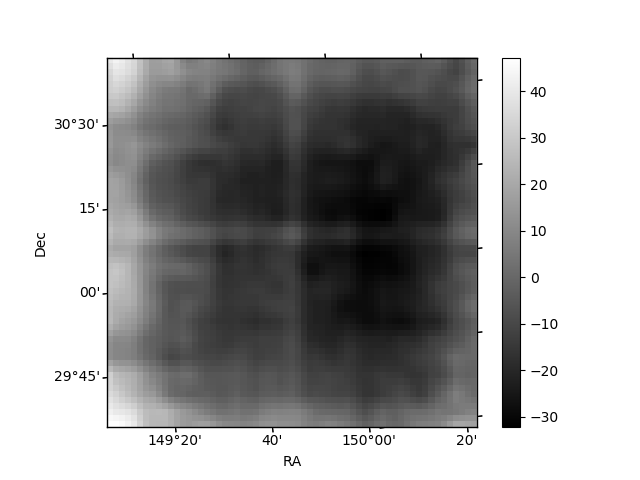
Histogram calculated using DETX and DETY for each event in the final _common_clean file
| Quadrant A | 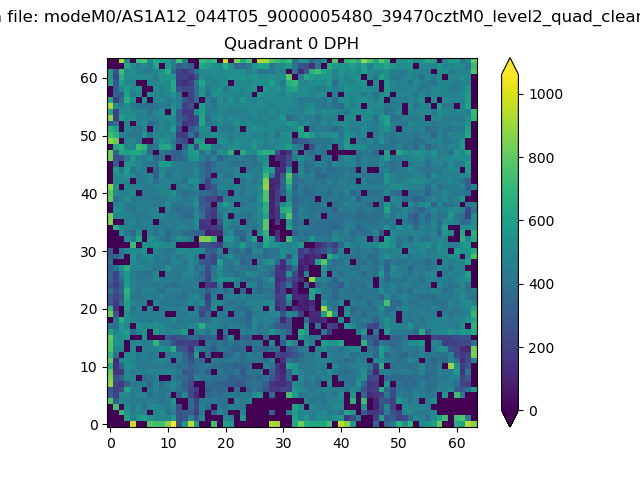 |
 |
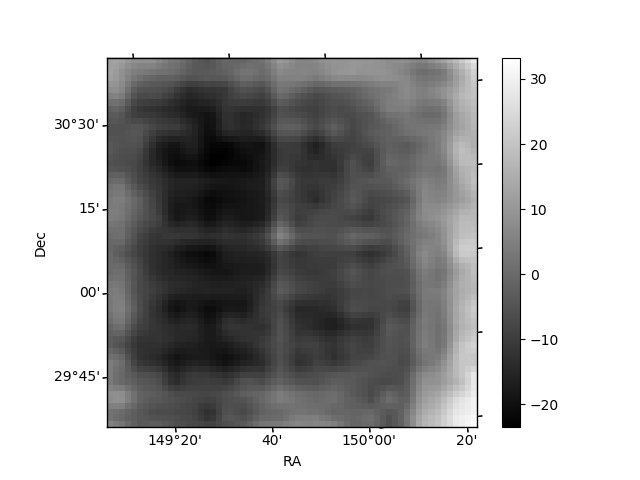
Quadrant B |
|---|---|---|---|
| Quadrant D | 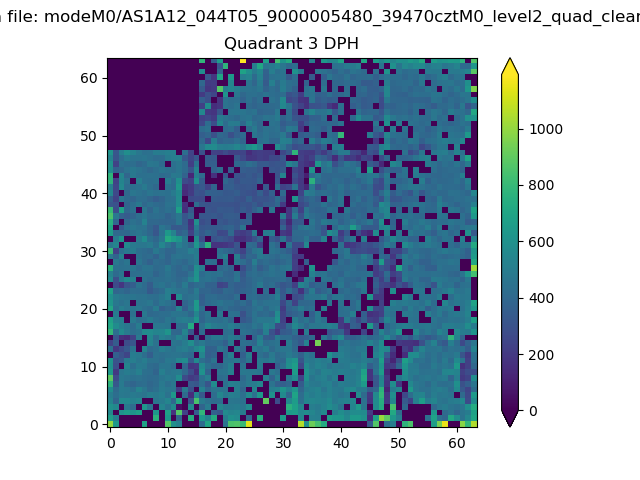 |
 |
Quadrant C |
| Plot type | Count rate plots | Images |
|---|---|---|
| Comparison with Poisson distribution Blue bars denote a histogram of data divided into 1 sec bins. Red curve is a Poisson curve with rate = median count rate of data. |
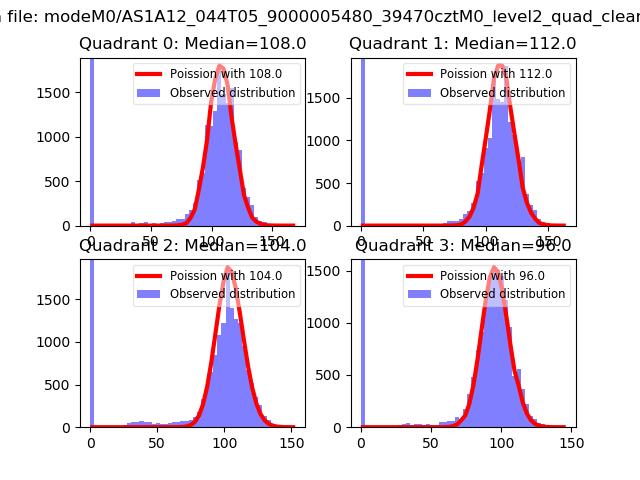 |
 |
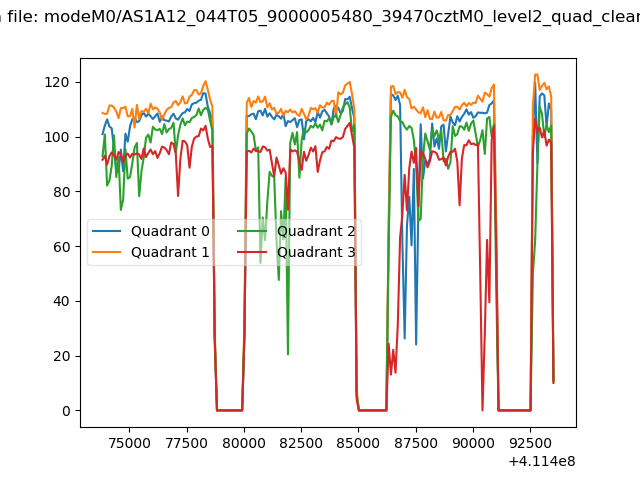
| Quadrant-wise count rates Data is divided into 100 sec bins |
 |
|
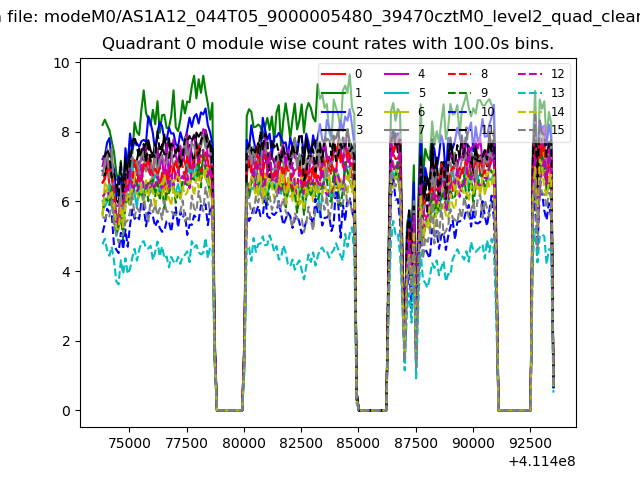
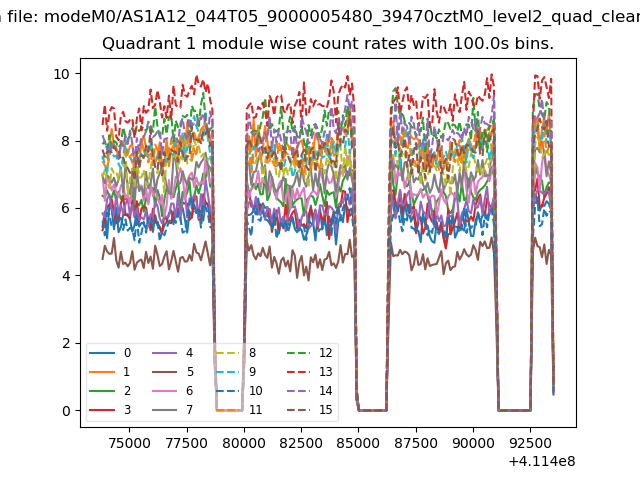
| Module-wise count rates for Quadrant A Data is divided into 100 sec bins |
 |
 |
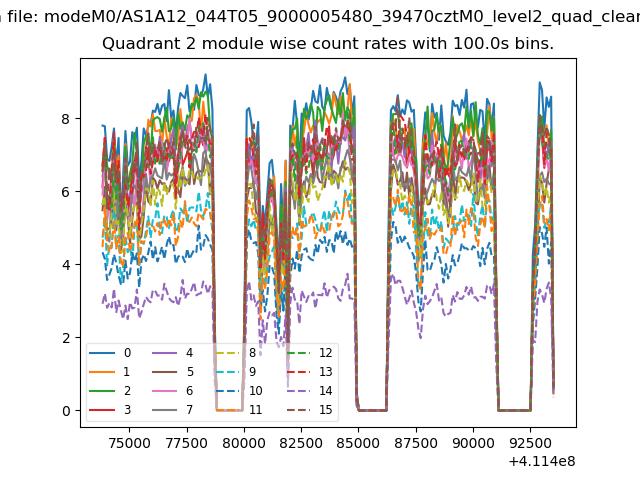
| Module-wise count rates for Quadrant B Data is divided into 100 sec bins |
 |
 |
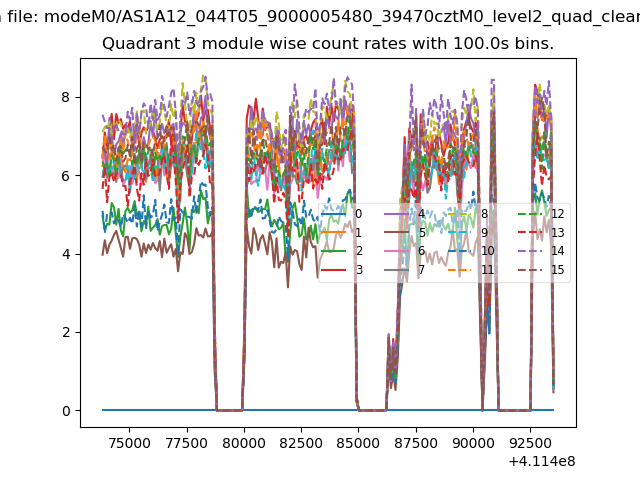
| Module-wise count rates for Quadrant C Data is divided into 100 sec bins |
 |
 |
| Module-wise count rates for Quadrant D Data is divided into 100 sec bins |
 |
 |
| Parameter | Plot |
|---|---|
| CZT HV Monitor | 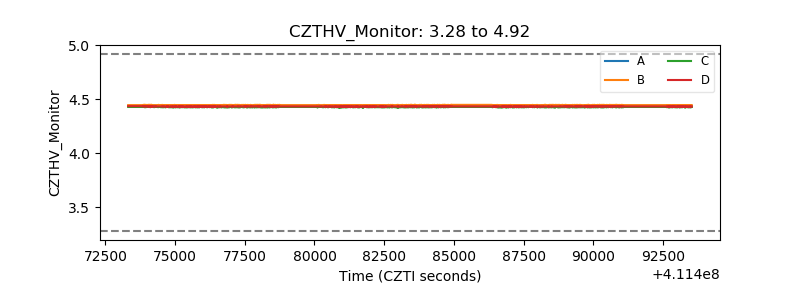 |
| D_VDD | 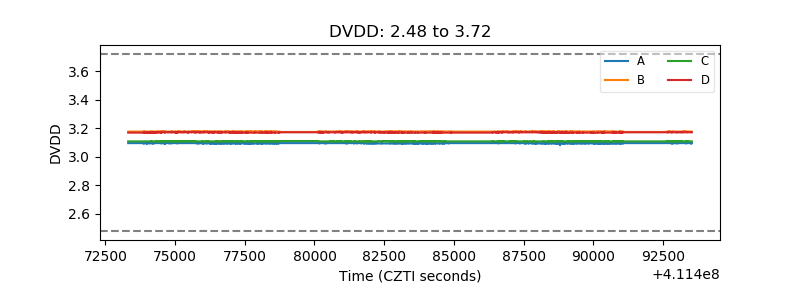 |
| Temperature 1 | 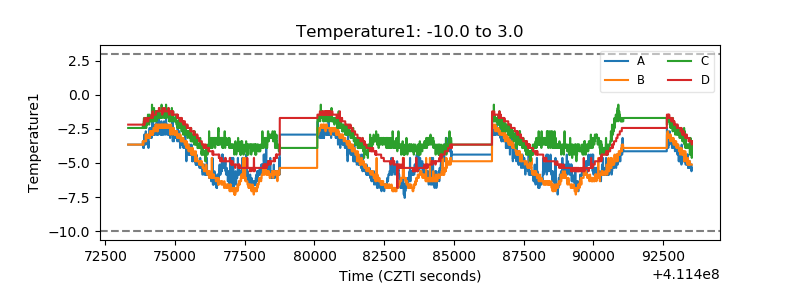 |
| Veto HV Monitor | 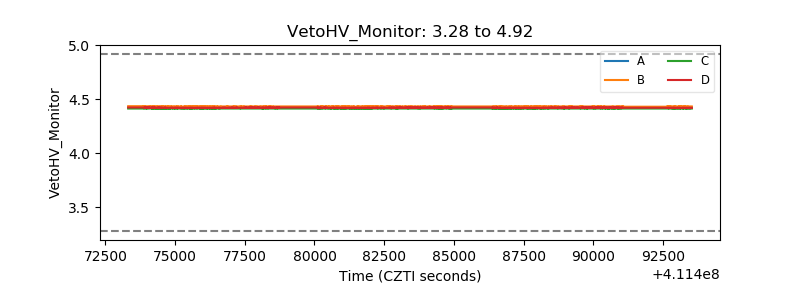 |
| Veto LLD | 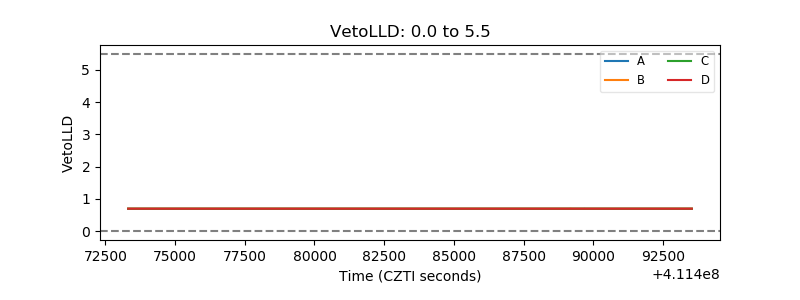 |
| Alpha Counter | 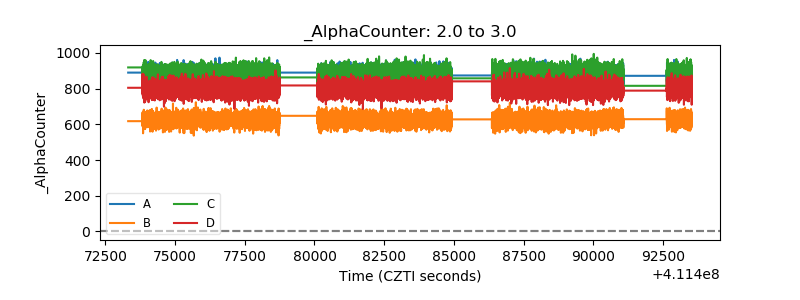 |
| _CPM_Rate | 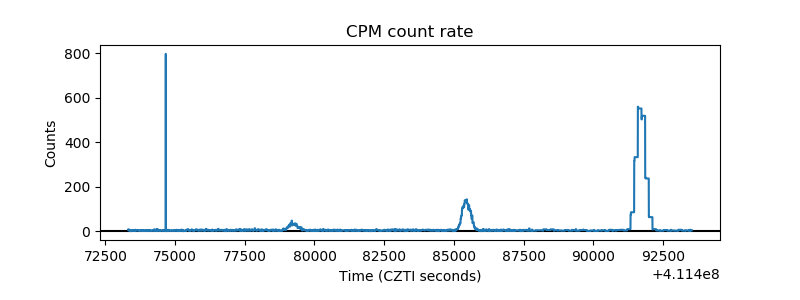 |
| CZT Counter | 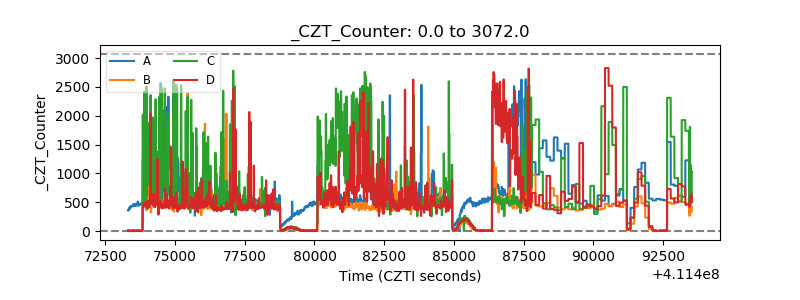 |
| +2.5 Volts monitor | 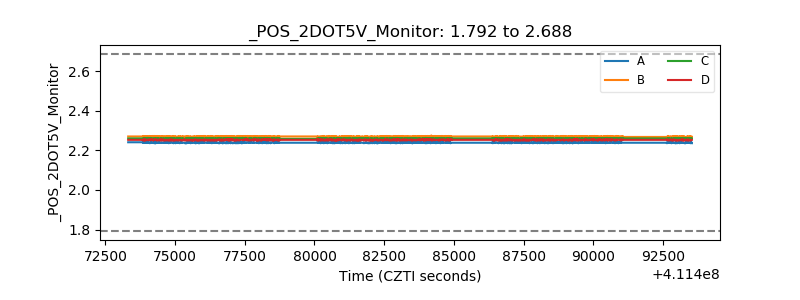 |
| +5 Volts monitor | 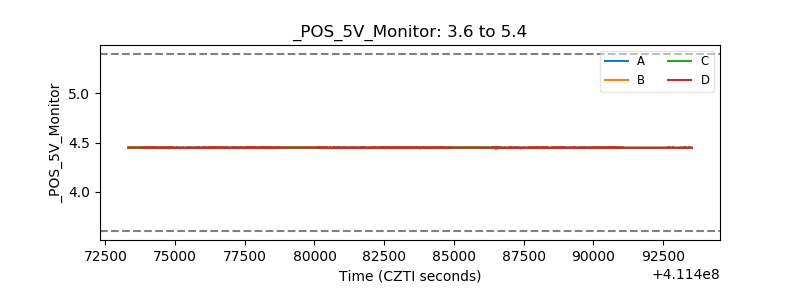 |
| _ROLL_ROT | 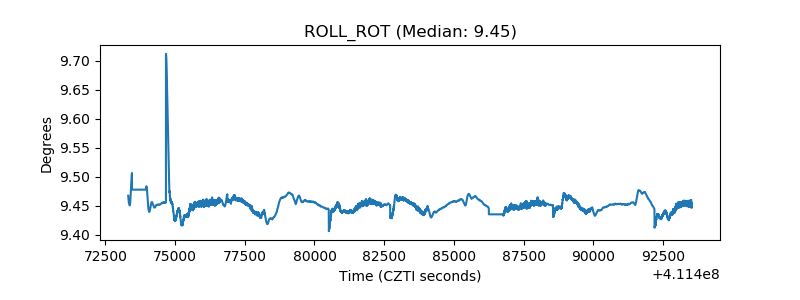 |
| _Roll_DEC | 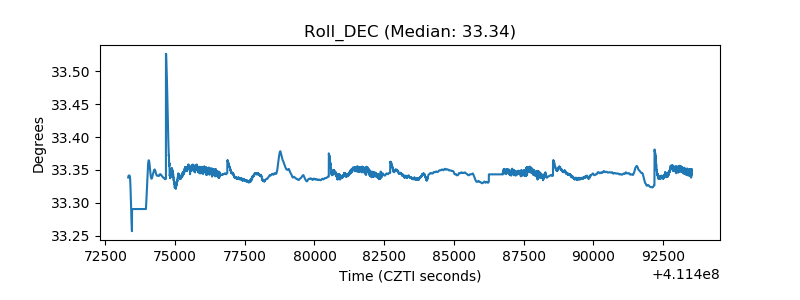 |
| _Roll_RA | 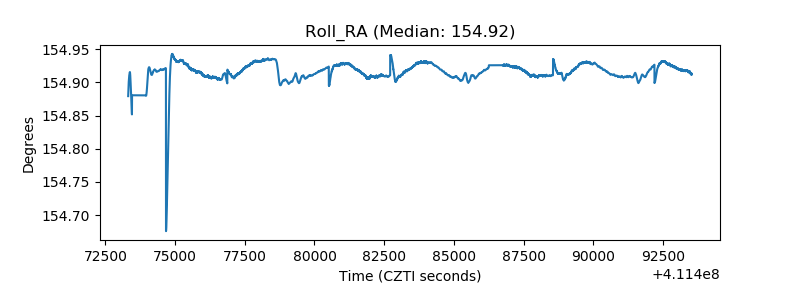 |
| Veto Counter | 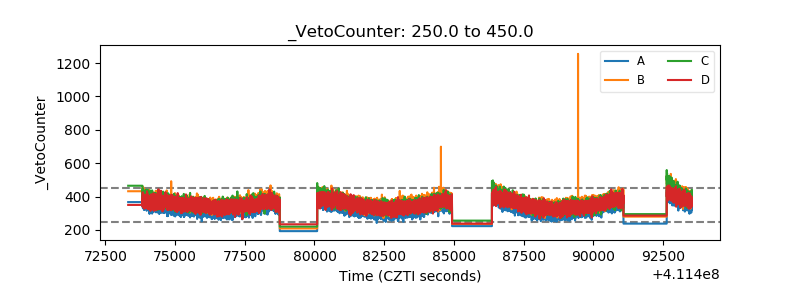 |