| Param | Original file | Final file |
|---|---|---|
| Filename | modeM0/AS1A12_044T05_9000005480_39473cztM0_level2.fits | modeM0/AS1A12_044T05_9000005480_39473cztM0_level2_quad_clean.evt |
| Size (bytes) | 203,250,240 | 37,203,840 |
| Size | 193.8 MB | 35.5 MB |
| Events in quadrant A | 2,930,402 | 207,766 |
| Events in quadrant B | 1,033,795 | 273,411 |
| Events in quadrant C | 1,712,710 | 248,066 |
| Events in quadrant D | 1,667,928 | 233,071 |
| Mode M9 | |||
|---|---|---|---|
| Quadrant | BADHDUFLAG | Total packets | Discarded packets |
| A | 0 | 2 | 0 |
| B | 0 | 2 | 0 |
| C | 0 | 2 | 0 |
| D | 0 | 3 | 0 |
| Mode SS | |||
|---|---|---|---|
| Quadrant | BADHDUFLAG | Total packets | Discarded packets |
| A | 0 | 46 | 0 |
| B | 0 | 46 | 0 |
| C | 0 | 46 | 0 |
| D | 0 | 46 | 0 |
| Mode M0 | |||
|---|---|---|---|
| Quadrant | BADHDUFLAG | Total packets | Discarded packets |
| A | 0 | 10302 | 1 |
| B | 0 | 4663 | 1 |
| C | 0 | 6566 | 1 |
| D | 0 | 6611 | 1 |
| Quadrant | Total seconds | Saturated seconds | Saturation percentage |
|---|---|---|---|
| A | 2277 | 580 | 25.472112% |
| B | 2277 | 11 | 0.483092% |
| C | 2277 | 128 | 5.621432% |
| D | 2277 | 113 | 4.962670% |
Noise dominated data is calculated using 1-second bins in cleaned event files. If a bin has >2000 counts, and if more than 50% of those come from <1% of pixels, then it is considered to be noise-dominated and hence unusable.
| Quadrant | # 1 sec bins | Bins with >0 counts | Bins with >2000 counts | High rate bins dominated by noise | Noise dominated (total time) | Noise dominated (detector-on time) | Marked lightcurve |
|---|---|---|---|---|---|---|---|
| A | 2277 | 2277 | 527 | 527 | 23.14% | 23.14% | 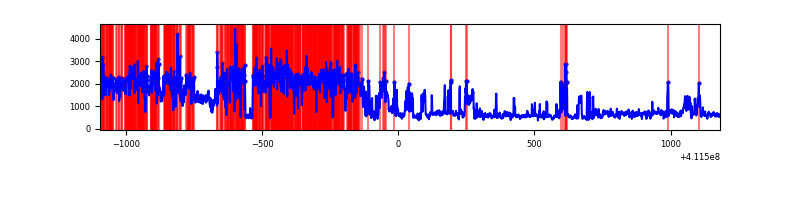 |
| B | 2277 | 2277 | 6 | 6 | 0.26% | 0.26% | 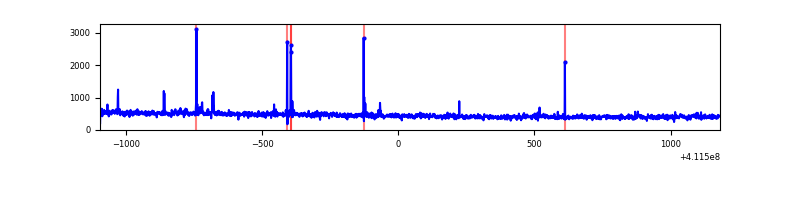 |
| C | 2277 | 2277 | 90 | 90 | 3.95% | 3.95% | 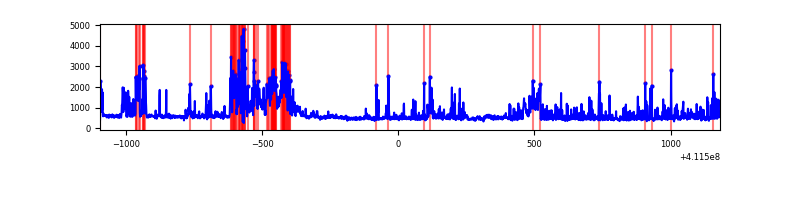 |
| D | 2277 | 2277 | 94 | 94 | 4.13% | 4.13% | 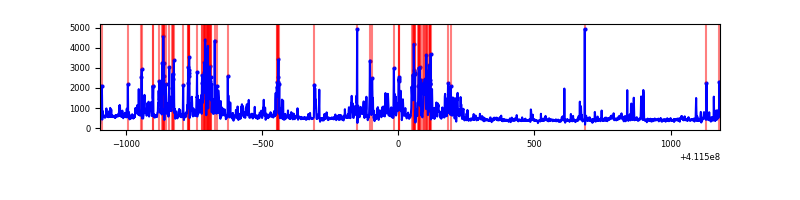 |
Top three noisy pixels from each quadrant. If the there are fewer than three noisy pixels in the level2.evt file, extra rows are filled as -1
| Pixel properties | Quadrant properties | ||||||
|---|---|---|---|---|---|---|---|
| Quadrant | DetID | PixID | Counts | Sigma | Mean | Median | Sigma |
| A | 15 | 222 | 1840493 | 37860.13 | 229 | 225 | 48.6 |
| A | 10 | 83 | 177655 | 3650.3 | 229 | 225 | 48.6 |
| A | 9 | 143 | 8336 | 166.87 | 229 | 225 | 48.6 |
| B | 8 | 3 | 32779 | 649.31 | 250 | 243 | 50.1 |
| B | 0 | 230 | 10310 | 200.9 | 250 | 243 | 50.1 |
| B | 12 | 111 | 5924 | 113.37 | 250 | 243 | 50.1 |
| C | 15 | 208 | 524252 | 8962.31 | 243 | 245 | 58.5 |
| C | 9 | 187 | 123330 | 2105.17 | 243 | 245 | 58.5 |
| C | 15 | 214 | 96237 | 1641.79 | 243 | 245 | 58.5 |
| D | 12 | 0 | 400044 | 6627.89 | 239 | 232 | 60.3 |
| D | 12 | 227 | 136606 | 2260.74 | 239 | 232 | 60.3 |
| D | 13 | 249 | 69948 | 1155.72 | 239 | 232 | 60.3 |
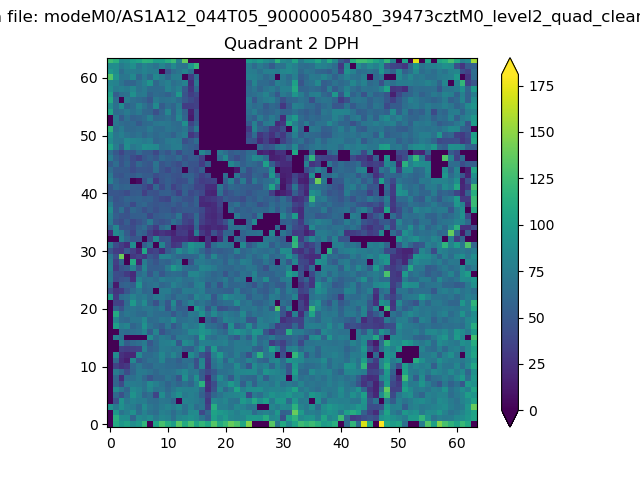
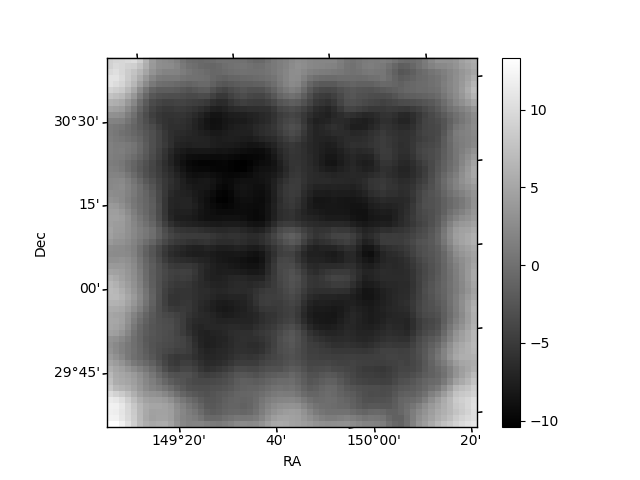
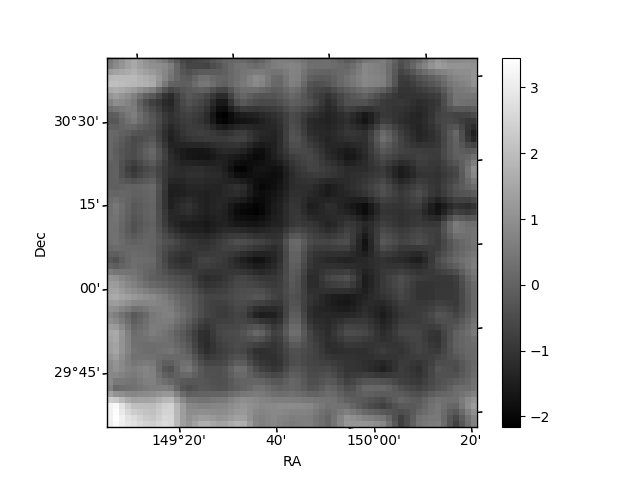
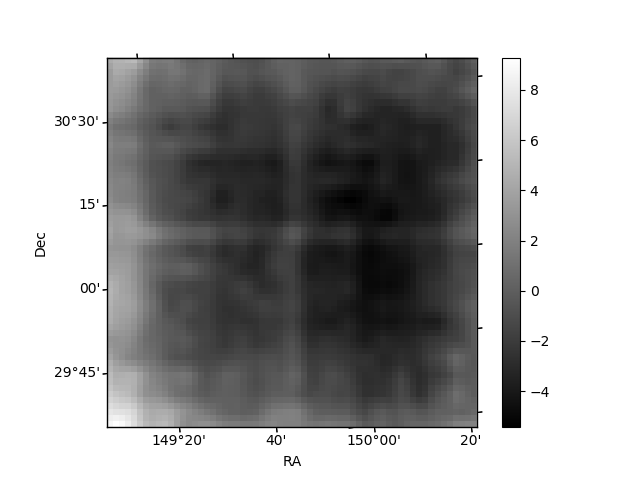
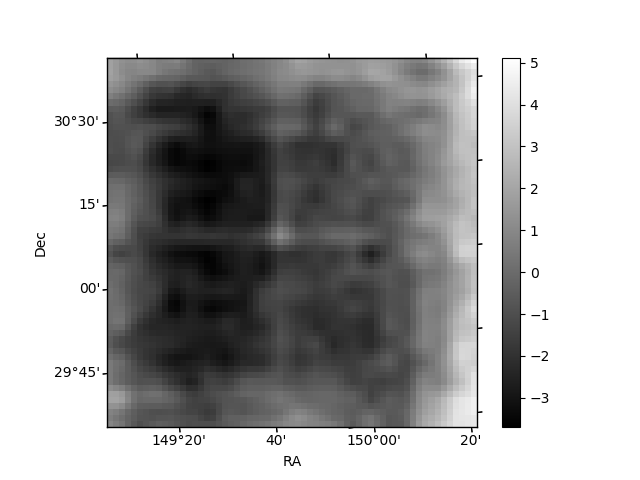
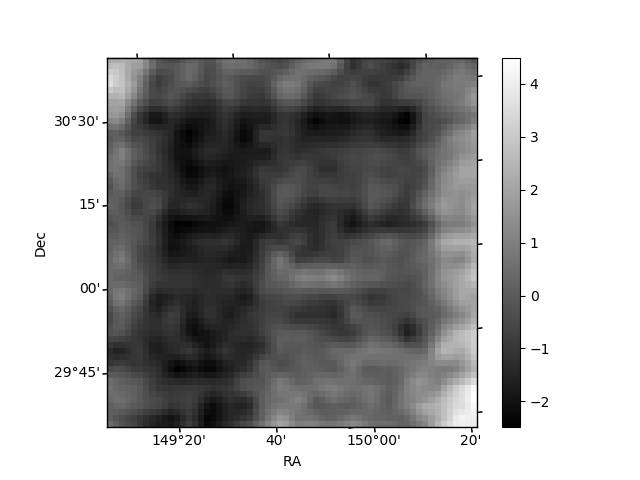
Histogram calculated using DETX and DETY for each event in the final _common_clean file
| Quadrant A | 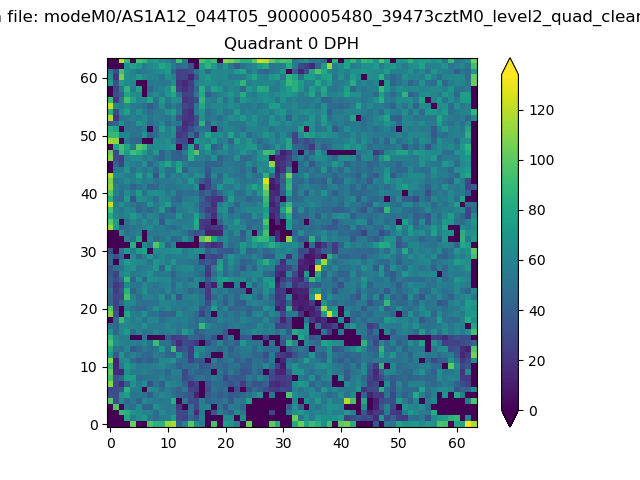 |
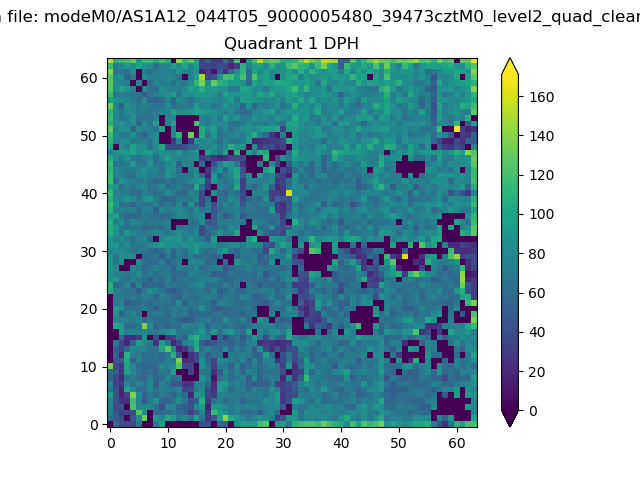 |
Quadrant B |
|---|---|---|---|
| Quadrant D | 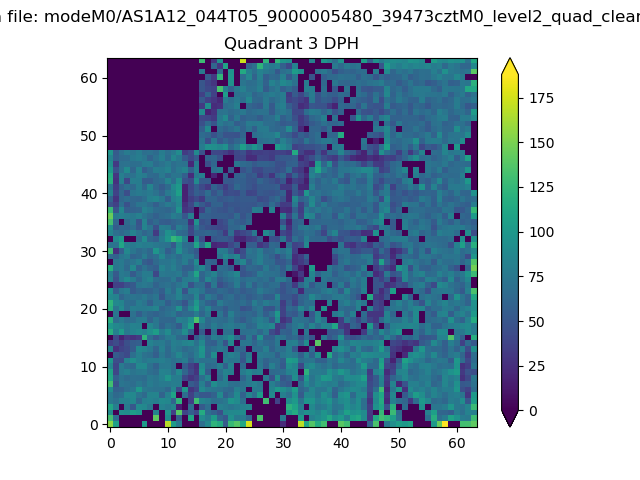 |
 |
Quadrant C |
| Plot type | Count rate plots | Images |
|---|---|---|
| Comparison with Poisson distribution Blue bars denote a histogram of data divided into 1 sec bins. Red curve is a Poisson curve with rate = median count rate of data. |
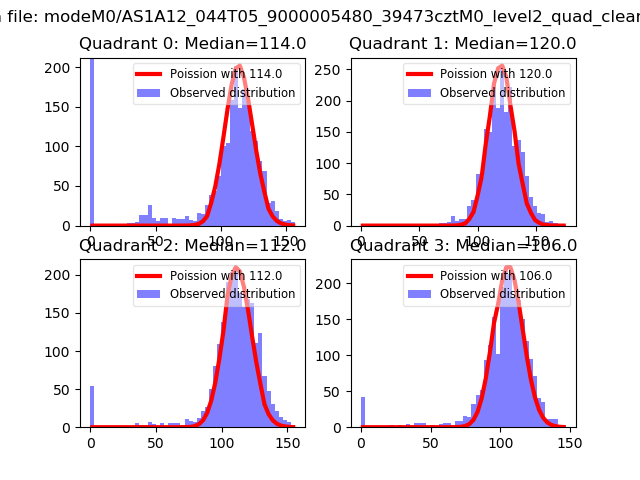 |
 |
| Quadrant-wise count rates Data is divided into 100 sec bins |
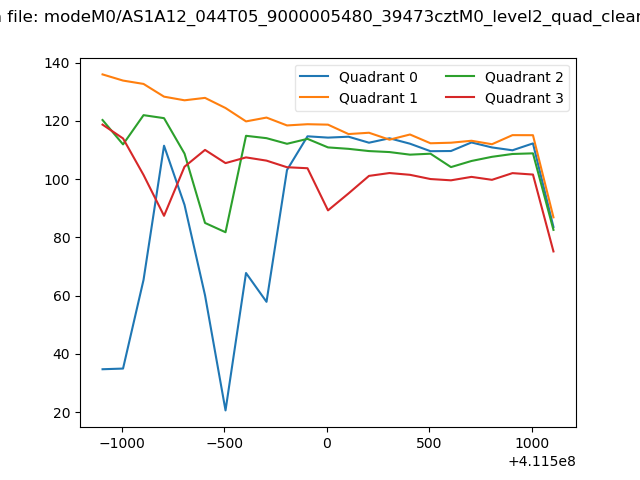 |
|
| Module-wise count rates for Quadrant A Data is divided into 100 sec bins |
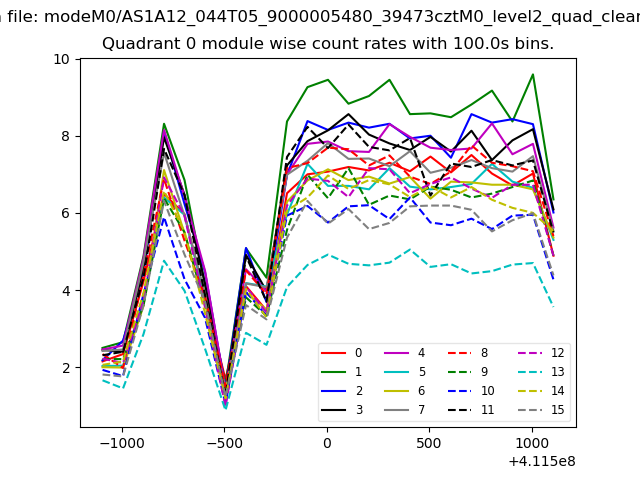 |
 |
| Module-wise count rates for Quadrant B Data is divided into 100 sec bins |
 |
 |
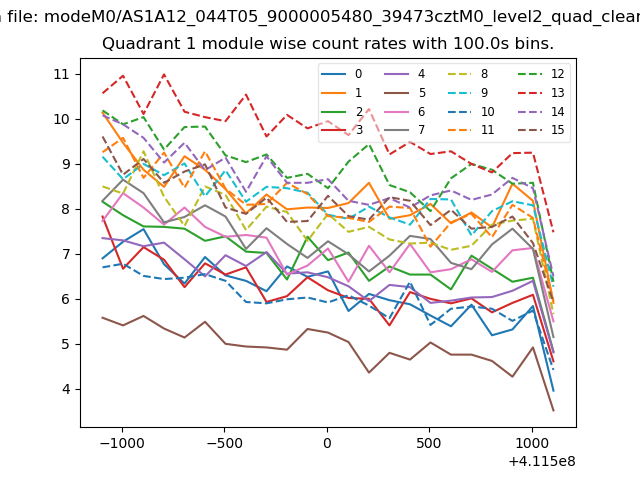
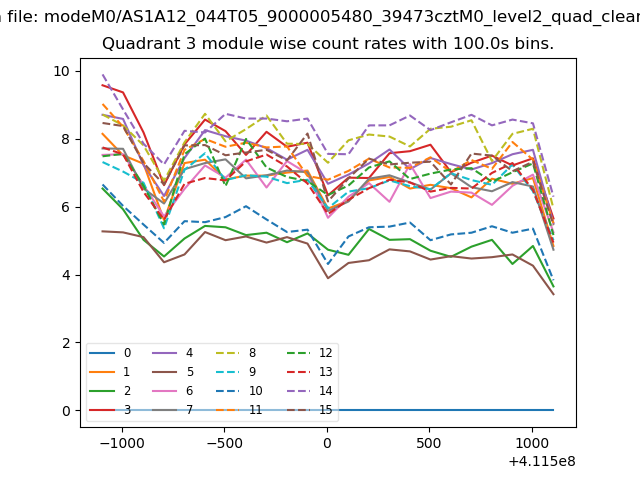
| Module-wise count rates for Quadrant C Data is divided into 100 sec bins |
 |
 |
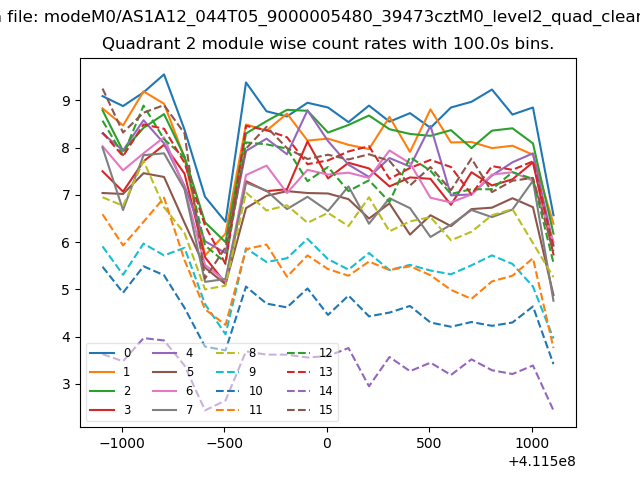
| Module-wise count rates for Quadrant D Data is divided into 100 sec bins |
 |
 |
| Parameter | Plot |
|---|---|
| CZT HV Monitor | 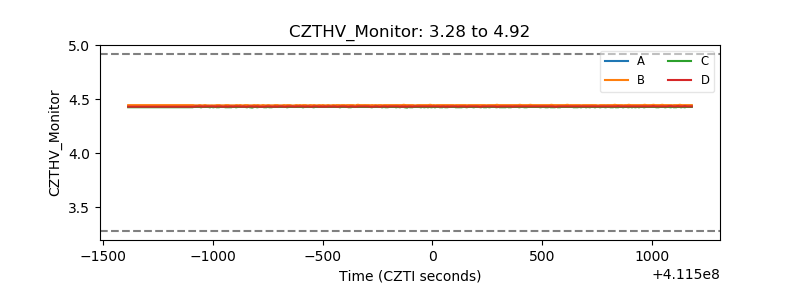 |
| D_VDD | 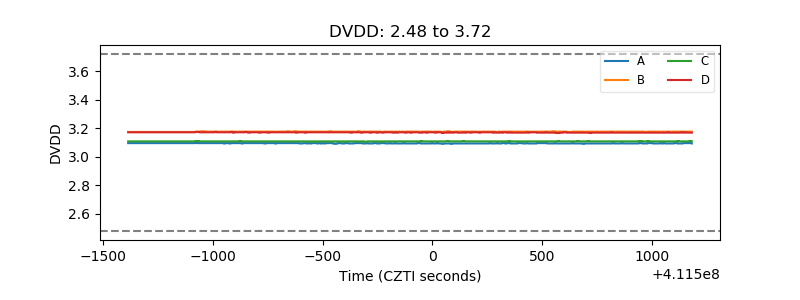 |
| Temperature 1 | 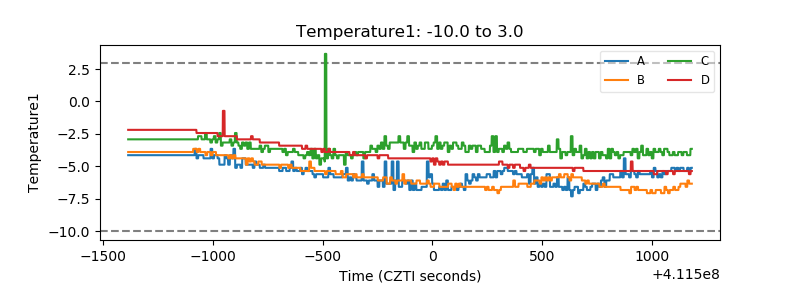 |
| Veto HV Monitor | 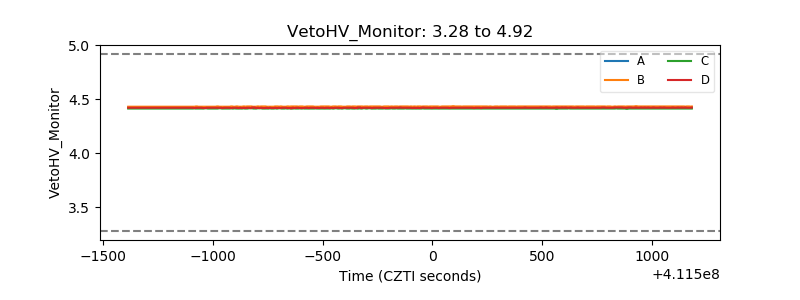 |
| Veto LLD | 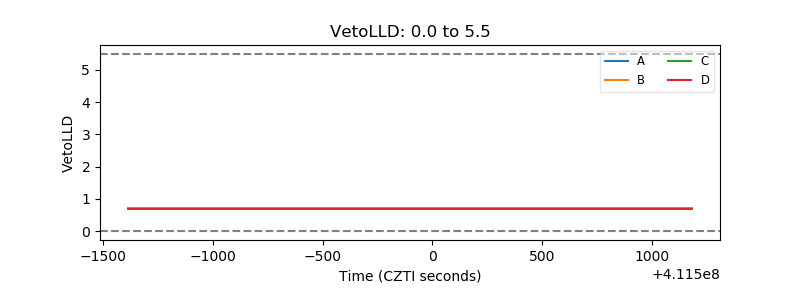 |
| Alpha Counter | 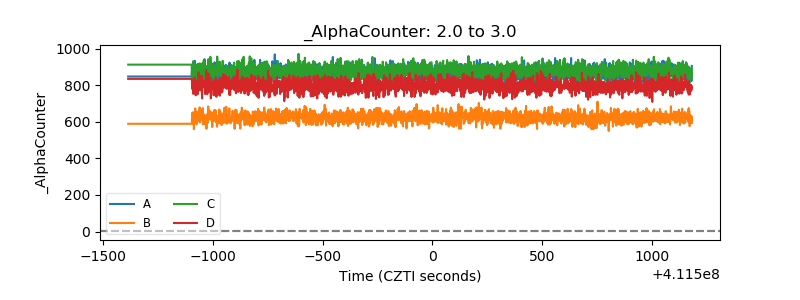 |
| _CPM_Rate | 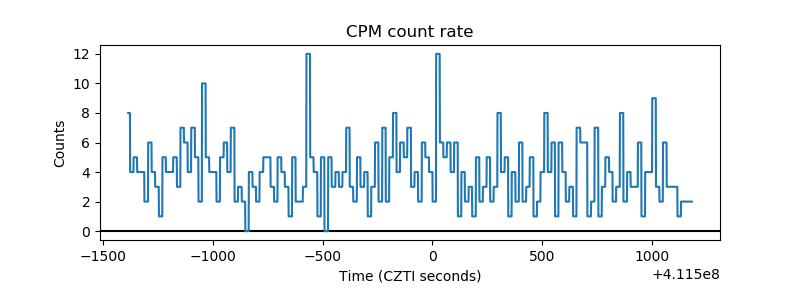 |
| CZT Counter | 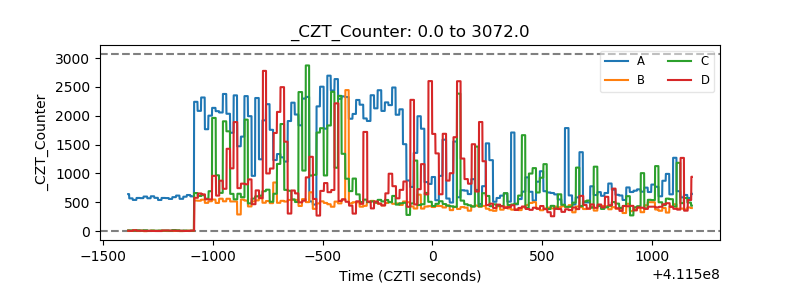 |
| +2.5 Volts monitor | 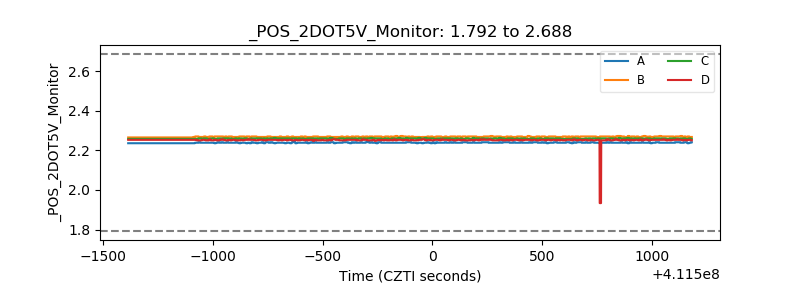 |
| +5 Volts monitor | 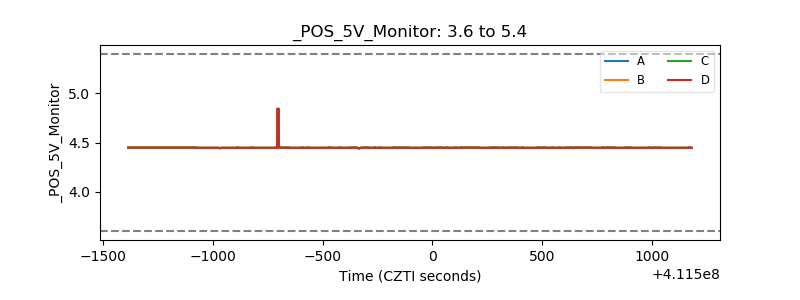 |
| _ROLL_ROT | 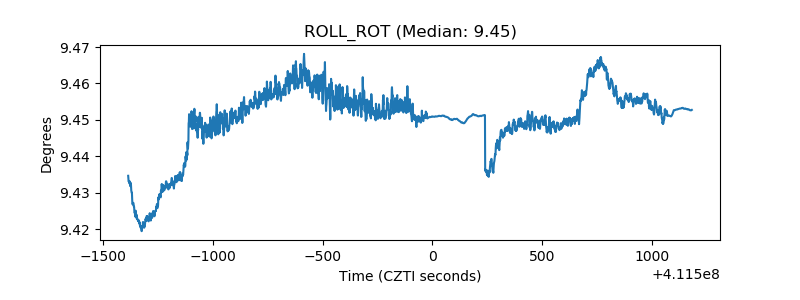 |
| _Roll_DEC | 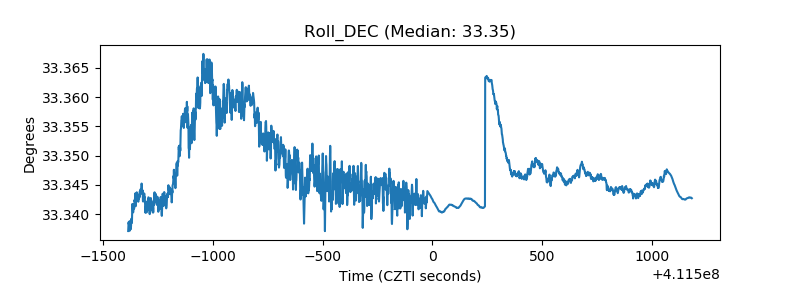 |
| _Roll_RA | 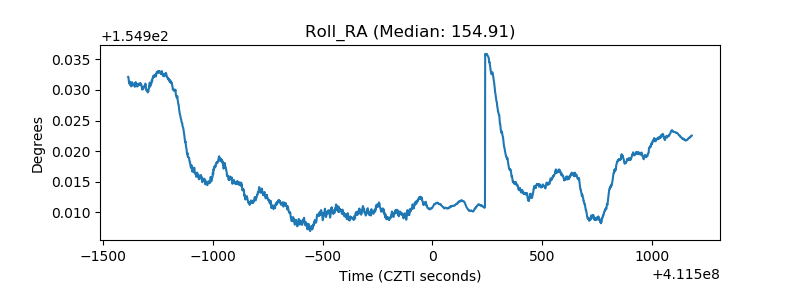 |
| Veto Counter | 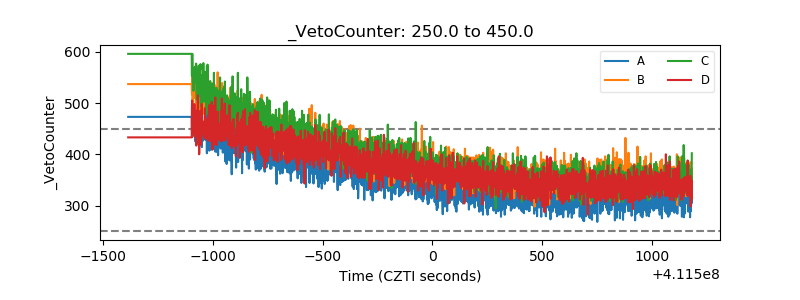 |