| Param | Original file | Final file |
|---|---|---|
| Filename | modeM0/AS1A12_088T26_9000005482_39473cztM0_level2.fits | modeM0/AS1A12_088T26_9000005482_39473cztM0_level2_quad_clean.evt |
| Size (bytes) | 141,750,720 | 31,423,680 |
| Size | 135.2 MB | 30.0 MB |
| Events in quadrant A | 1,329,292 | 212,921 |
| Events in quadrant B | 1,021,665 | 218,338 |
| Events in quadrant C | 1,522,284 | 199,605 |
| Events in quadrant D | 1,232,561 | 190,025 |
| Mode SS | |||
|---|---|---|---|
| Quadrant | BADHDUFLAG | Total packets | Discarded packets |
| A | 0 | 38 | 0 |
| B | 0 | 38 | 0 |
| C | 0 | 38 | 0 |
| D | 0 | 38 | 0 |
| Mode M9 | |||
|---|---|---|---|
| Quadrant | BADHDUFLAG | Total packets | Discarded packets |
| A | 0 | 18 | 0 |
| B | 0 | 18 | 0 |
| C | 0 | 18 | 0 |
| D | 0 | 18 | 0 |
| Mode M0 | |||
|---|---|---|---|
| Quadrant | BADHDUFLAG | Total packets | Discarded packets |
| A | 0 | 5188 | 2 |
| B | 0 | 4154 | 1 |
| C | 0 | 5672 | 1 |
| D | 0 | 4847 | 1 |
| Quadrant | Total seconds | Saturated seconds | Saturation percentage |
|---|---|---|---|
| A | 1787 | 25 | 1.398993% |
| B | 1787 | 49 | 2.742026% |
| C | 1787 | 151 | 8.449916% |
| D | 1787 | 69 | 3.861220% |
Noise dominated data is calculated using 1-second bins in cleaned event files. If a bin has >2000 counts, and if more than 50% of those come from <1% of pixels, then it is considered to be noise-dominated and hence unusable.
| Quadrant | # 1 sec bins | Bins with >0 counts | Bins with >2000 counts | High rate bins dominated by noise | Noise dominated (total time) | Noise dominated (detector-on time) | Marked lightcurve |
|---|---|---|---|---|---|---|---|
| A | 3609 | 1788 | 22 | 22 | 0.61% | 1.23% | 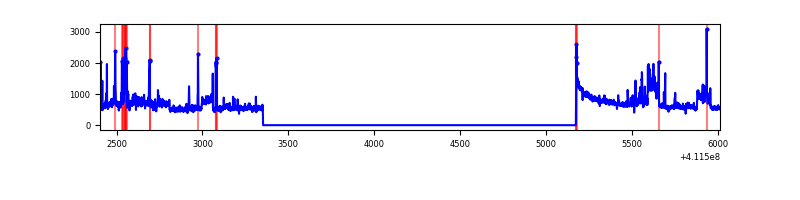 |
| B | 3609 | 1788 | 24 | 24 | 0.67% | 1.34% | 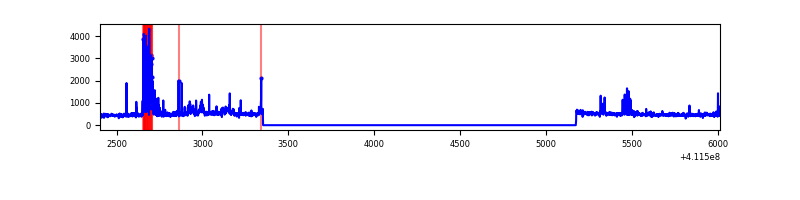 |
| C | 3609 | 1788 | 125 | 125 | 3.46% | 6.99% | 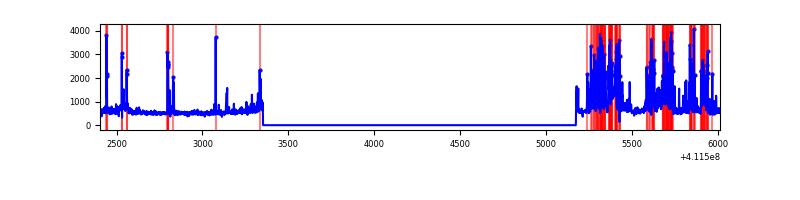 |
| D | 3609 | 1788 | 43 | 43 | 1.19% | 2.40% | 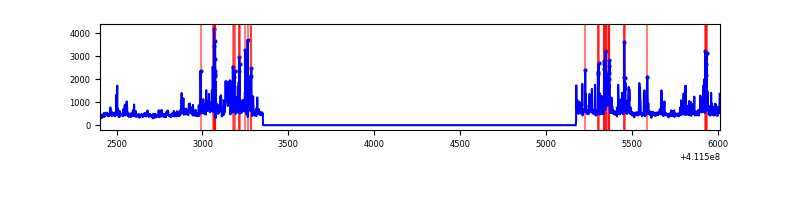 |
Top three noisy pixels from each quadrant. If the there are fewer than three noisy pixels in the level2.evt file, extra rows are filled as -1
| Pixel properties | Quadrant properties | ||||||
|---|---|---|---|---|---|---|---|
| Quadrant | DetID | PixID | Counts | Sigma | Mean | Median | Sigma |
| A | 15 | 222 | 278096 | 6188.55 | 211 | 207 | 44.9 |
| A | 10 | 83 | 183096 | 4072.91 | 211 | 207 | 44.9 |
| A | 2 | 79 | 22006 | 485.46 | 211 | 207 | 44.9 |
| B | 5 | 184 | 149267 | 3518.32 | 209 | 204 | 42.4 |
| B | 8 | 3 | 24781 | 580.09 | 209 | 204 | 42.4 |
| B | 5 | 255 | 12711 | 295.2 | 209 | 204 | 42.4 |
| C | 15 | 208 | 581544 | 12078.12 | 201 | 203 | 48.1 |
| C | 15 | 214 | 74366 | 1540.83 | 201 | 203 | 48.1 |
| C | 9 | 187 | 71955 | 1490.74 | 201 | 203 | 48.1 |
| D | 2 | 249 | 154014 | 3062.57 | 203 | 197 | 50.2 |
| D | 12 | 0 | 89066 | 1769.43 | 203 | 197 | 50.2 |
| D | 12 | 227 | 73241 | 1454.34 | 203 | 197 | 50.2 |
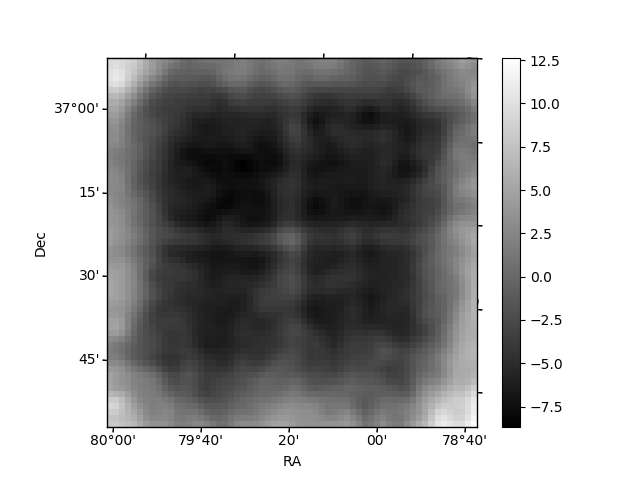
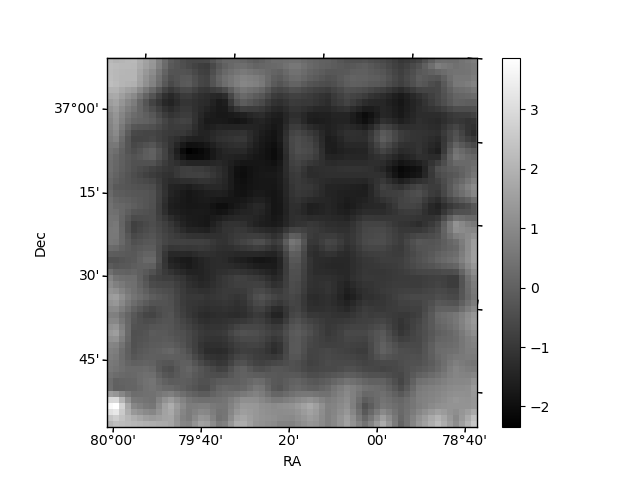
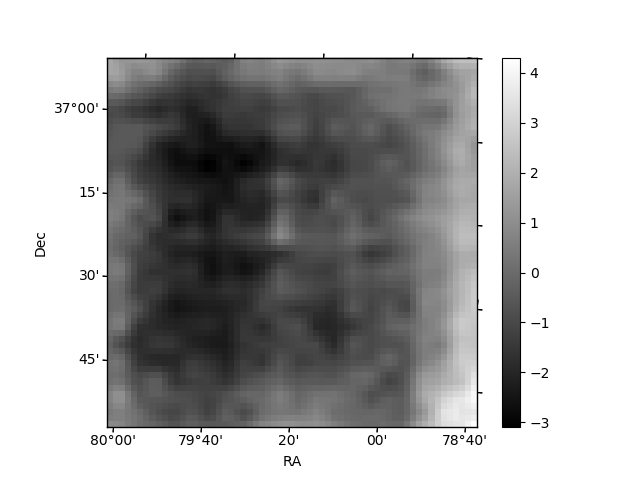
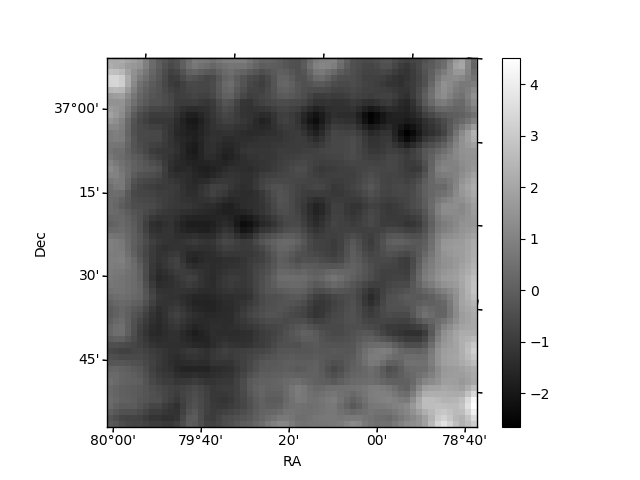
Histogram calculated using DETX and DETY for each event in the final _common_clean file
| Quadrant A | 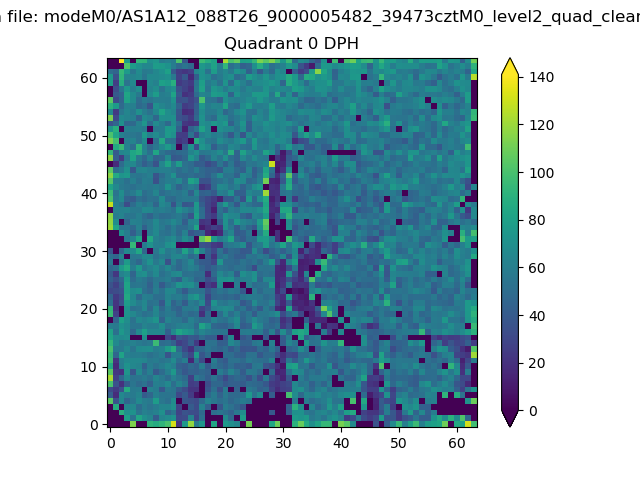 |
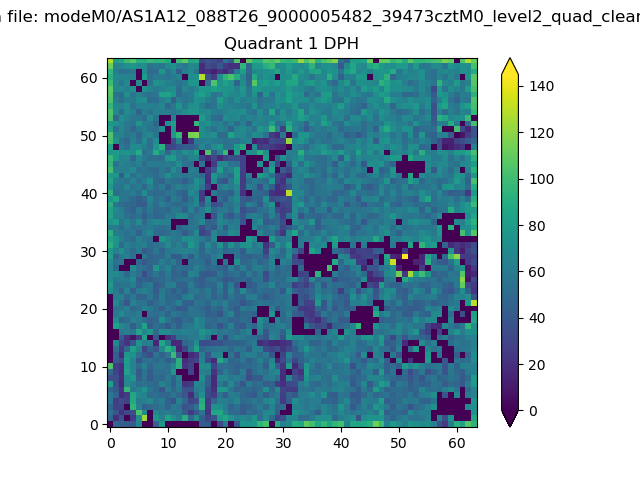 |
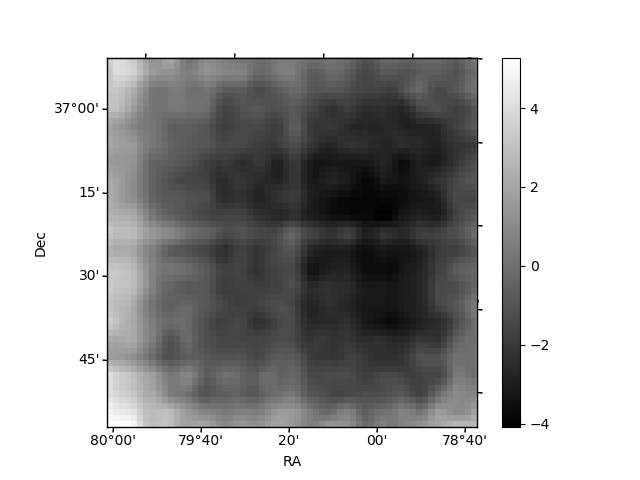
Quadrant B |
|---|---|---|---|
| Quadrant D | 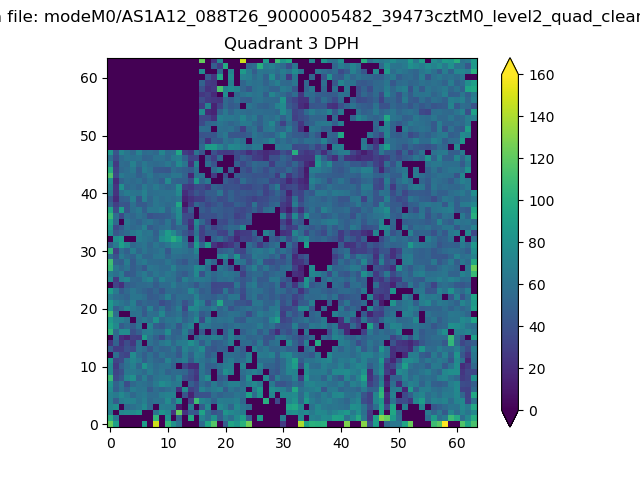 |
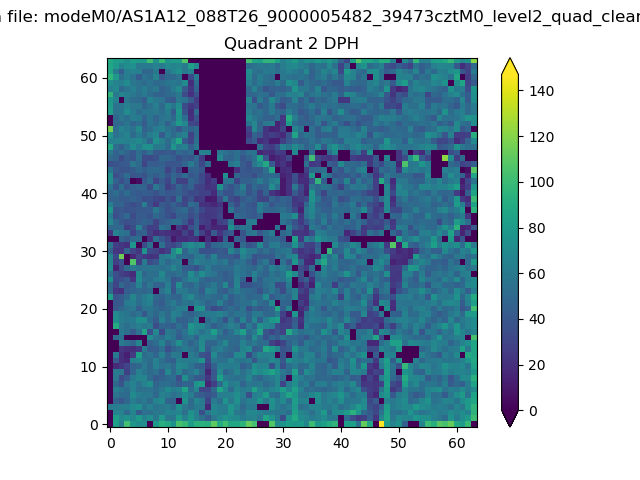 |
Quadrant C |
| Plot type | Count rate plots | Images |
|---|---|---|
| Comparison with Poisson distribution Blue bars denote a histogram of data divided into 1 sec bins. Red curve is a Poisson curve with rate = median count rate of data. |
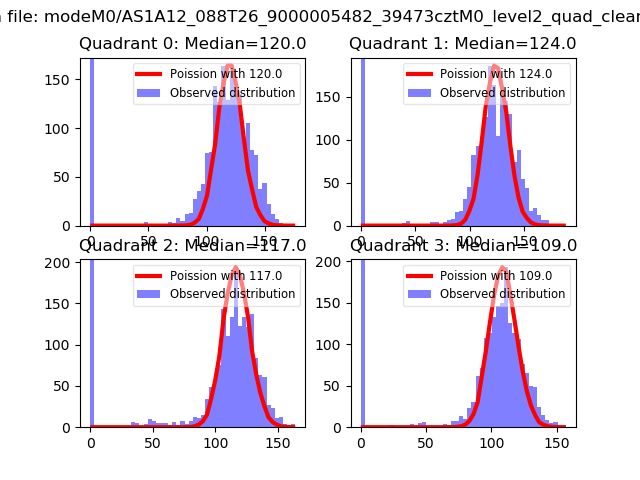 |
 |
| Quadrant-wise count rates Data is divided into 100 sec bins |
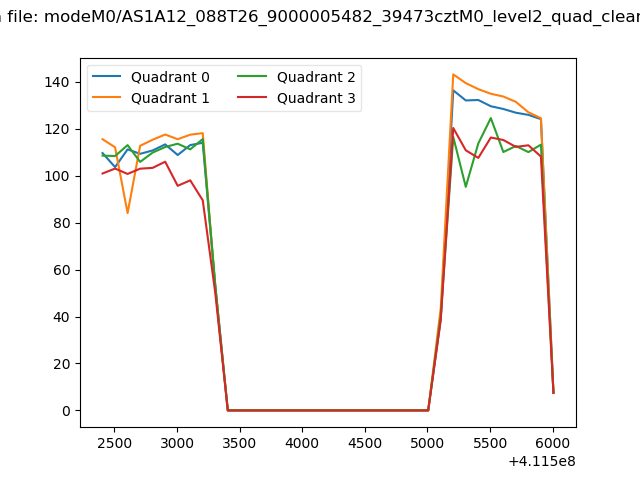 |
|
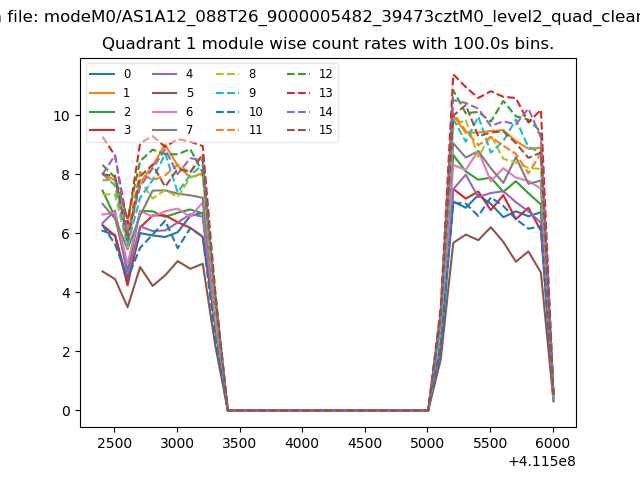
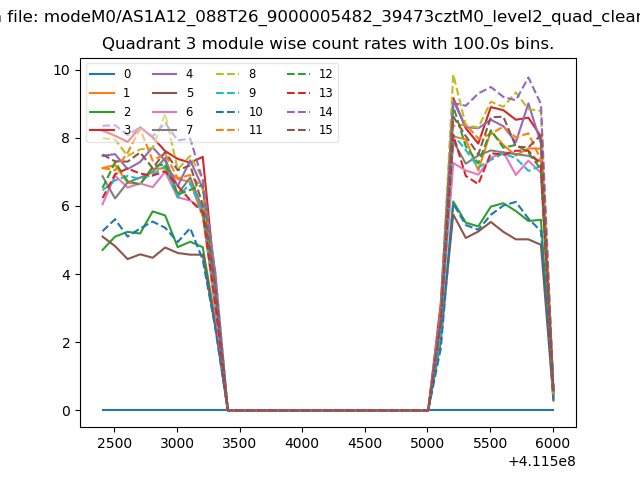
| Module-wise count rates for Quadrant A Data is divided into 100 sec bins |
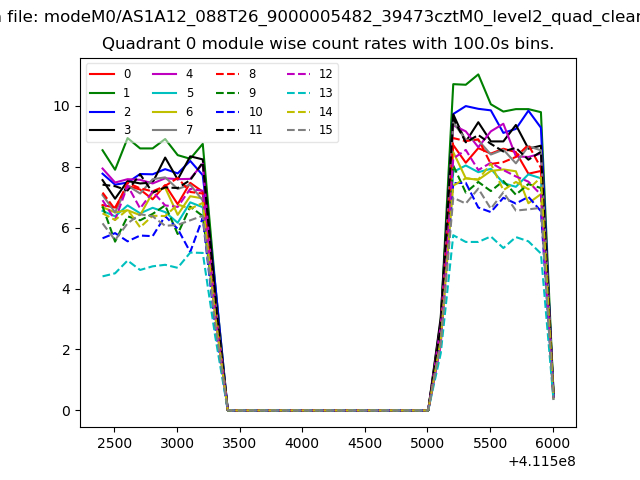 |
 |
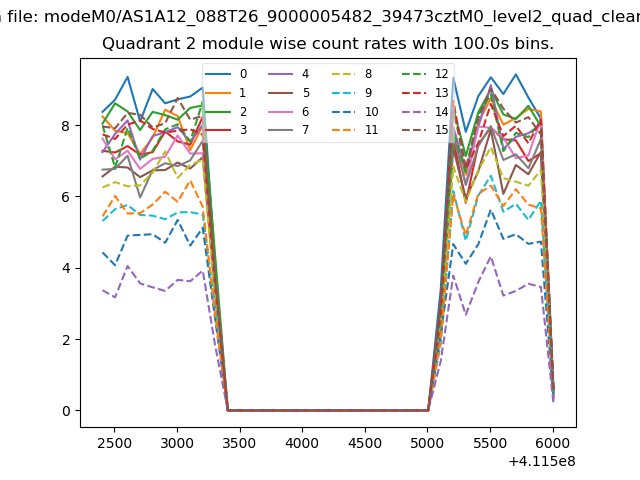
| Module-wise count rates for Quadrant B Data is divided into 100 sec bins |
 |
 |
| Module-wise count rates for Quadrant C Data is divided into 100 sec bins |
 |
 |
| Module-wise count rates for Quadrant D Data is divided into 100 sec bins |
 |
 |
| Parameter | Plot |
|---|---|
| CZT HV Monitor | 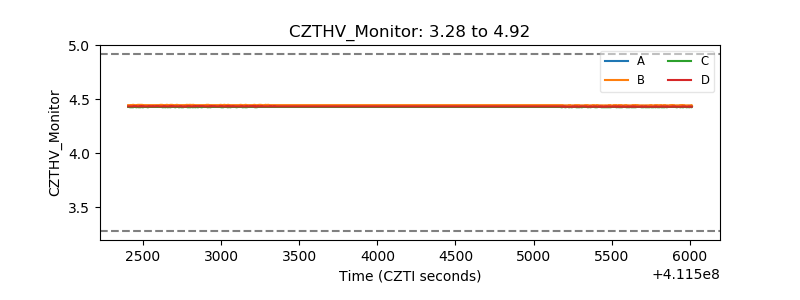 |
| D_VDD | 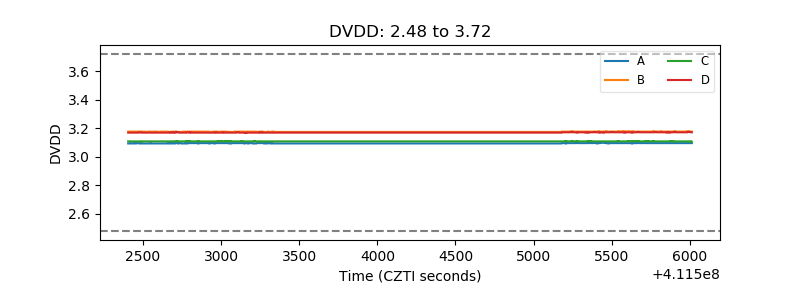 |
| Temperature 1 | 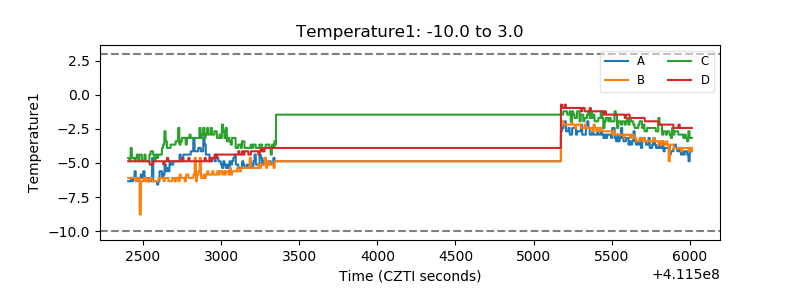 |
| Veto HV Monitor | 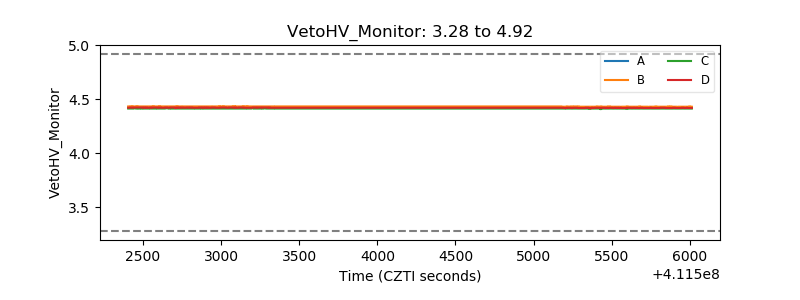 |
| Veto LLD | 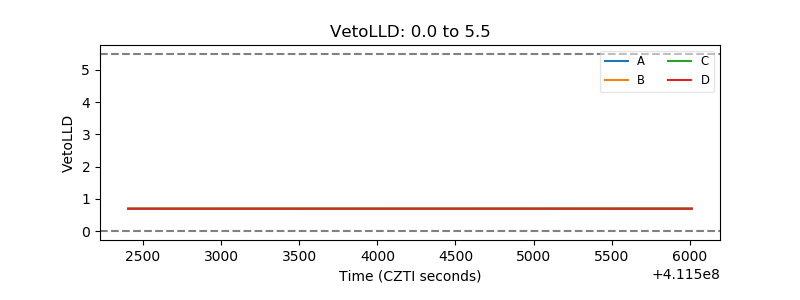 |
| Alpha Counter | 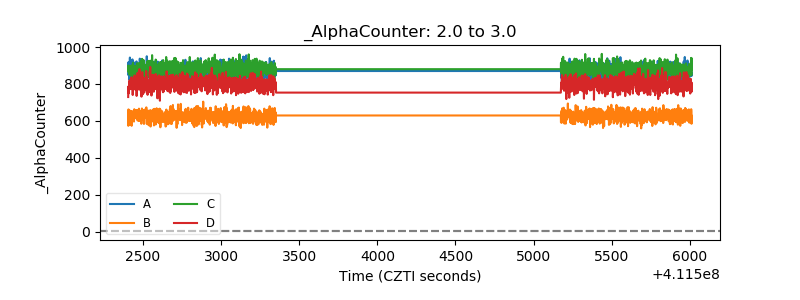 |
| _CPM_Rate | 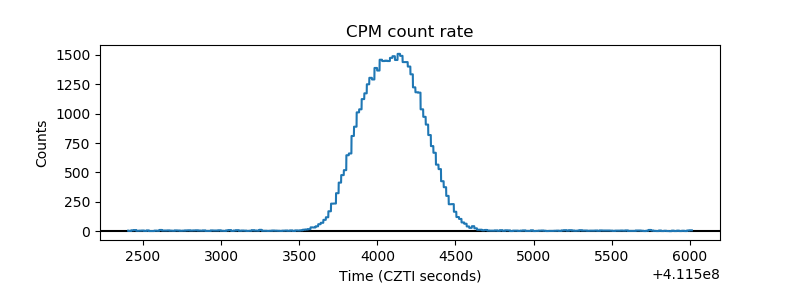 |
| CZT Counter | 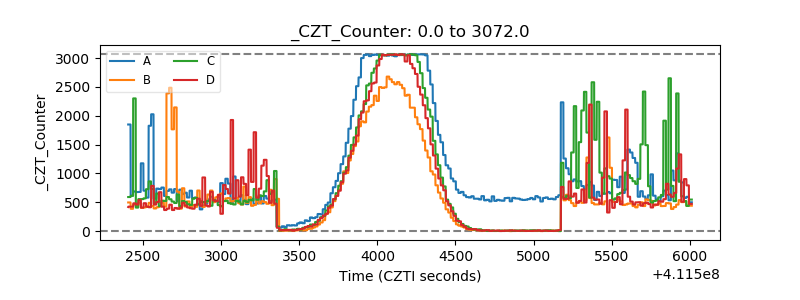 |
| +2.5 Volts monitor | 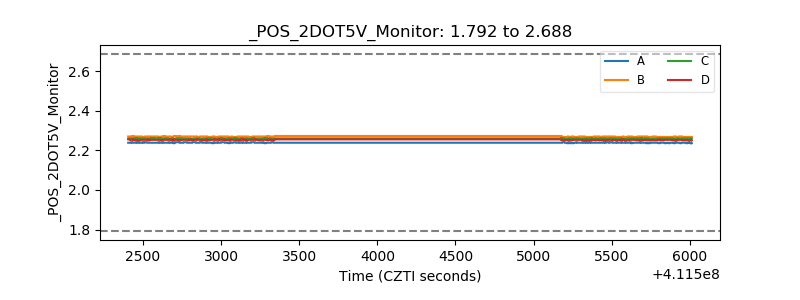 |
| +5 Volts monitor | 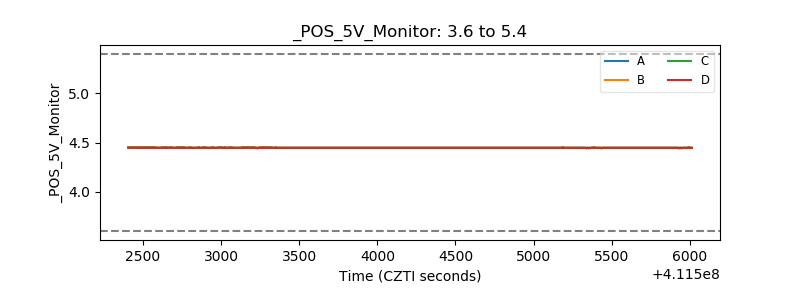 |
| _ROLL_ROT | 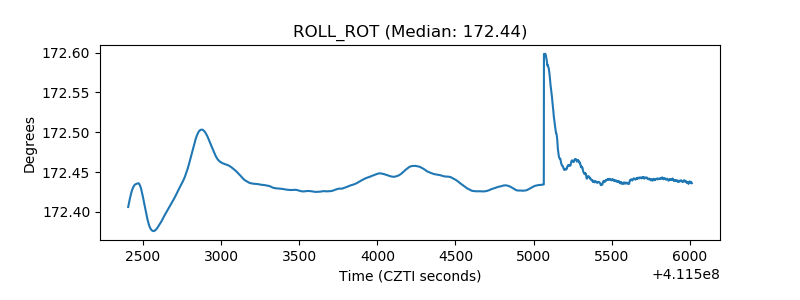 |
| _Roll_DEC | 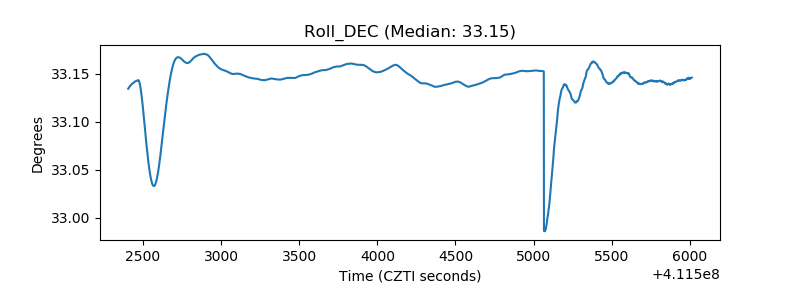 |
| _Roll_RA | 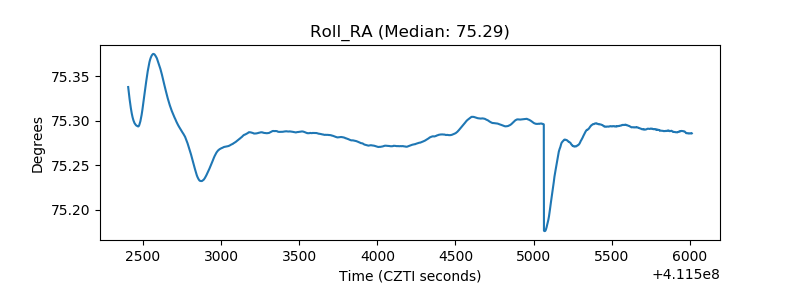 |
| Veto Counter | 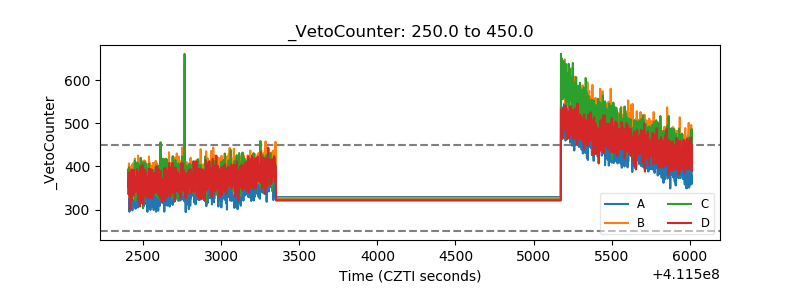 |