| Param | Original file | Final file |
|---|---|---|
| Filename | modeM0/AS1A12_088T26_9000005482_39474cztM0_level2.fits | modeM0/AS1A12_088T26_9000005482_39474cztM0_level2_quad_clean.evt |
| Size (bytes) | 183,519,360 | 40,510,080 |
| Size | 175.0 MB | 38.6 MB |
| Events in quadrant A | 1,718,156 | 274,391 |
| Events in quadrant B | 1,124,694 | 284,362 |
| Events in quadrant C | 2,310,147 | 253,754 |
| Events in quadrant D | 1,458,891 | 247,884 |
| Mode SS | |||
|---|---|---|---|
| Quadrant | BADHDUFLAG | Total packets | Discarded packets |
| A | 0 | 46 | 0 |
| B | 0 | 46 | 0 |
| C | 0 | 46 | 0 |
| D | 0 | 46 | 0 |
| Mode M9 | |||
|---|---|---|---|
| Quadrant | BADHDUFLAG | Total packets | Discarded packets |
| A | 0 | 13 | 0 |
| B | 0 | 13 | 0 |
| C | 0 | 13 | 0 |
| D | 0 | 14 | 0 |
| Mode M0 | |||
|---|---|---|---|
| Quadrant | BADHDUFLAG | Total packets | Discarded packets |
| A | 0 | 6622 | 1 |
| B | 0 | 4957 | 1 |
| C | 0 | 8465 | 1 |
| D | 0 | 5849 | 1 |
| Quadrant | Total seconds | Saturated seconds | Saturation percentage |
|---|---|---|---|
| A | 2307 | 65 | 2.817512% |
| B | 2307 | 27 | 1.170351% |
| C | 2307 | 229 | 9.926311% |
| D | 2307 | 42 | 1.820546% |
Noise dominated data is calculated using 1-second bins in cleaned event files. If a bin has >2000 counts, and if more than 50% of those come from <1% of pixels, then it is considered to be noise-dominated and hence unusable.
| Quadrant | # 1 sec bins | Bins with >0 counts | Bins with >2000 counts | High rate bins dominated by noise | Noise dominated (total time) | Noise dominated (detector-on time) | Marked lightcurve |
|---|---|---|---|---|---|---|---|
| A | 2307 | 2307 | 56 | 56 | 2.43% | 2.43% | 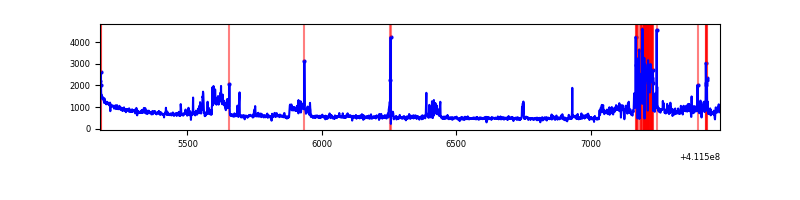 |
| B | 2307 | 2307 | 21 | 21 | 0.91% | 0.91% | 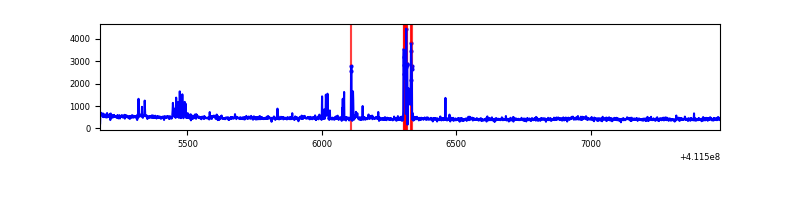 |
| C | 2307 | 2307 | 213 | 213 | 9.23% | 9.23% | 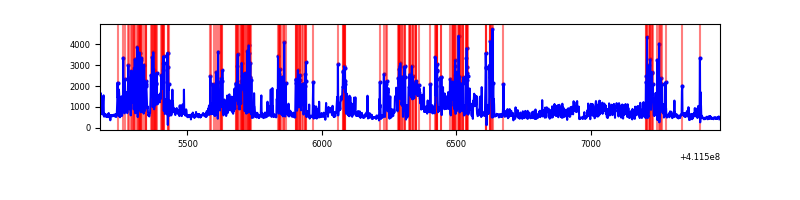 |
| D | 2307 | 2307 | 40 | 40 | 1.73% | 1.73% | 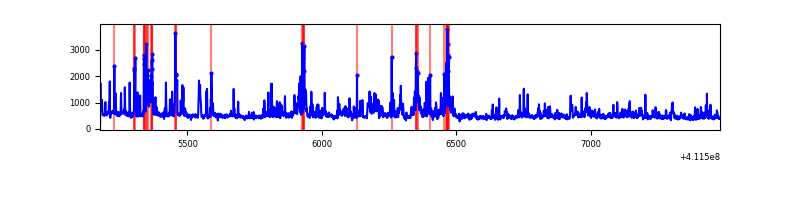 |
Top three noisy pixels from each quadrant. If the there are fewer than three noisy pixels in the level2.evt file, extra rows are filled as -1
| Pixel properties | Quadrant properties | ||||||
|---|---|---|---|---|---|---|---|
| Quadrant | DetID | PixID | Counts | Sigma | Mean | Median | Sigma |
| A | 15 | 222 | 352946 | 6772.52 | 250 | 244 | 52.1 |
| A | 10 | 83 | 213010 | 4085.5 | 250 | 244 | 52.1 |
| A | 15 | 174 | 157863 | 3026.57 | 250 | 244 | 52.1 |
| B | 8 | 3 | 113324 | 2292.87 | 251 | 245 | 49.3 |
| B | 0 | 230 | 13166 | 262.0 | 251 | 245 | 49.3 |
| B | 0 | 199 | 6171 | 120.16 | 251 | 245 | 49.3 |
| C | 15 | 208 | 1129013 | 19697.32 | 242 | 244 | 57.3 |
| C | 9 | 187 | 134461 | 2342.12 | 242 | 244 | 57.3 |
| C | 15 | 214 | 93872 | 1633.83 | 242 | 244 | 57.3 |
| D | 12 | 0 | 221740 | 3649.26 | 248 | 241 | 60.7 |
| D | 12 | 227 | 111349 | 1830.54 | 248 | 241 | 60.7 |
| D | 1 | 52 | 72322 | 1187.56 | 248 | 241 | 60.7 |
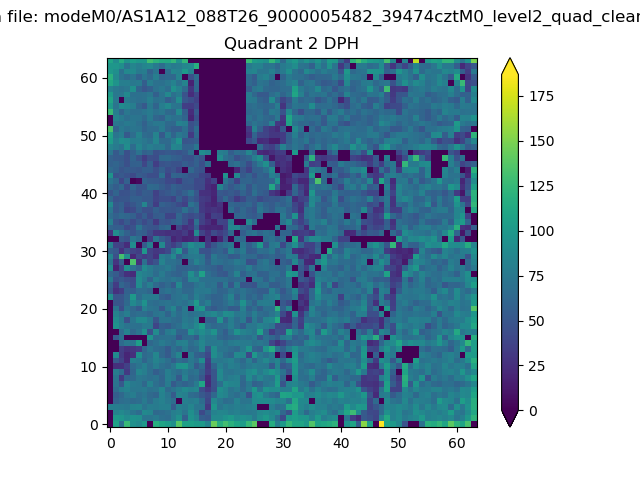
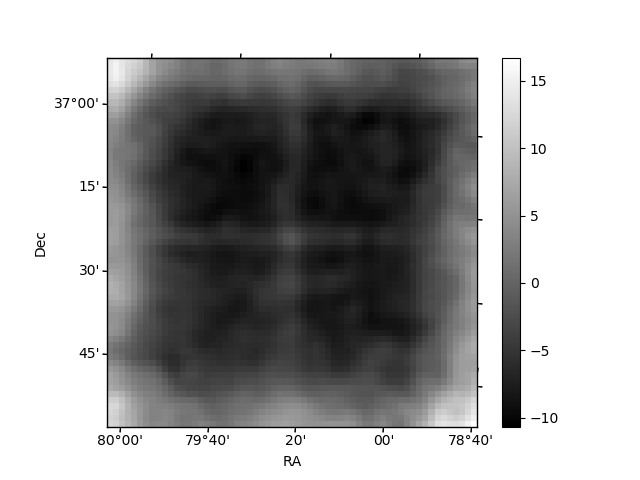
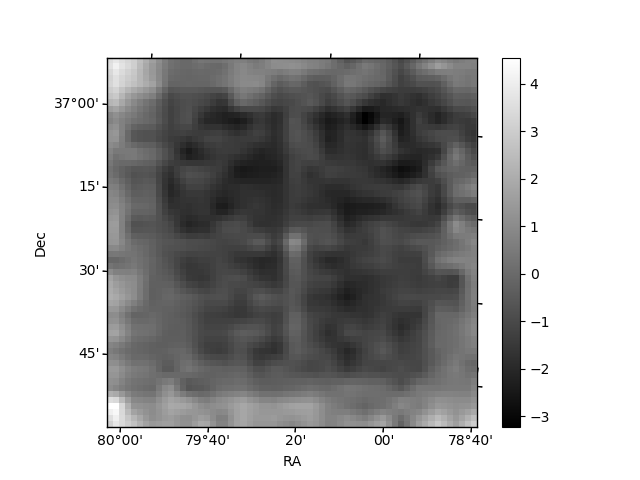
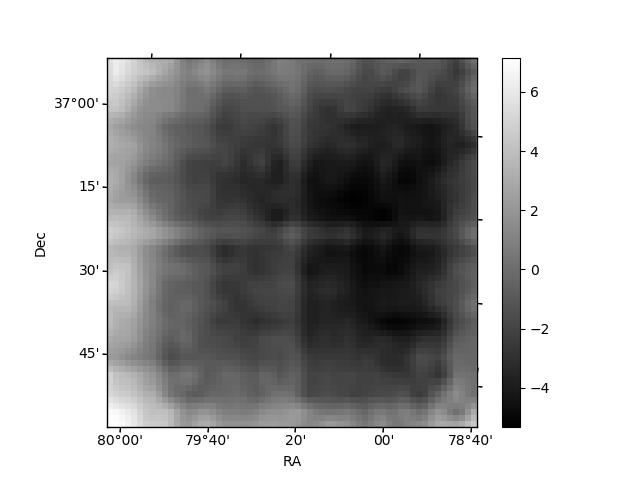
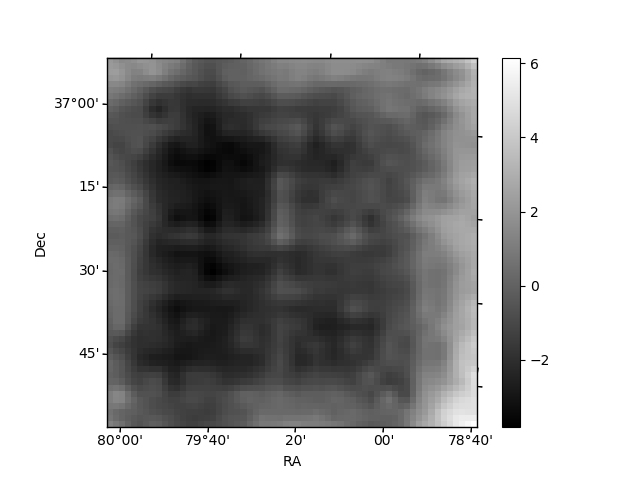
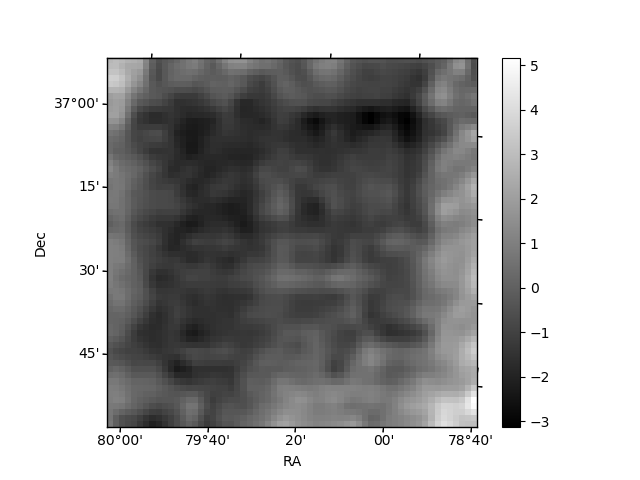
Histogram calculated using DETX and DETY for each event in the final _common_clean file
| Quadrant A | 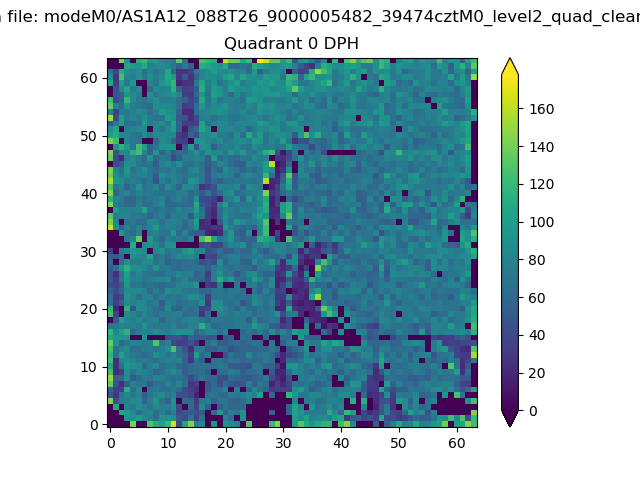 |
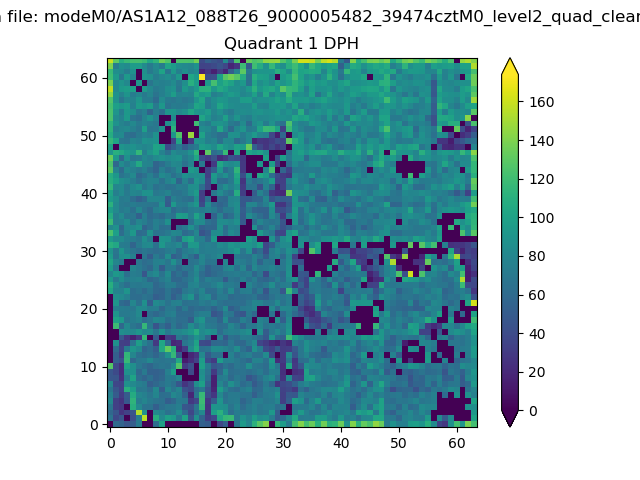 |
Quadrant B |
|---|---|---|---|
| Quadrant D | 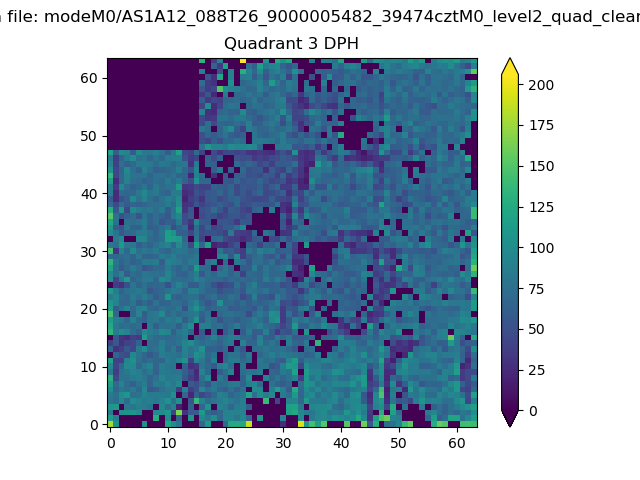 |
 |
Quadrant C |
| Plot type | Count rate plots | Images |
|---|---|---|
| Comparison with Poisson distribution Blue bars denote a histogram of data divided into 1 sec bins. Red curve is a Poisson curve with rate = median count rate of data. |
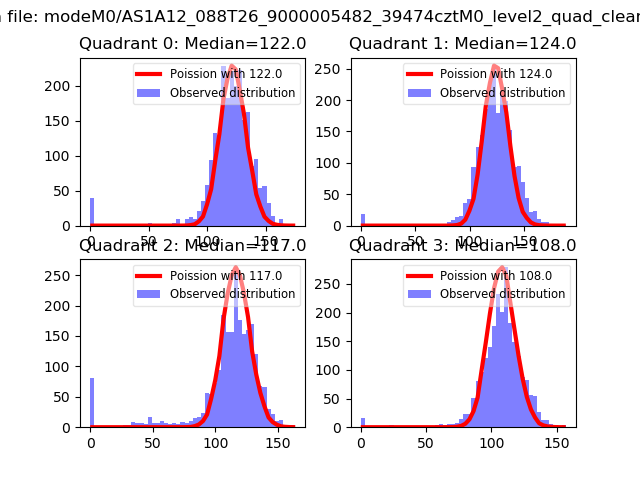 |
 |
| Quadrant-wise count rates Data is divided into 100 sec bins |
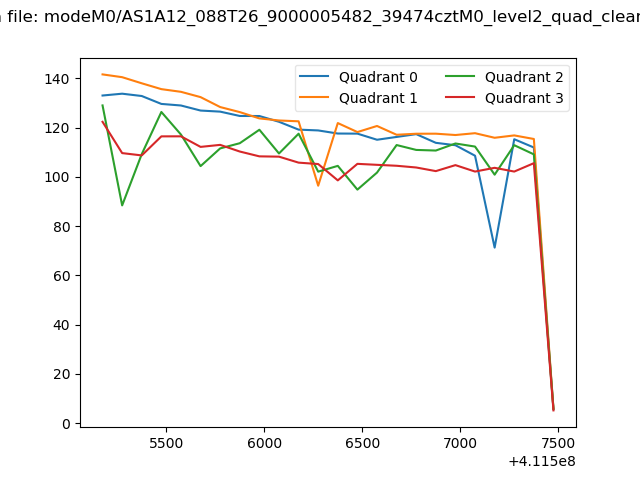 |
|
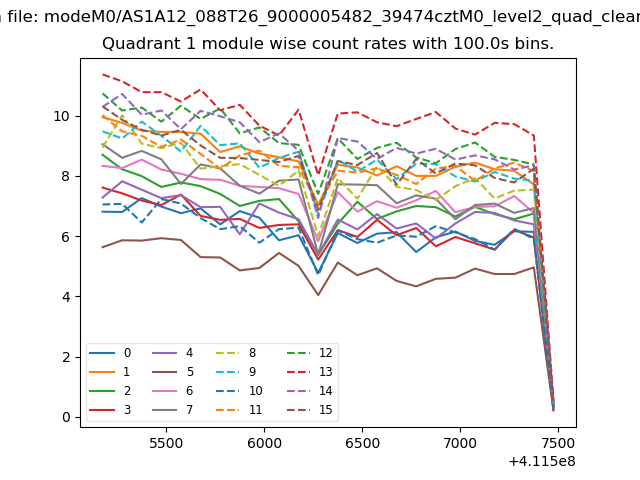
| Module-wise count rates for Quadrant A Data is divided into 100 sec bins |
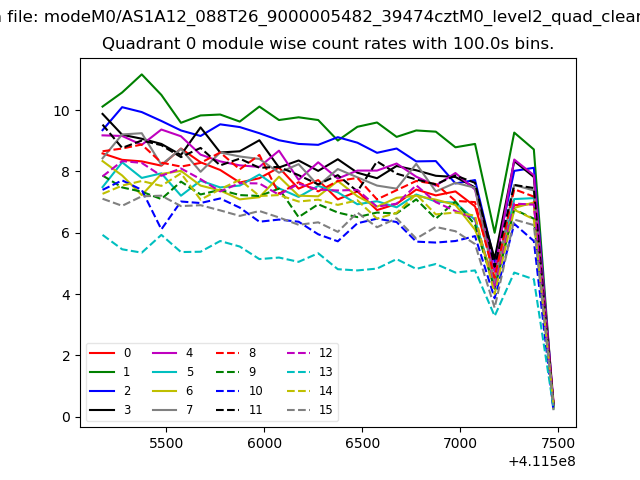 |
 |
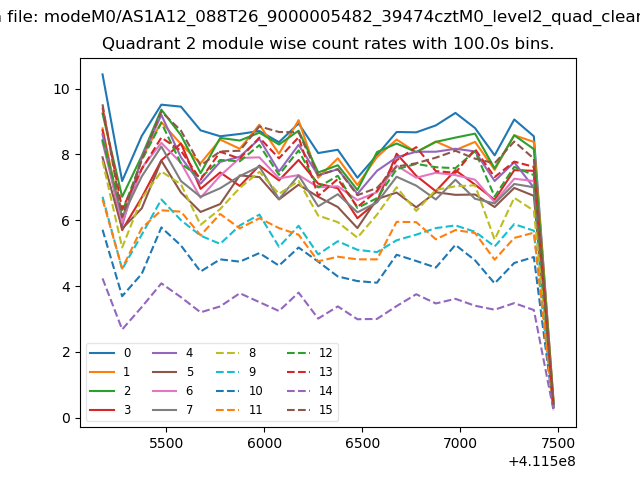
| Module-wise count rates for Quadrant B Data is divided into 100 sec bins |
 |
 |
| Module-wise count rates for Quadrant C Data is divided into 100 sec bins |
 |
 |
| Module-wise count rates for Quadrant D Data is divided into 100 sec bins |
 |
 |
| Parameter | Plot |
|---|---|
| CZT HV Monitor | 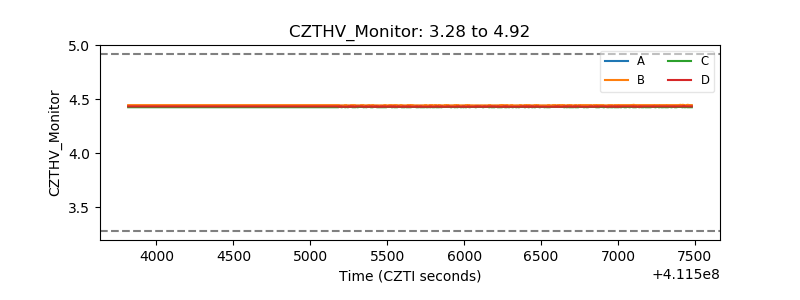 |
| D_VDD | 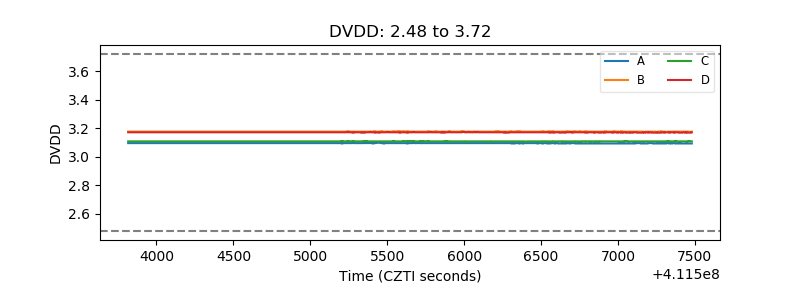 |
| Temperature 1 | 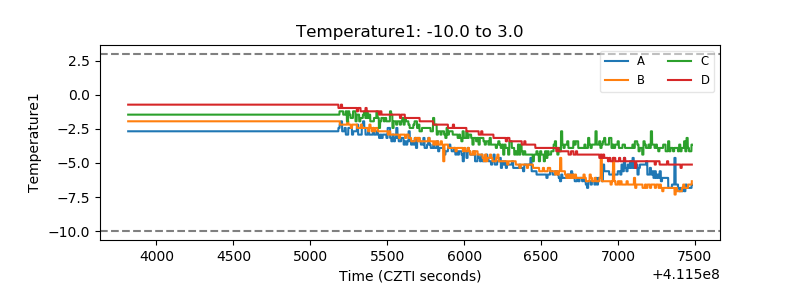 |
| Veto HV Monitor | 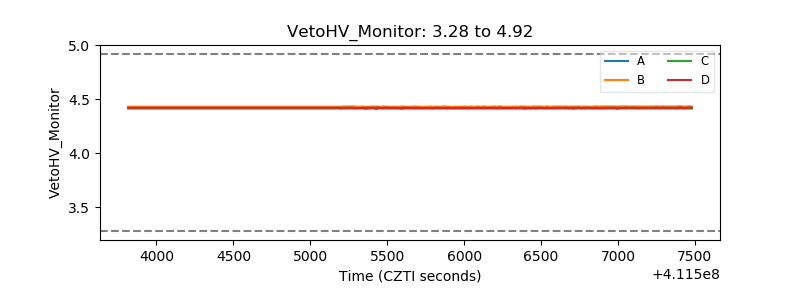 |
| Veto LLD | 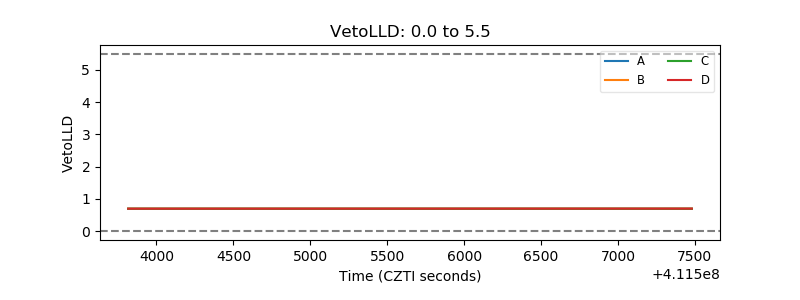 |
| Alpha Counter | 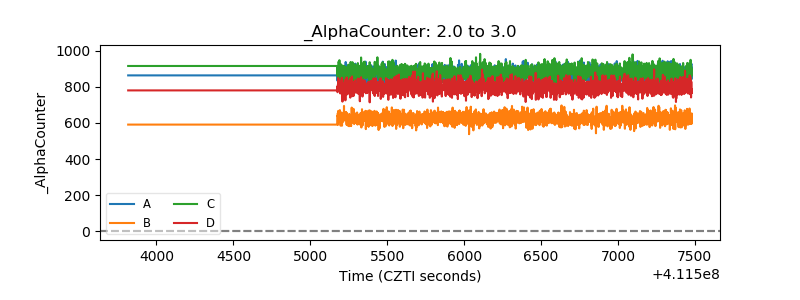 |
| _CPM_Rate | 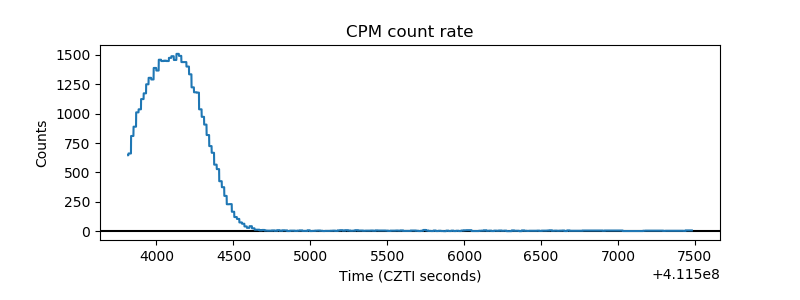 |
| CZT Counter | 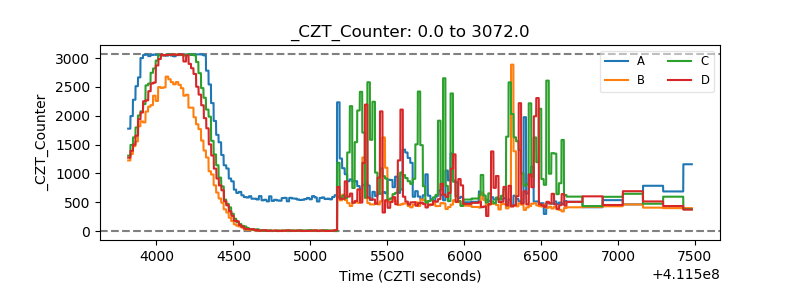 |
| +2.5 Volts monitor | 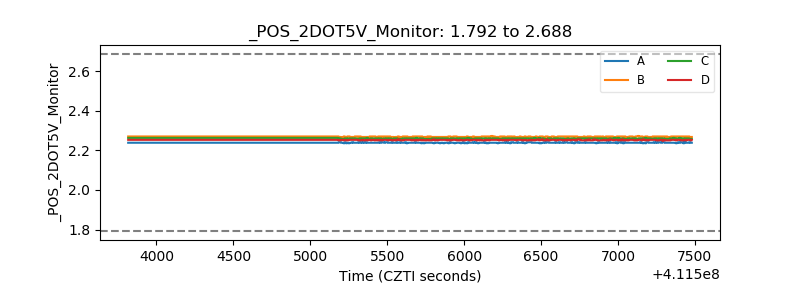 |
| +5 Volts monitor | 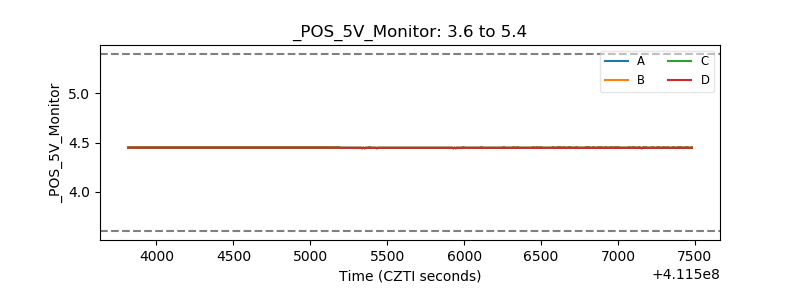 |
| _ROLL_ROT | 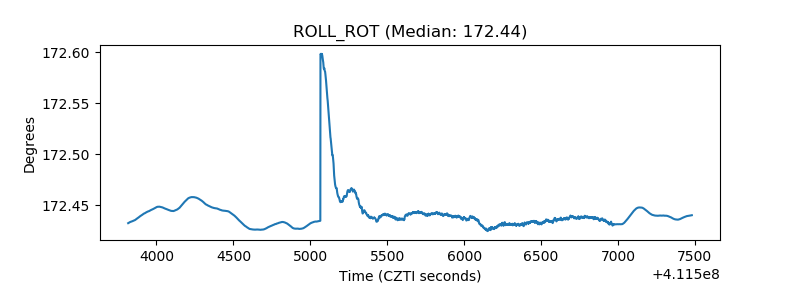 |
| _Roll_DEC | 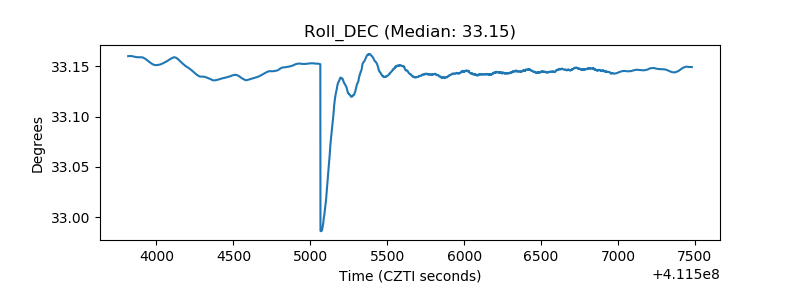 |
| _Roll_RA | 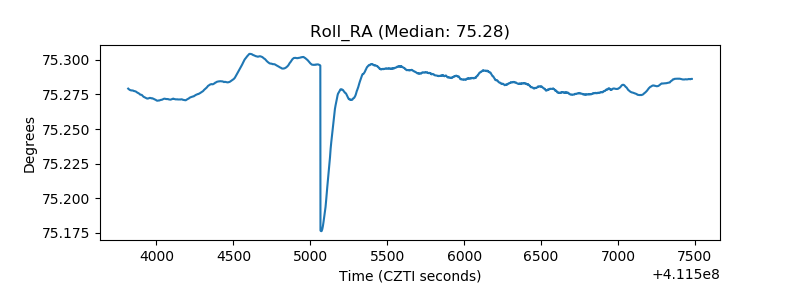 |
| Veto Counter |  |