| Param | Original file | Final file |
|---|---|---|
| Filename | modeM0/AS1C06_010T05_9000005484_39474cztM0_level2.fits | modeM0/AS1C06_010T05_9000005484_39474cztM0_level2_quad_clean.evt |
| Size (bytes) | 139,720,320 | 37,581,120 |
| Size | 133.2 MB | 35.8 MB |
| Events in quadrant A | 1,258,997 | 254,339 |
| Events in quadrant B | 956,637 | 265,834 |
| Events in quadrant C | 1,416,237 | 244,535 |
| Events in quadrant D | 1,375,637 | 222,851 |
| Mode M0 | |||
|---|---|---|---|
| Quadrant | BADHDUFLAG | Total packets | Discarded packets |
| A | 0 | 5011 | 2 |
| B | 0 | 4184 | 1 |
| C | 0 | 5545 | 1 |
| D | 0 | 5491 | 1 |
| Mode SS | |||
|---|---|---|---|
| Quadrant | BADHDUFLAG | Total packets | Discarded packets |
| A | 0 | 42 | 0 |
| B | 0 | 42 | 0 |
| C | 0 | 42 | 0 |
| D | 0 | 42 | 0 |
| Mode M9 | |||
|---|---|---|---|
| Quadrant | BADHDUFLAG | Total packets | Discarded packets |
| A | 0 | 20 | 0 |
| B | 0 | 20 | 0 |
| C | 0 | 20 | 0 |
| D | 0 | 20 | 0 |
| Quadrant | Total seconds | Saturated seconds | Saturation percentage |
|---|---|---|---|
| A | 2083 | 9 | 0.432069% |
| B | 2083 | 1 | 0.048008% |
| C | 2083 | 65 | 3.120499% |
| D | 2083 | 99 | 4.752760% |
Noise dominated data is calculated using 1-second bins in cleaned event files. If a bin has >2000 counts, and if more than 50% of those come from <1% of pixels, then it is considered to be noise-dominated and hence unusable.
| Quadrant | # 1 sec bins | Bins with >0 counts | Bins with >2000 counts | High rate bins dominated by noise | Noise dominated (total time) | Noise dominated (detector-on time) | Marked lightcurve |
|---|---|---|---|---|---|---|---|
| A | 4026 | 2084 | 6 | 6 | 0.15% | 0.29% | 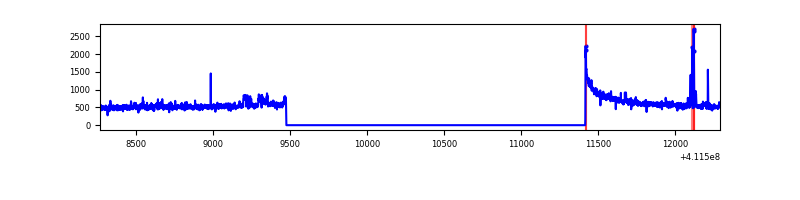 |
| B | 4026 | 2084 | 0 | 0 | 0.00% | 0.00% | 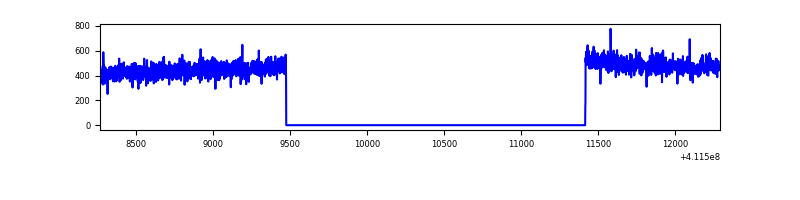 |
| C | 4026 | 2084 | 50 | 50 | 1.24% | 2.40% | 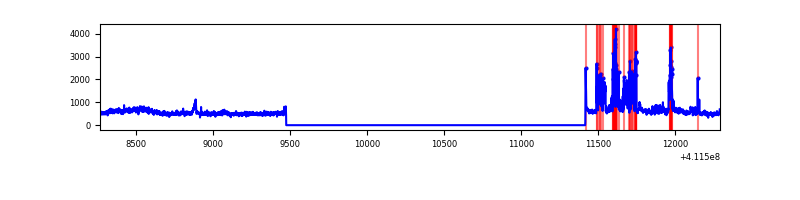 |
| D | 4026 | 2084 | 81 | 81 | 2.01% | 3.89% | 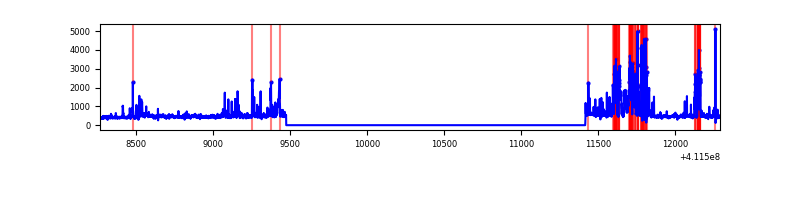 |
Top three noisy pixels from each quadrant. If the there are fewer than three noisy pixels in the level2.evt file, extra rows are filled as -1
| Pixel properties | Quadrant properties | ||||||
|---|---|---|---|---|---|---|---|
| Quadrant | DetID | PixID | Counts | Sigma | Mean | Median | Sigma |
| A | 10 | 83 | 192571 | 3830.97 | 240 | 235 | 50.2 |
| A | 15 | 222 | 96589 | 1919.19 | 240 | 235 | 50.2 |
| A | 15 | 174 | 27392 | 540.92 | 240 | 235 | 50.2 |
| B | 12 | 111 | 5506 | 112.34 | 241 | 235 | 46.9 |
| B | 0 | 230 | 5445 | 111.04 | 241 | 235 | 46.9 |
| B | 11 | 111 | 5187 | 105.54 | 241 | 235 | 46.9 |
| C | 15 | 208 | 366760 | 6673.93 | 232 | 234 | 54.9 |
| C | 15 | 214 | 88303 | 1603.61 | 232 | 234 | 54.9 |
| C | 9 | 187 | 45632 | 826.63 | 232 | 234 | 54.9 |
| D | 12 | 227 | 249191 | 4333.56 | 230 | 223 | 57.5 |
| D | 1 | 52 | 76960 | 1335.69 | 230 | 223 | 57.5 |
| D | 2 | 249 | 45902 | 795.09 | 230 | 223 | 57.5 |
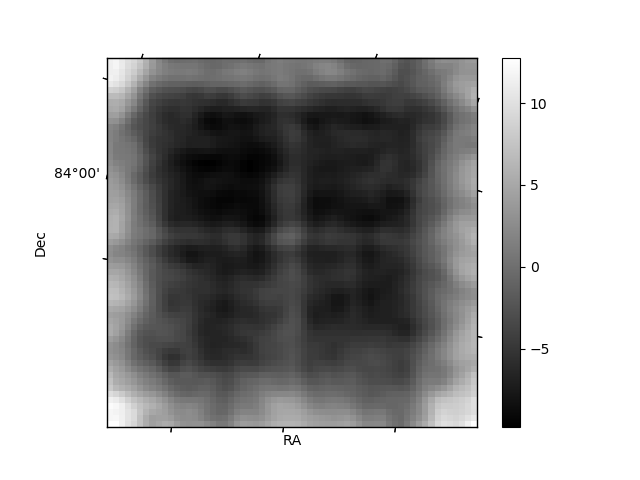
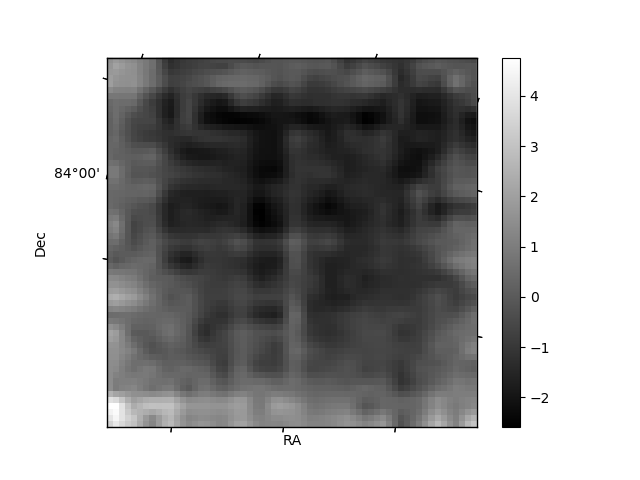
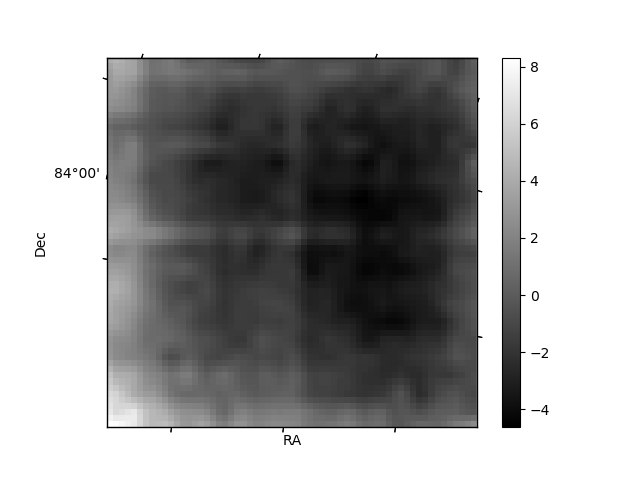
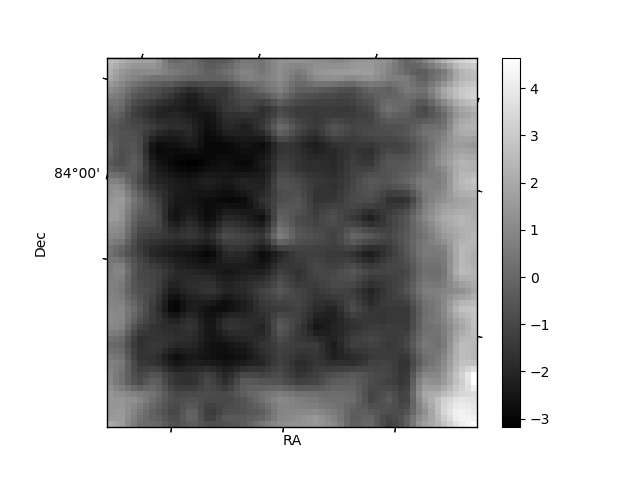
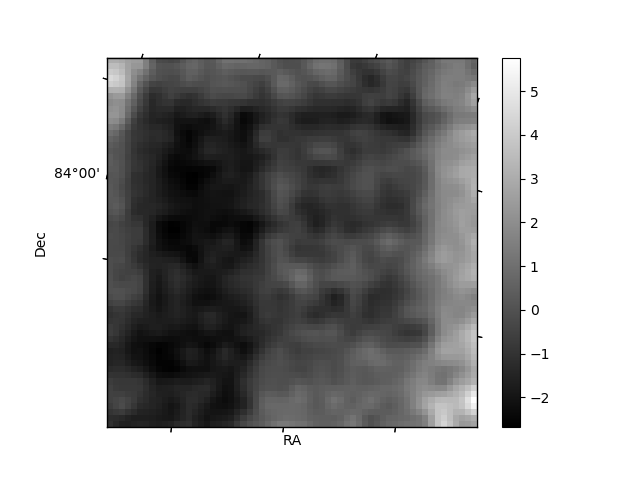
Histogram calculated using DETX and DETY for each event in the final _common_clean file
| Quadrant A | 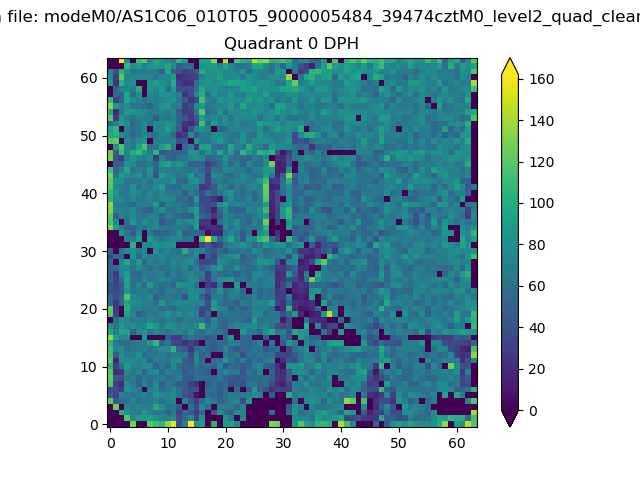 |
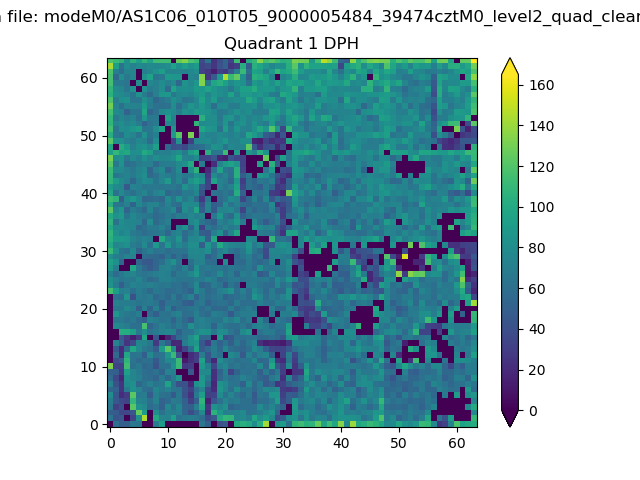 |
Quadrant B |
|---|---|---|---|
| Quadrant D | 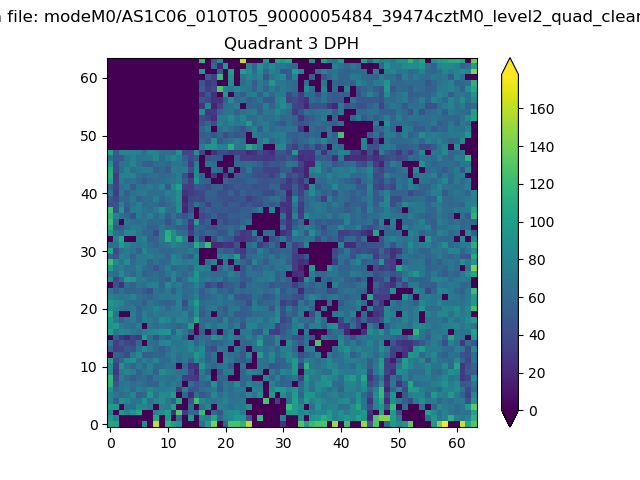 |
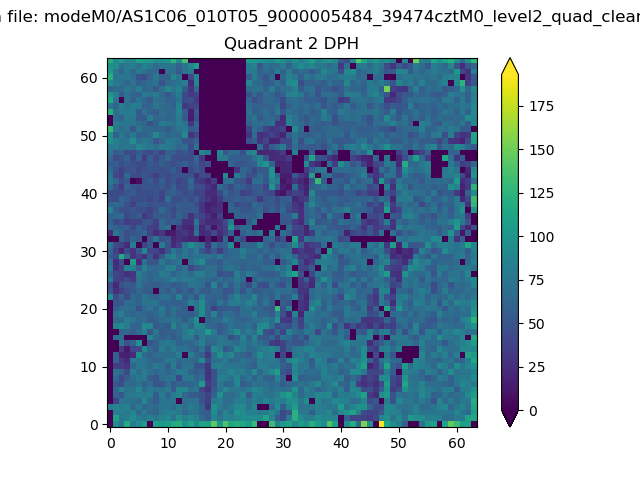 |
Quadrant C |
| Plot type | Count rate plots | Images |
|---|---|---|
| Comparison with Poisson distribution Blue bars denote a histogram of data divided into 1 sec bins. Red curve is a Poisson curve with rate = median count rate of data. |
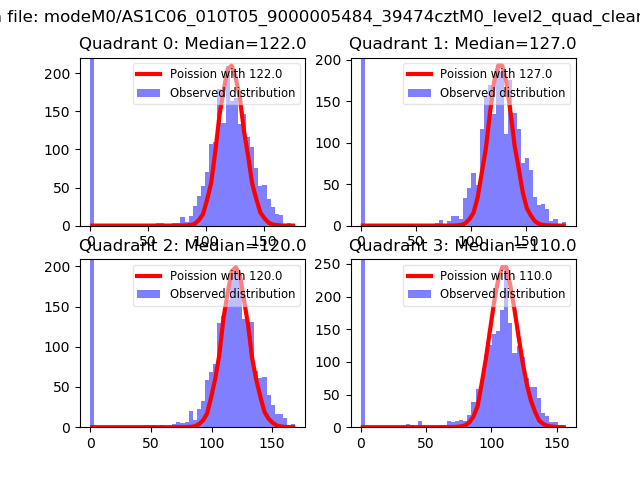 |
 |
| Quadrant-wise count rates Data is divided into 100 sec bins |
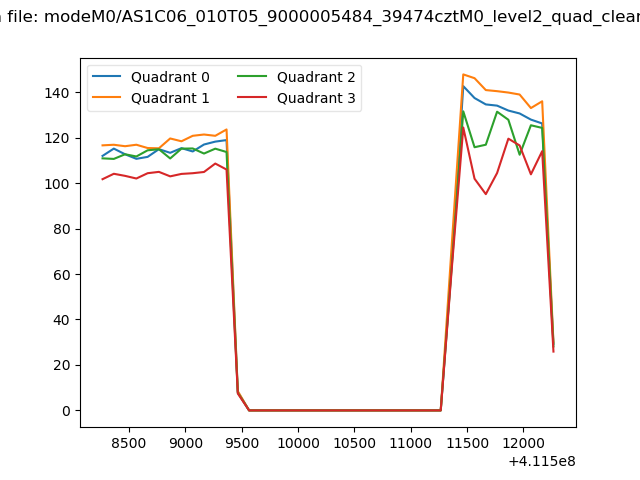 |
|
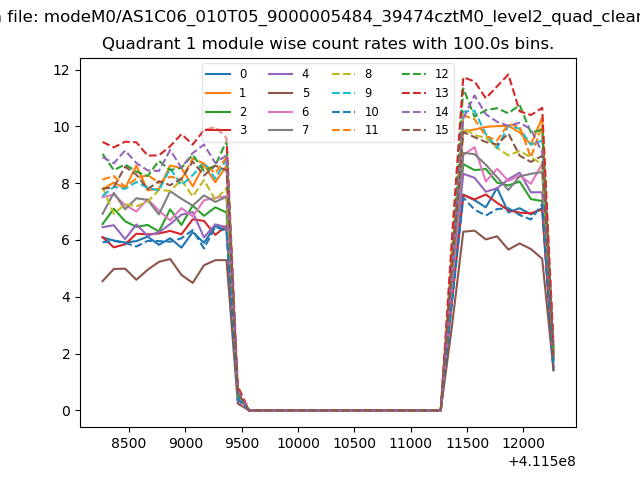
| Module-wise count rates for Quadrant A Data is divided into 100 sec bins |
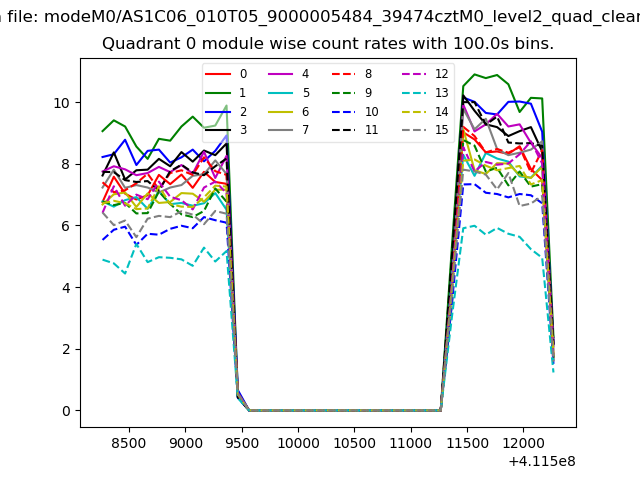 |
 |
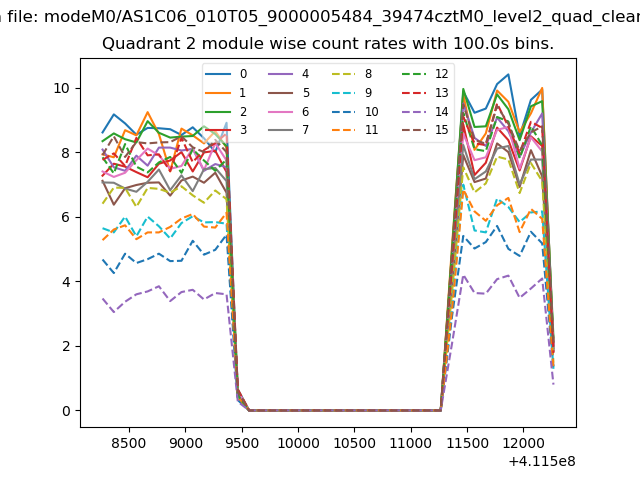
| Module-wise count rates for Quadrant B Data is divided into 100 sec bins |
 |
 |
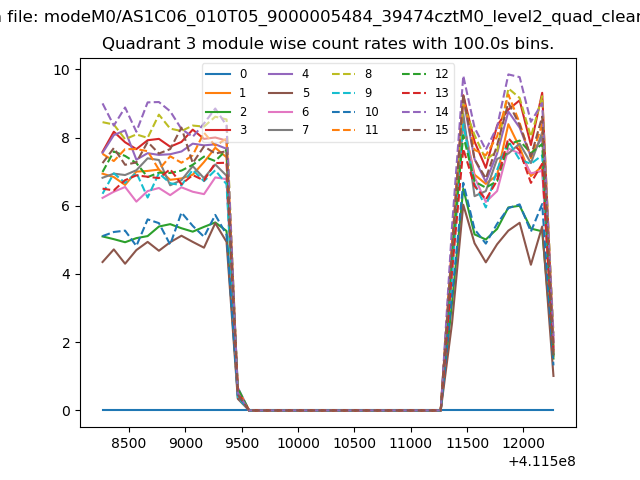
| Module-wise count rates for Quadrant C Data is divided into 100 sec bins |
 |
 |
| Module-wise count rates for Quadrant D Data is divided into 100 sec bins |
 |
 |
| Parameter | Plot |
|---|---|
| CZT HV Monitor | 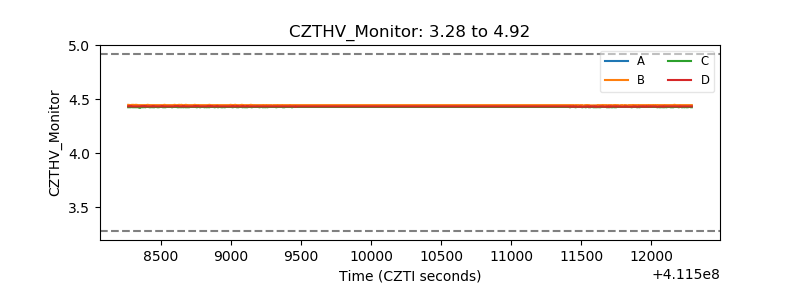 |
| D_VDD | 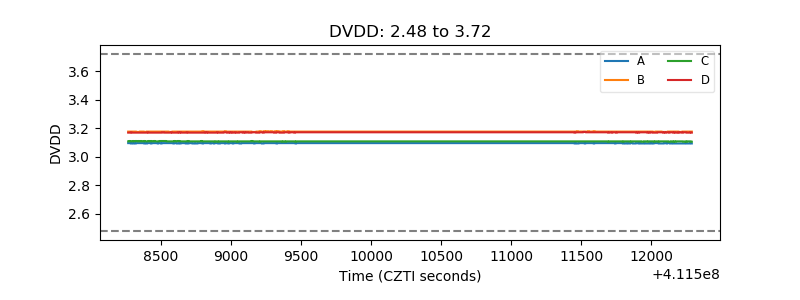 |
| Temperature 1 | 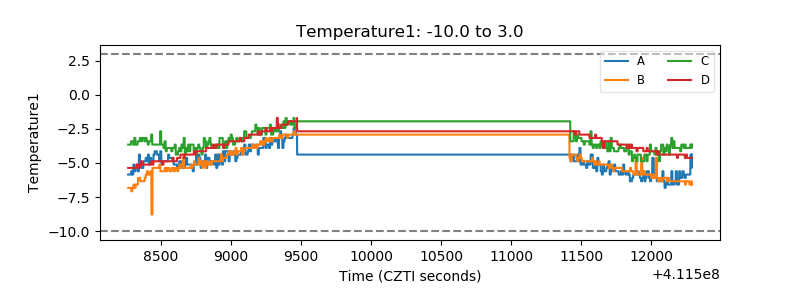 |
| Veto HV Monitor |  |
| Veto LLD | 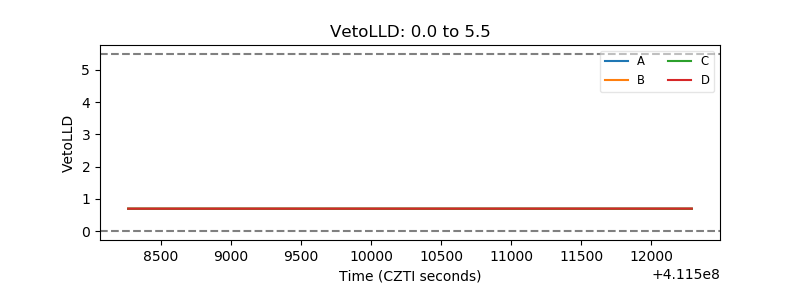 |
| Alpha Counter | 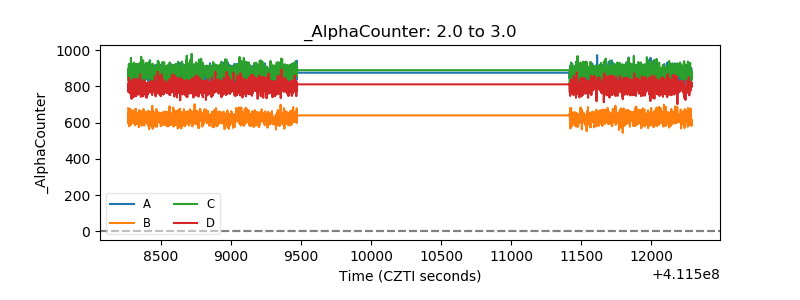 |
| _CPM_Rate | 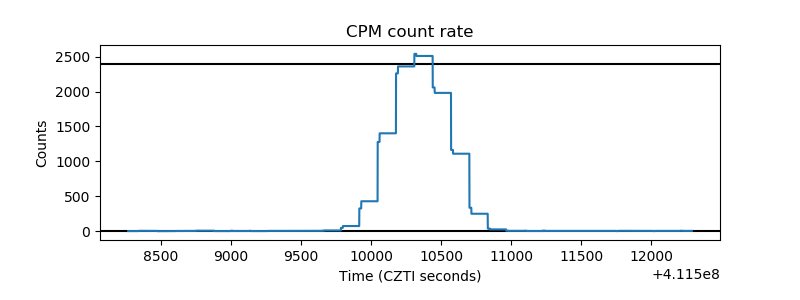 |
| CZT Counter | 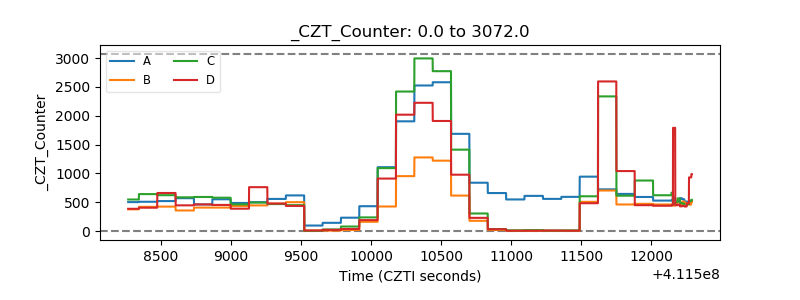 |
| +2.5 Volts monitor | 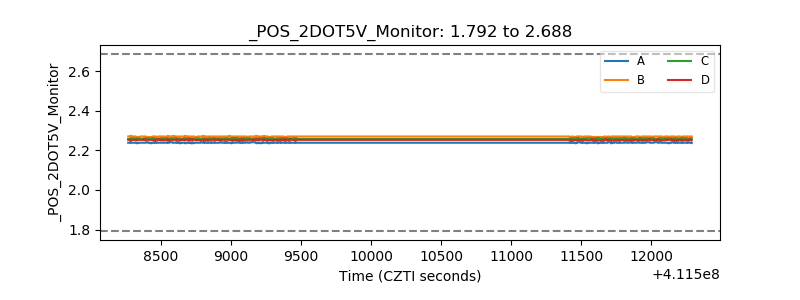 |
| +5 Volts monitor | 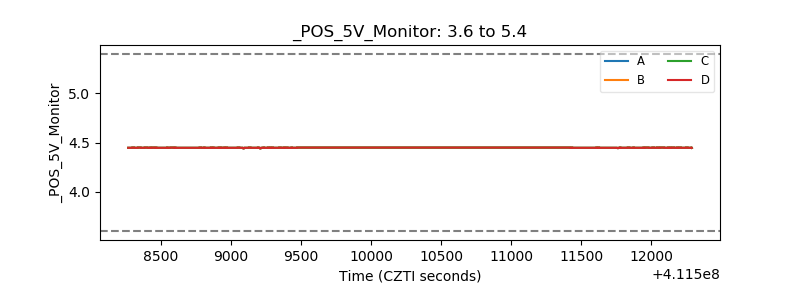 |
| _ROLL_ROT | 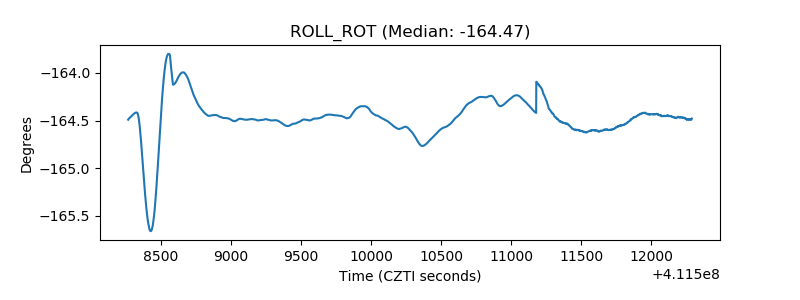 |
| _Roll_DEC | 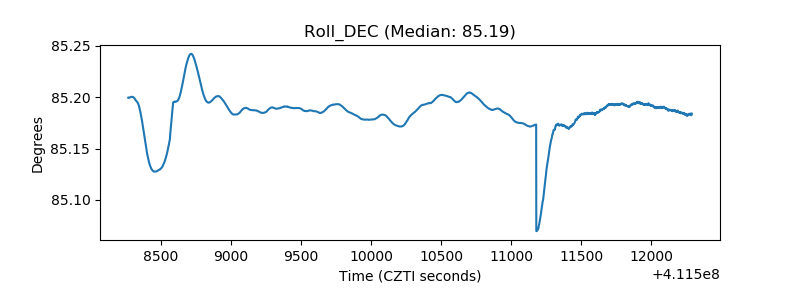 |
| _Roll_RA | 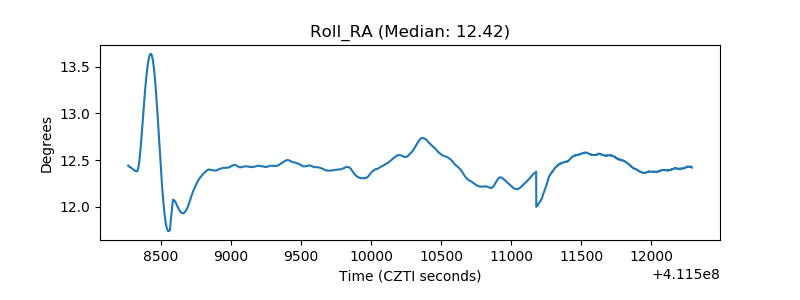 |
| Veto Counter | 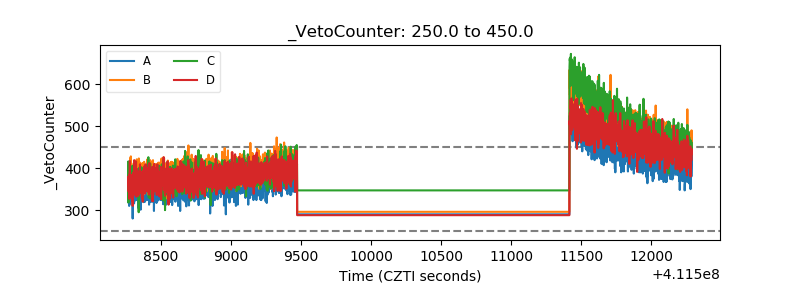 |