| Param | Original file | Final file |
|---|---|---|
| Filename | modeM0/AS1C06_010T05_9000005484_39475cztM0_level2.fits | modeM0/AS1C06_010T05_9000005484_39475cztM0_level2_quad_clean.evt |
| Size (bytes) | 373,561,920 | 88,145,280 |
| Size | 356.3 MB | 84.1 MB |
| Events in quadrant A | 2,810,170 | 609,228 |
| Events in quadrant B | 2,453,492 | 635,219 |
| Events in quadrant C | 4,752,303 | 532,975 |
| Events in quadrant D | 3,419,822 | 538,654 |
| Mode M0 | |||
|---|---|---|---|
| Quadrant | BADHDUFLAG | Total packets | Discarded packets |
| A | 0 | 11480 | 3 |
| B | 0 | 10840 | 2 |
| C | 0 | 17495 | 2 |
| D | 0 | 13567 | 2 |
| Mode SS | |||
|---|---|---|---|
| Quadrant | BADHDUFLAG | Total packets | Discarded packets |
| A | 0 | 102 | 0 |
| B | 0 | 102 | 0 |
| C | 0 | 102 | 0 |
| D | 0 | 102 | 0 |
| Mode M9 | |||
|---|---|---|---|
| Quadrant | BADHDUFLAG | Total packets | Discarded packets |
| A | 0 | 32 | 0 |
| B | 0 | 32 | 0 |
| C | 0 | 32 | 0 |
| D | 0 | 33 | 0 |
| Quadrant | Total seconds | Saturated seconds | Saturation percentage |
|---|---|---|---|
| A | 5040 | 13 | 0.257937% |
| B | 5040 | 46 | 0.912698% |
| C | 5040 | 645 | 12.797619% |
| D | 5040 | 209 | 4.146825% |
Noise dominated data is calculated using 1-second bins in cleaned event files. If a bin has >2000 counts, and if more than 50% of those come from <1% of pixels, then it is considered to be noise-dominated and hence unusable.
| Quadrant | # 1 sec bins | Bins with >0 counts | Bins with >2000 counts | High rate bins dominated by noise | Noise dominated (total time) | Noise dominated (detector-on time) | Marked lightcurve |
|---|---|---|---|---|---|---|---|
| A | 7074 | 5041 | 9 | 9 | 0.13% | 0.18% | 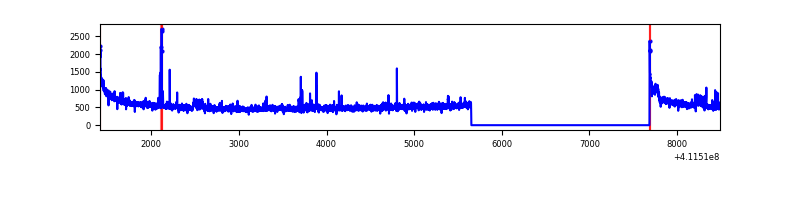 |
| B | 7074 | 5041 | 13 | 13 | 0.18% | 0.26% | 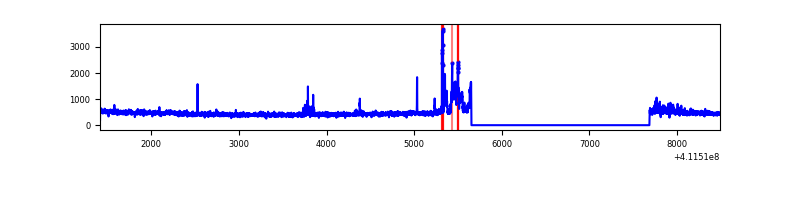 |
| C | 7073 | 5040 | 604 | 604 | 8.54% | 11.98% | 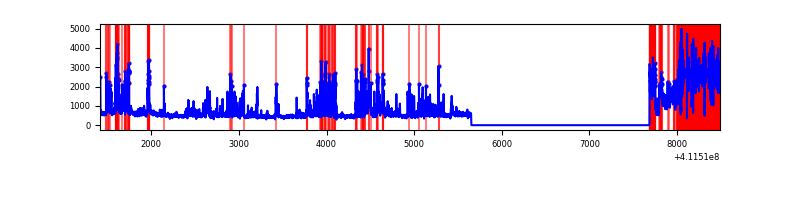 |
| D | 7074 | 5041 | 187 | 187 | 2.64% | 3.71% | 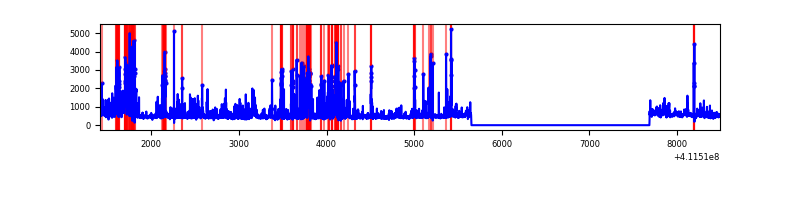 |
Top three noisy pixels from each quadrant. If the there are fewer than three noisy pixels in the level2.evt file, extra rows are filled as -1
| Pixel properties | Quadrant properties | ||||||
|---|---|---|---|---|---|---|---|
| Quadrant | DetID | PixID | Counts | Sigma | Mean | Median | Sigma |
| A | 10 | 83 | 420550 | 3768.11 | 553 | 543 | 111.5 |
| A | 15 | 222 | 180888 | 1617.97 | 553 | 543 | 111.5 |
| A | 15 | 174 | 41057 | 363.47 | 553 | 543 | 111.5 |
| B | 8 | 3 | 212175 | 2017.93 | 559 | 544 | 104.9 |
| B | 5 | 172 | 27932 | 261.15 | 559 | 544 | 104.9 |
| B | 12 | 111 | 12832 | 117.17 | 559 | 544 | 104.9 |
| C | 9 | 187 | 1643127 | 13958.0 | 508 | 510 | 117.7 |
| C | 15 | 208 | 902797 | 7667.11 | 508 | 510 | 117.7 |
| C | 15 | 214 | 197587 | 1674.65 | 508 | 510 | 117.7 |
| D | 12 | 227 | 523848 | 4033.43 | 535 | 520 | 129.7 |
| D | 13 | 249 | 253166 | 1947.21 | 535 | 520 | 129.7 |
| D | 2 | 249 | 249972 | 1922.59 | 535 | 520 | 129.7 |
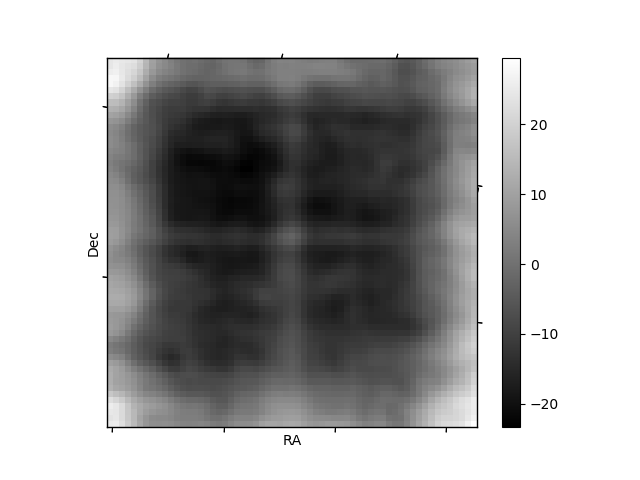
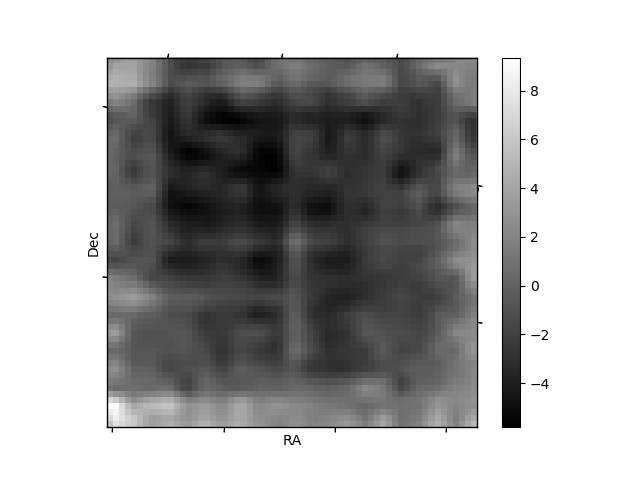
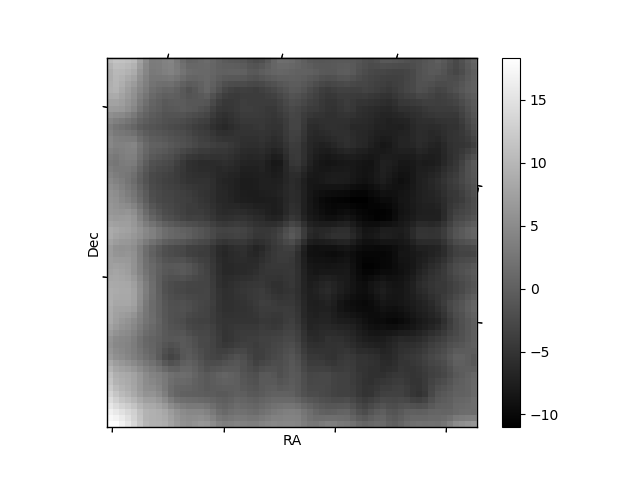
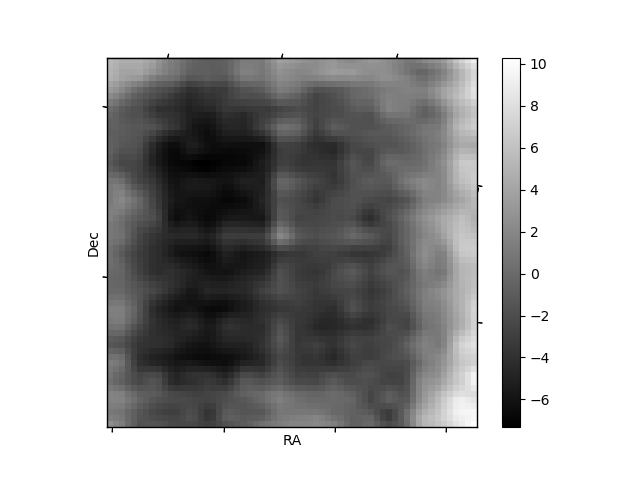
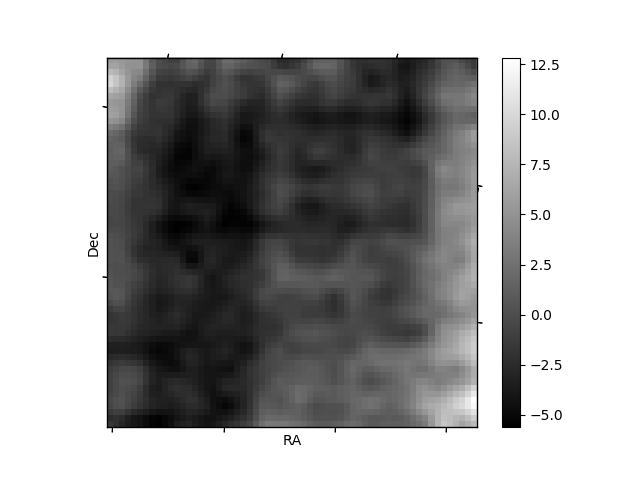
Histogram calculated using DETX and DETY for each event in the final _common_clean file
| Quadrant A | 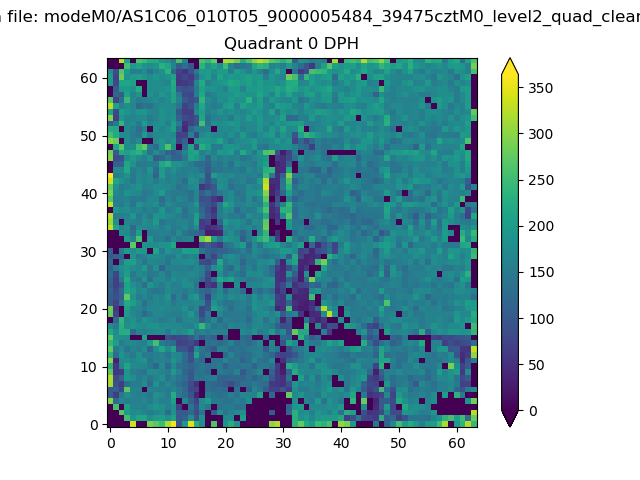 |
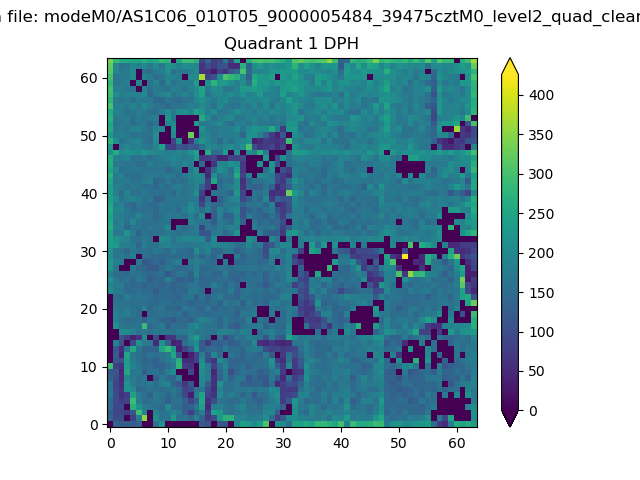 |
Quadrant B |
|---|---|---|---|
| Quadrant D | 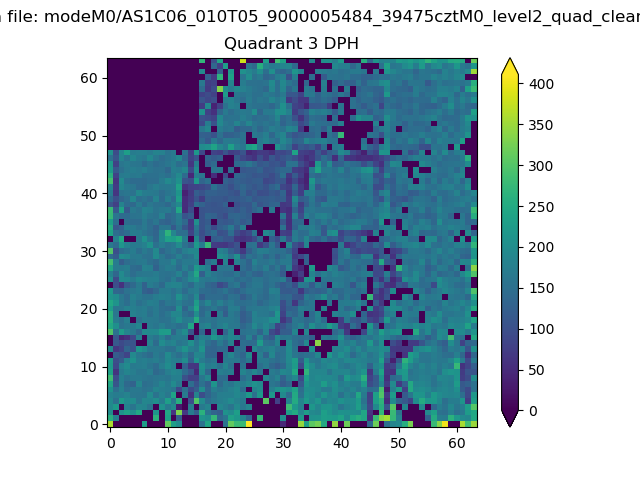 |
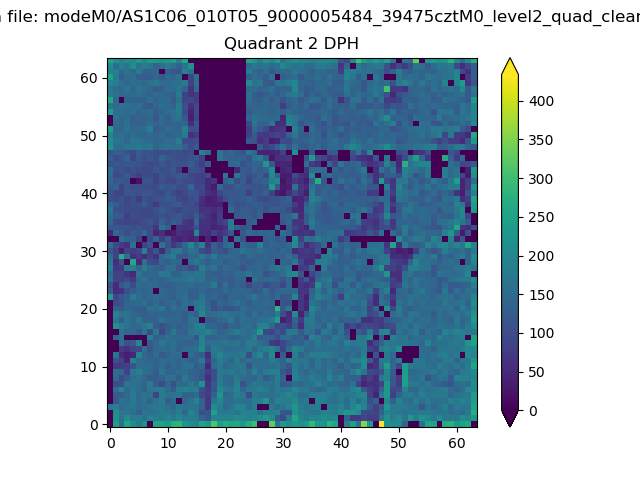 |
Quadrant C |
| Plot type | Count rate plots | Images |
|---|---|---|
| Comparison with Poisson distribution Blue bars denote a histogram of data divided into 1 sec bins. Red curve is a Poisson curve with rate = median count rate of data. |
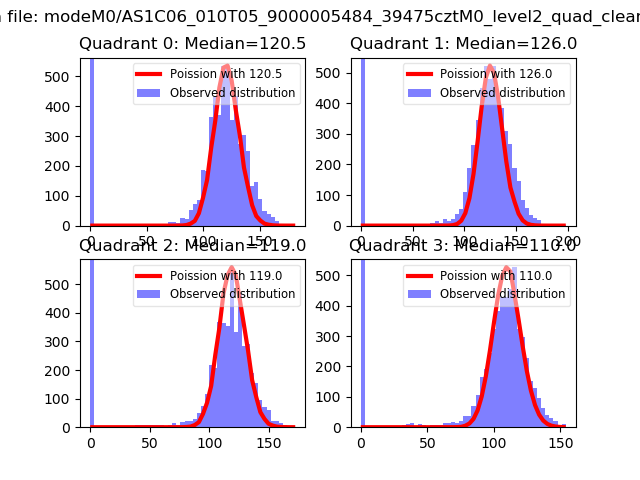 |
 |
| Quadrant-wise count rates Data is divided into 100 sec bins |
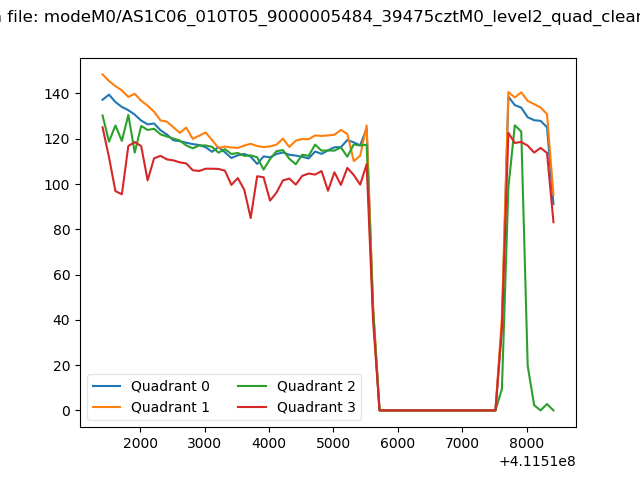 |
|
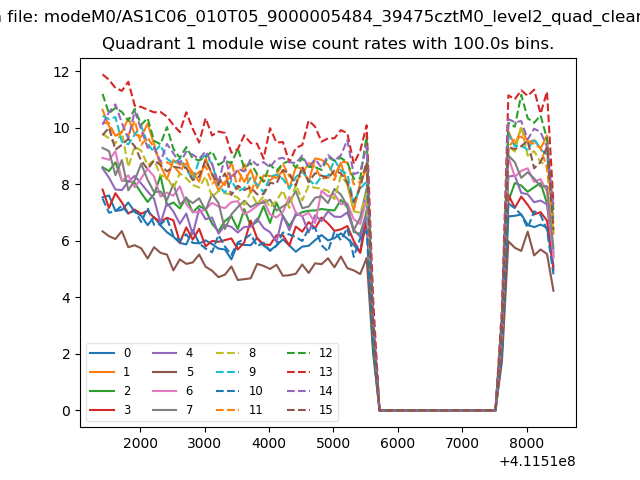
| Module-wise count rates for Quadrant A Data is divided into 100 sec bins |
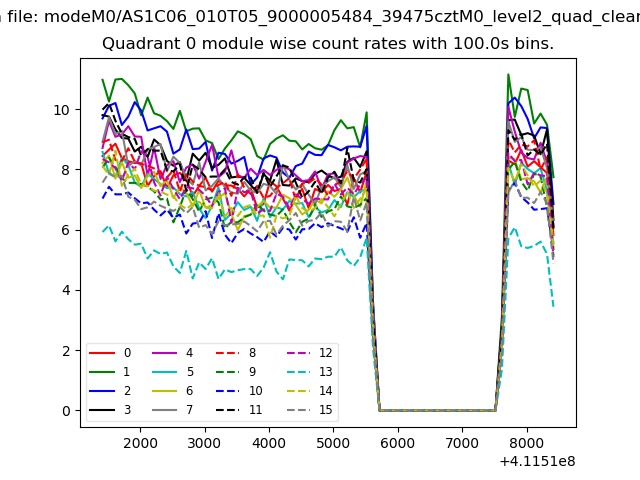 |
 |
| Module-wise count rates for Quadrant B Data is divided into 100 sec bins |
 |
 |
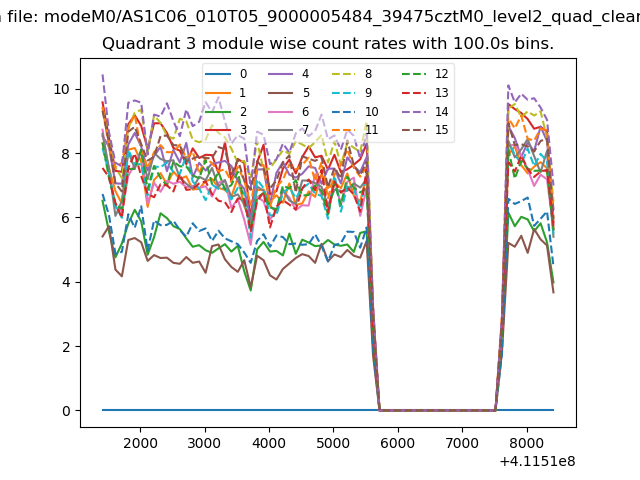
| Module-wise count rates for Quadrant C Data is divided into 100 sec bins |
 |
 |
| Module-wise count rates for Quadrant D Data is divided into 100 sec bins |
 |
 |
| Parameter | Plot |
|---|---|
| CZT HV Monitor | 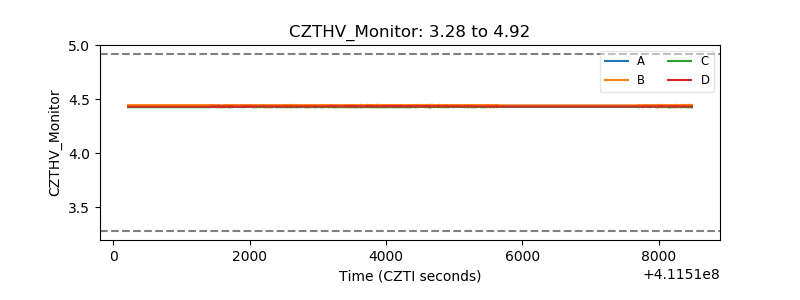 |
| D_VDD | 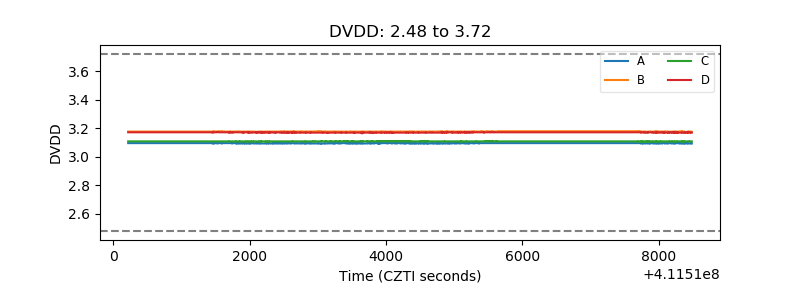 |
| Temperature 1 | 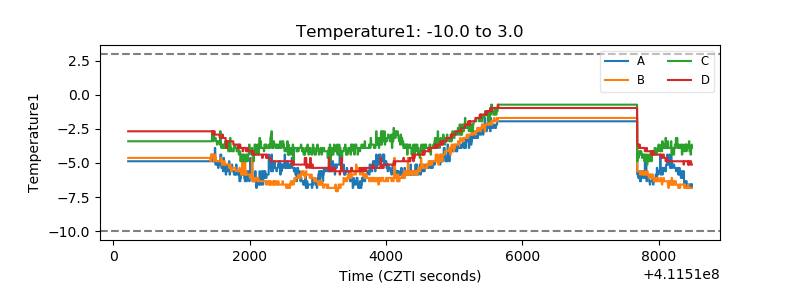 |
| Veto HV Monitor | 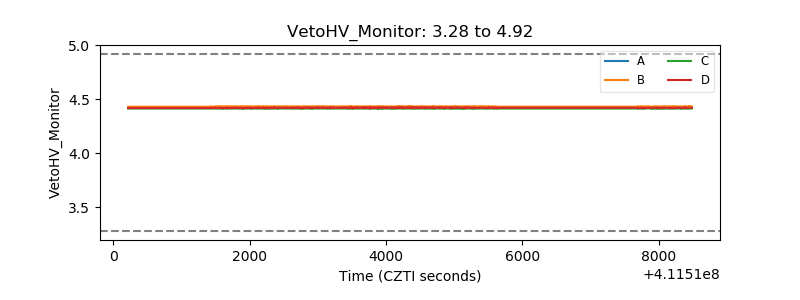 |
| Veto LLD | 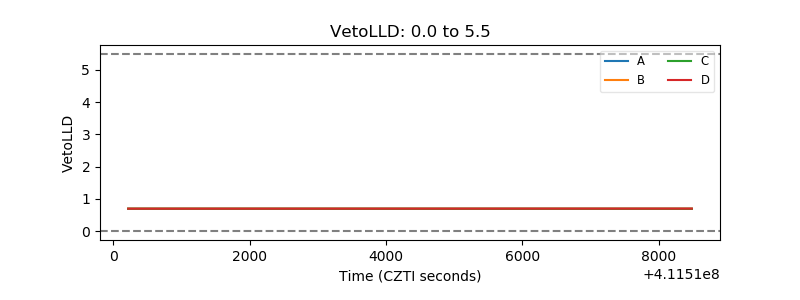 |
| Alpha Counter |  |
| _CPM_Rate | 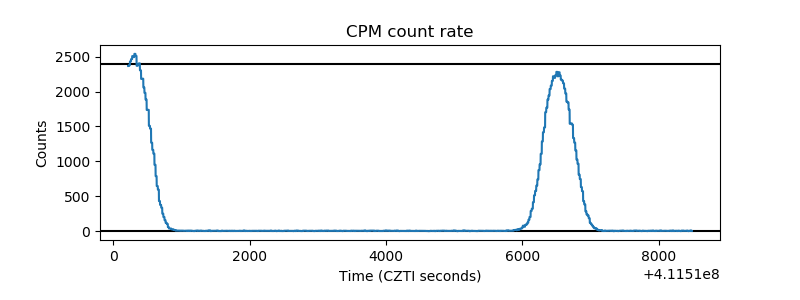 |
| CZT Counter | 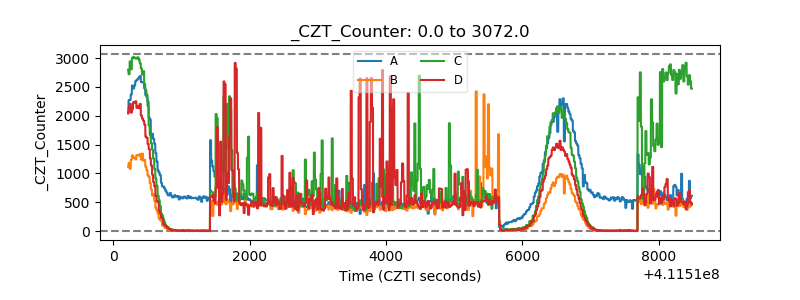 |
| +2.5 Volts monitor | 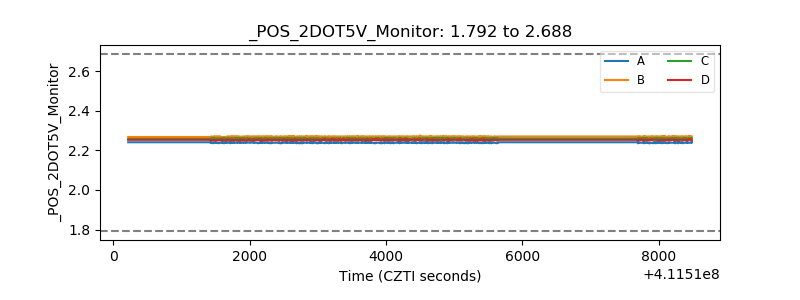 |
| +5 Volts monitor | 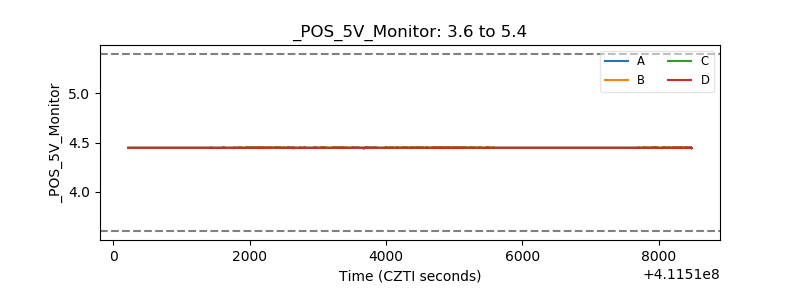 |
| _ROLL_ROT | 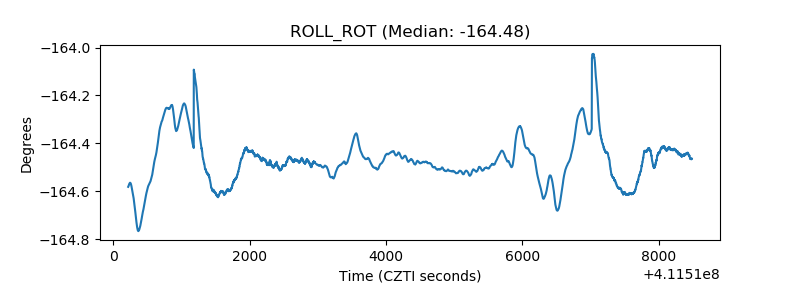 |
| _Roll_DEC |  |
| _Roll_RA | 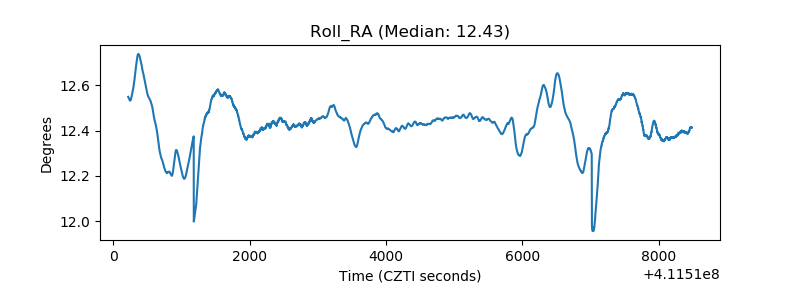 |
| Veto Counter | 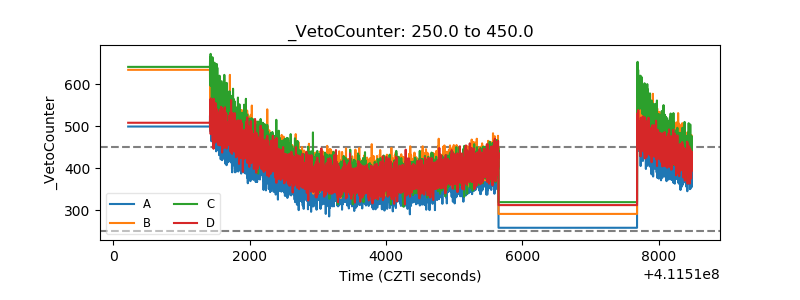 |