| Param | Original file | Final file |
|---|---|---|
| Filename | modeM0/AS1C06_010T05_9000005484_39476cztM0_level2.fits | modeM0/AS1C06_010T05_9000005484_39476cztM0_level2_quad_clean.evt |
| Size (bytes) | 384,125,760 | 82,140,480 |
| Size | 366.3 MB | 78.3 MB |
| Events in quadrant A | 3,200,676 | 566,271 |
| Events in quadrant B | 2,153,282 | 600,932 |
| Events in quadrant C | 4,972,315 | 478,230 |
| Events in quadrant D | 3,515,062 | 501,194 |
| Mode M0 | |||
|---|---|---|---|
| Quadrant | BADHDUFLAG | Total packets | Discarded packets |
| A | 0 | 12606 | 3 |
| B | 0 | 9869 | 2 |
| C | 0 | 18065 | 2 |
| D | 0 | 13748 | 2 |
| Mode SS | |||
|---|---|---|---|
| Quadrant | BADHDUFLAG | Total packets | Discarded packets |
| A | 0 | 100 | 0 |
| B | 0 | 100 | 0 |
| C | 0 | 100 | 0 |
| D | 0 | 100 | 0 |
| Mode M9 | |||
|---|---|---|---|
| Quadrant | BADHDUFLAG | Total packets | Discarded packets |
| A | 0 | 33 | 0 |
| B | 0 | 33 | 0 |
| C | 0 | 33 | 0 |
| D | 0 | 34 | 0 |
| Quadrant | Total seconds | Saturated seconds | Saturation percentage |
|---|---|---|---|
| A | 4853 | 91 | 1.875129% |
| B | 4853 | 4 | 0.082423% |
| C | 4853 | 829 | 17.082217% |
| D | 4853 | 246 | 5.069029% |
Noise dominated data is calculated using 1-second bins in cleaned event files. If a bin has >2000 counts, and if more than 50% of those come from <1% of pixels, then it is considered to be noise-dominated and hence unusable.
| Quadrant | # 1 sec bins | Bins with >0 counts | Bins with >2000 counts | High rate bins dominated by noise | Noise dominated (total time) | Noise dominated (detector-on time) | Marked lightcurve |
|---|---|---|---|---|---|---|---|
| A | 6976 | 4854 | 88 | 88 | 1.26% | 1.81% | 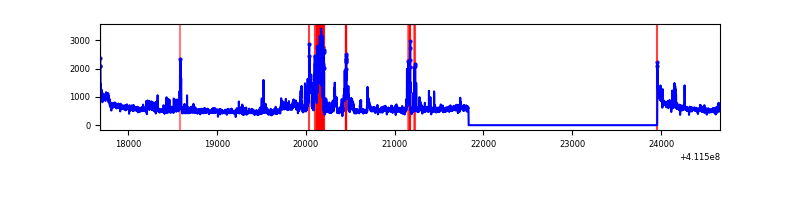 |
| B | 6976 | 4854 | 0 | 0 | 0.00% | 0.00% | 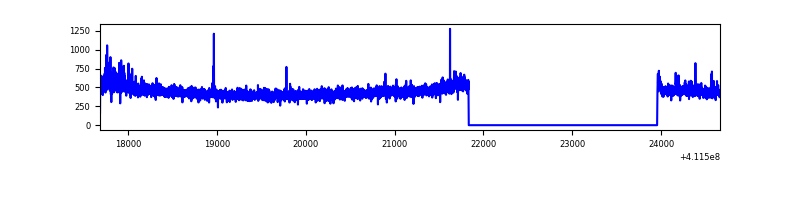 |
| C | 6976 | 4854 | 754 | 754 | 10.81% | 15.53% | 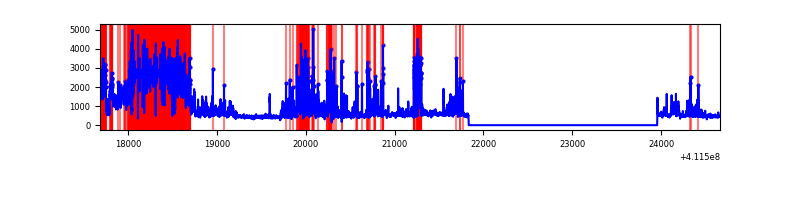 |
| D | 6976 | 4854 | 193 | 193 | 2.77% | 3.98% | 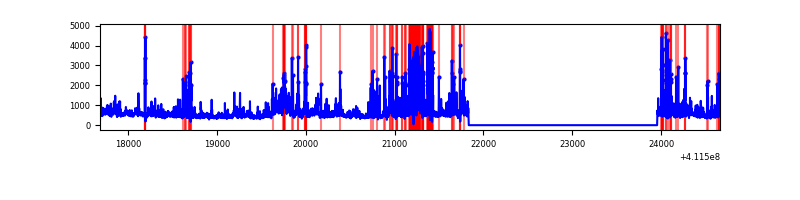 |
Top three noisy pixels from each quadrant. If the there are fewer than three noisy pixels in the level2.evt file, extra rows are filled as -1
| Pixel properties | Quadrant properties | ||||||
|---|---|---|---|---|---|---|---|
| Quadrant | DetID | PixID | Counts | Sigma | Mean | Median | Sigma |
| A | 10 | 83 | 404867 | 3832.59 | 520 | 510 | 105.5 |
| A | 15 | 174 | 396526 | 3753.54 | 520 | 510 | 105.5 |
| A | 15 | 222 | 369456 | 3496.96 | 520 | 510 | 105.5 |
| B | 5 | 172 | 27312 | 266.58 | 530 | 517 | 100.5 |
| B | 0 | 199 | 15764 | 151.69 | 530 | 517 | 100.5 |
| B | 0 | 230 | 14282 | 136.95 | 530 | 517 | 100.5 |
| C | 9 | 187 | 2117763 | 19624.84 | 467 | 469 | 107.9 |
| C | 15 | 208 | 829377 | 7683.01 | 467 | 469 | 107.9 |
| C | 15 | 214 | 186902 | 1728.02 | 467 | 469 | 107.9 |
| D | 2 | 249 | 517886 | 4323.81 | 496 | 482 | 119.7 |
| D | 12 | 227 | 459806 | 3838.45 | 496 | 482 | 119.7 |
| D | 12 | 0 | 324318 | 2706.21 | 496 | 482 | 119.7 |
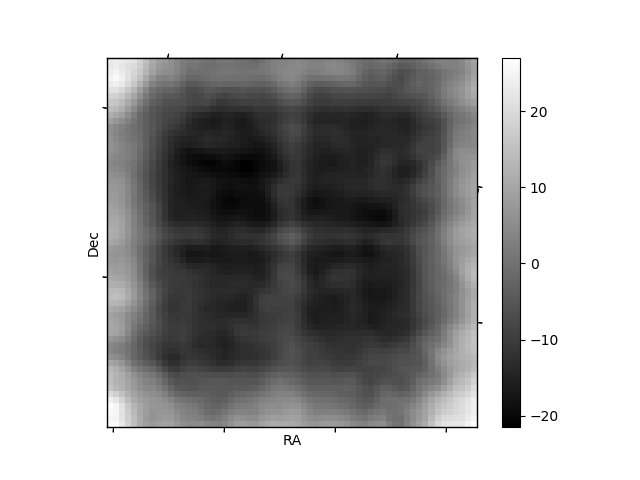
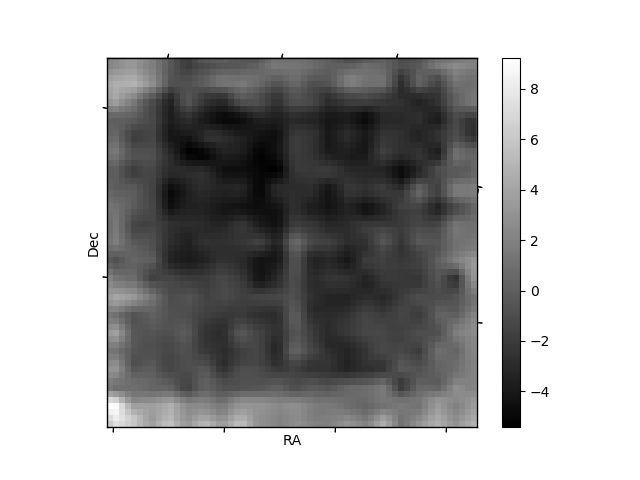
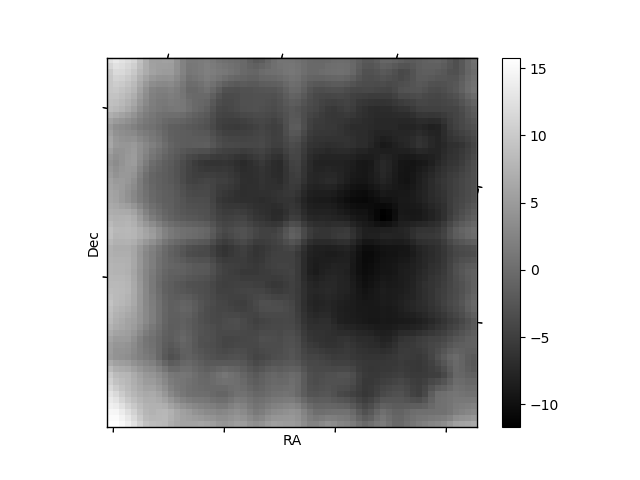
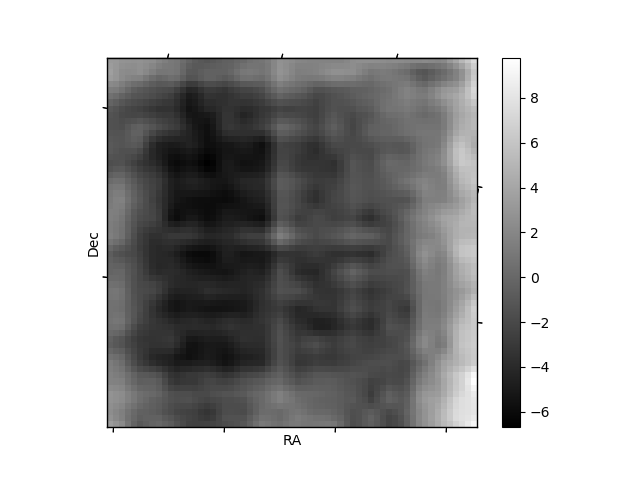
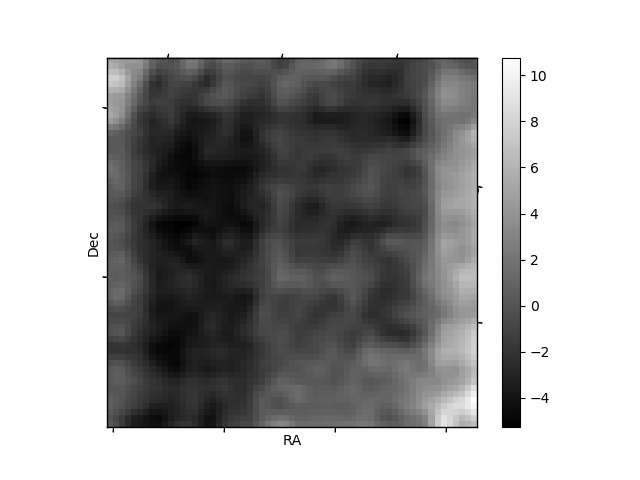
Histogram calculated using DETX and DETY for each event in the final _common_clean file
| Quadrant A | 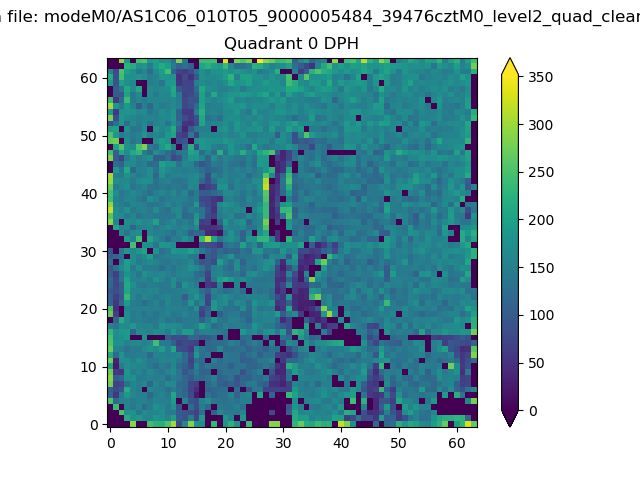 |
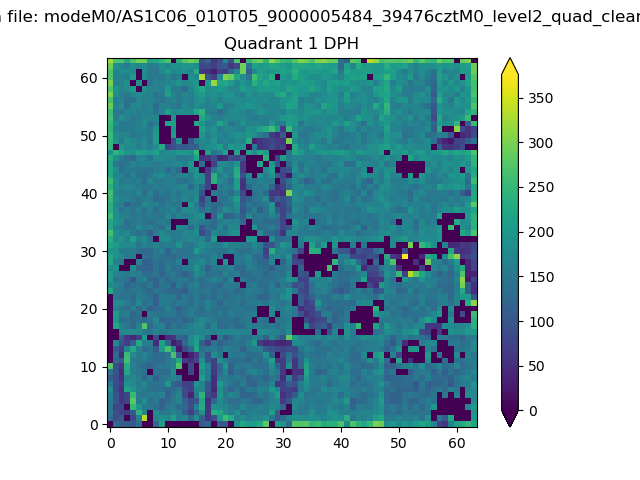 |
Quadrant B |
|---|---|---|---|
| Quadrant D | 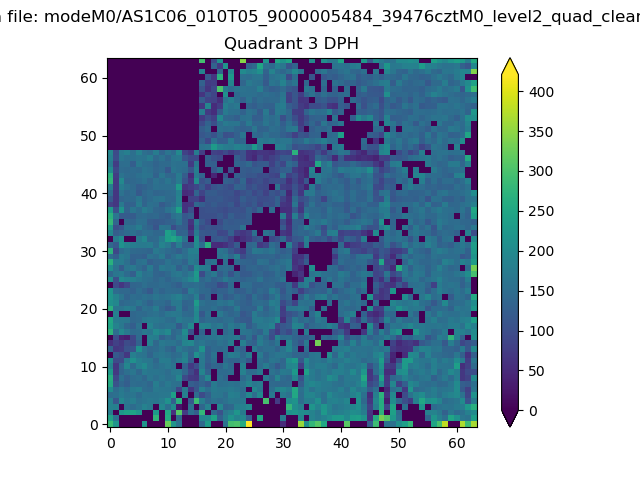 |
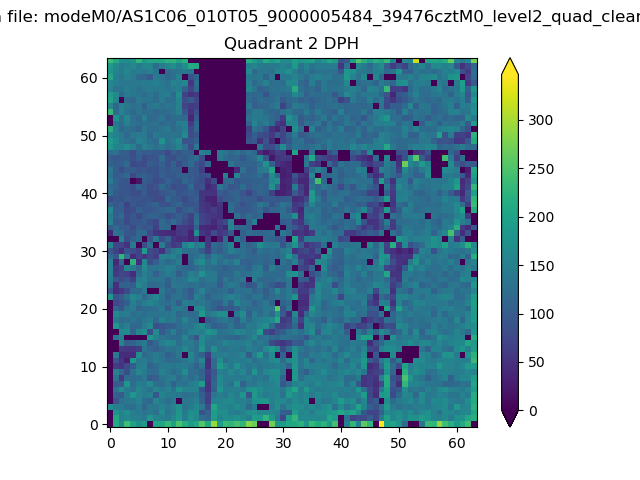 |
Quadrant C |
| Plot type | Count rate plots | Images |
|---|---|---|
| Comparison with Poisson distribution Blue bars denote a histogram of data divided into 1 sec bins. Red curve is a Poisson curve with rate = median count rate of data. |
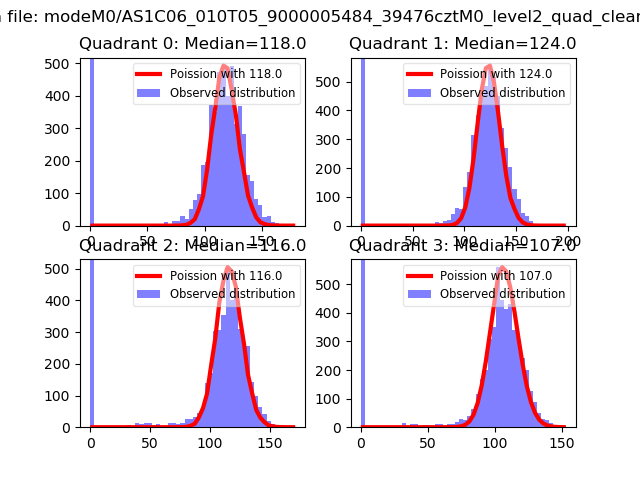 |
 |
| Quadrant-wise count rates Data is divided into 100 sec bins |
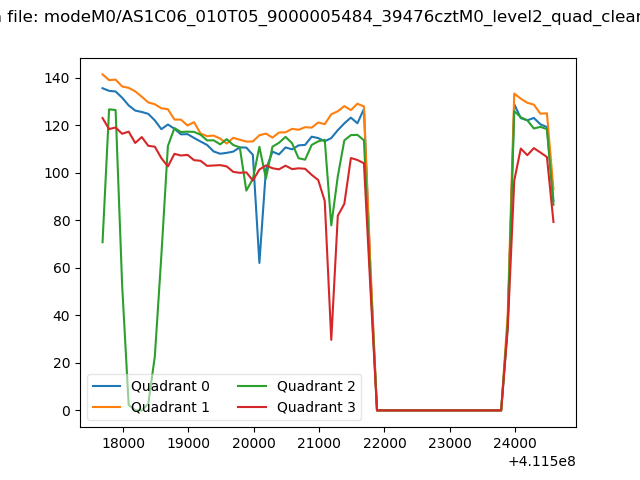 |
|
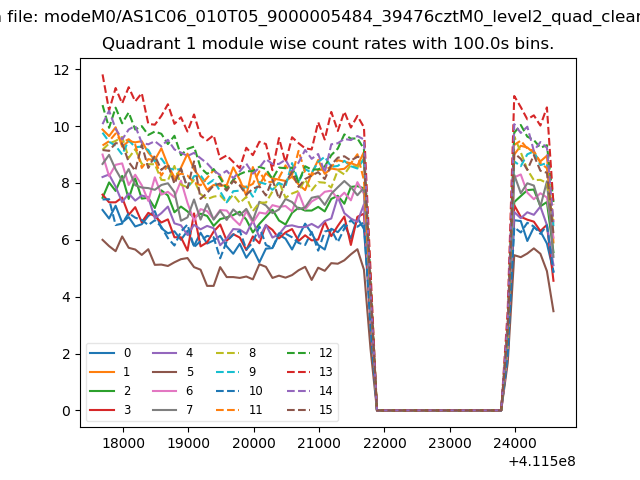
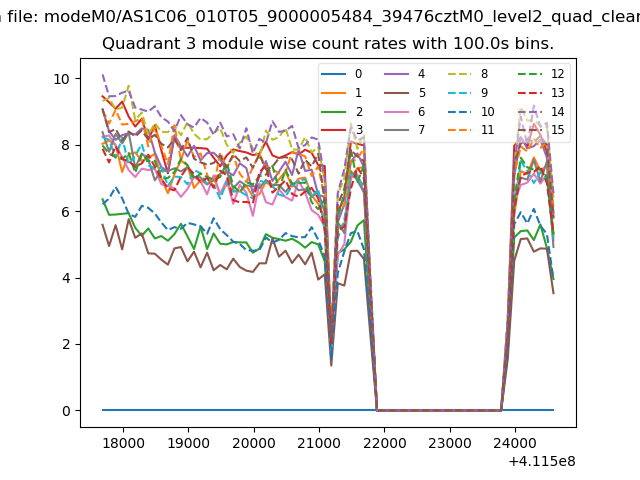
| Module-wise count rates for Quadrant A Data is divided into 100 sec bins |
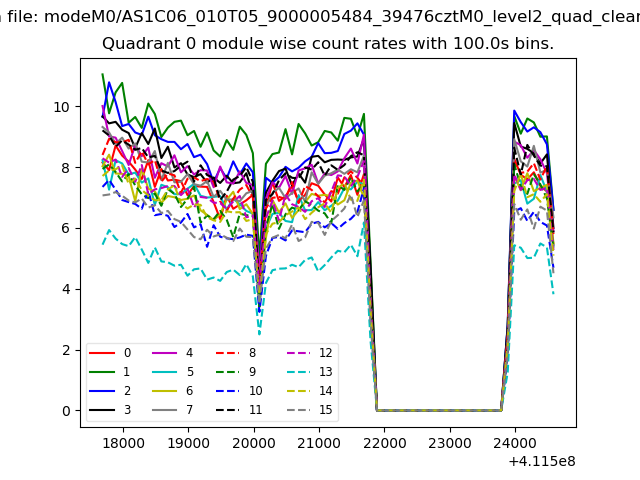 |
 |
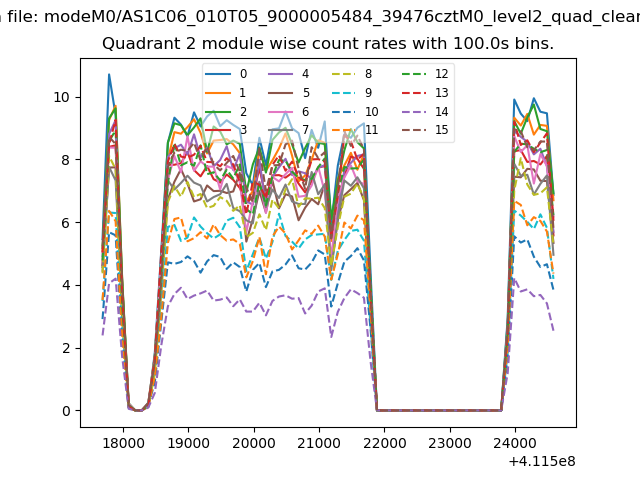
| Module-wise count rates for Quadrant B Data is divided into 100 sec bins |
 |
 |
| Module-wise count rates for Quadrant C Data is divided into 100 sec bins |
 |
 |
| Module-wise count rates for Quadrant D Data is divided into 100 sec bins |
 |
 |
| Parameter | Plot |
|---|---|
| CZT HV Monitor | 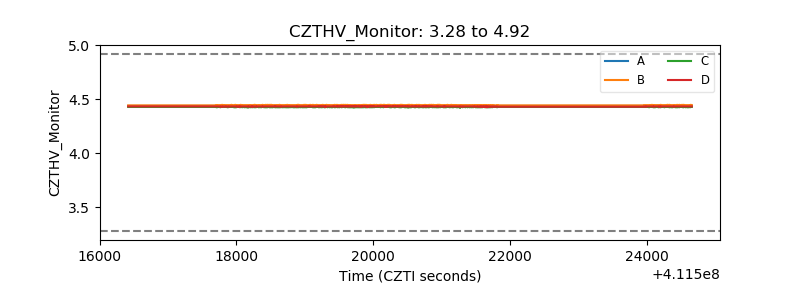 |
| D_VDD |  |
| Temperature 1 | 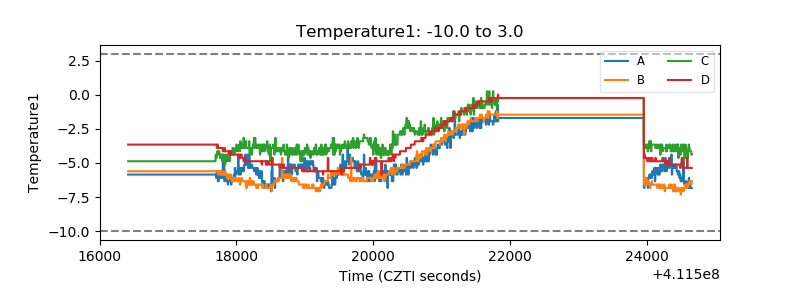 |
| Veto HV Monitor | 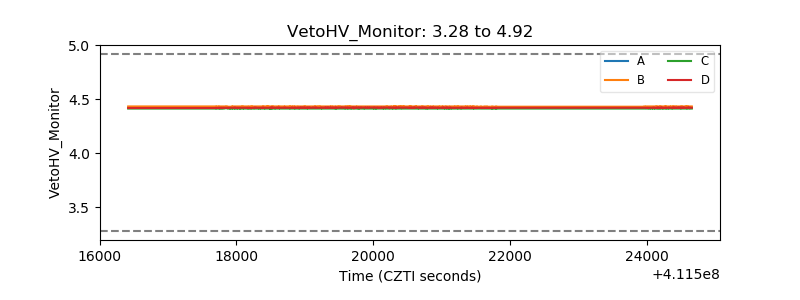 |
| Veto LLD | 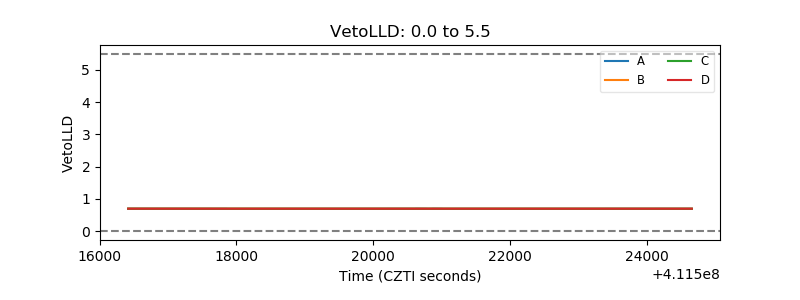 |
| Alpha Counter | 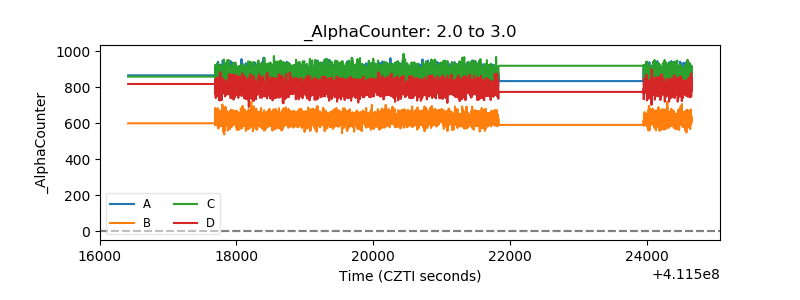 |
| _CPM_Rate | 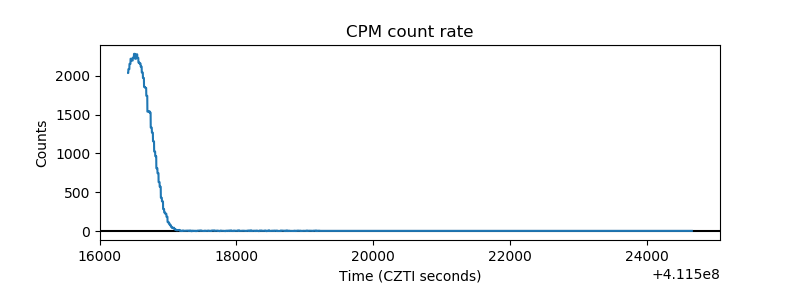 |
| CZT Counter | 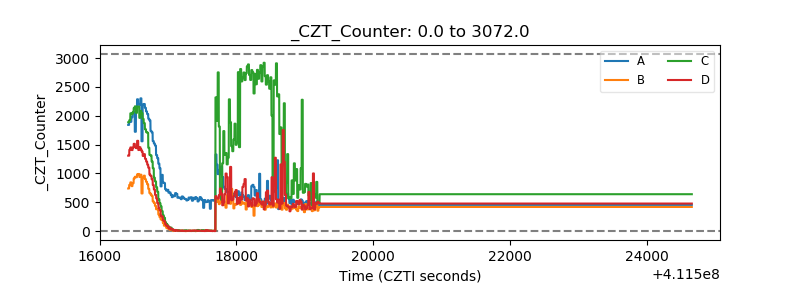 |
| +2.5 Volts monitor | 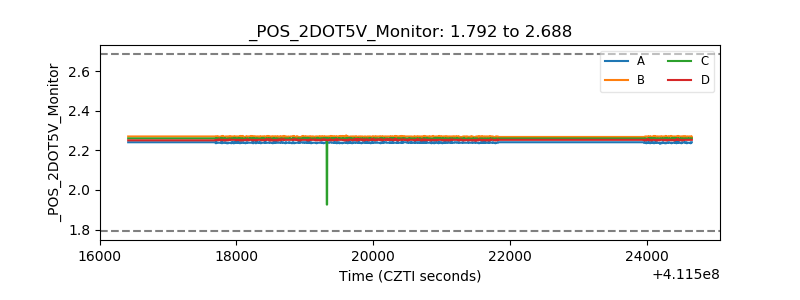 |
| +5 Volts monitor | 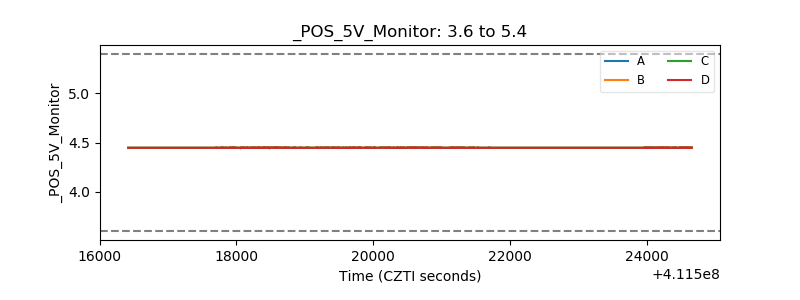 |
| _ROLL_ROT | 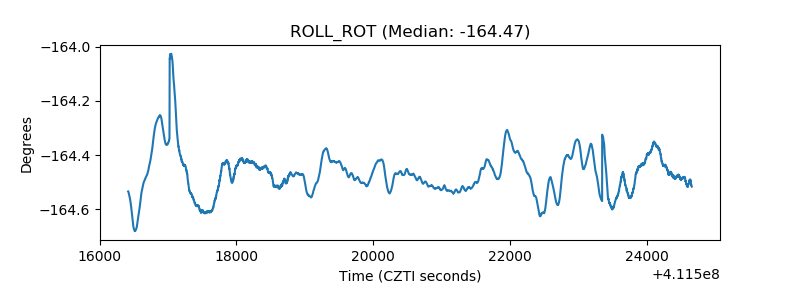 |
| _Roll_DEC | 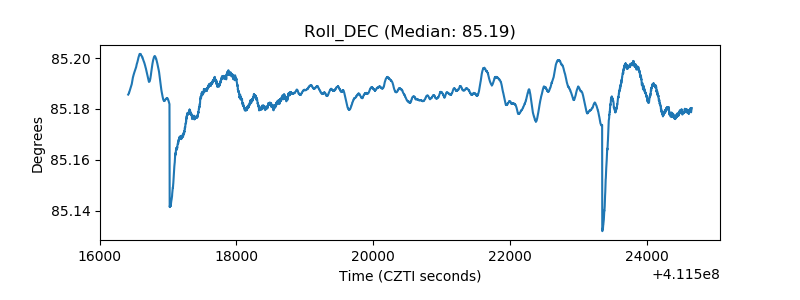 |
| _Roll_RA | 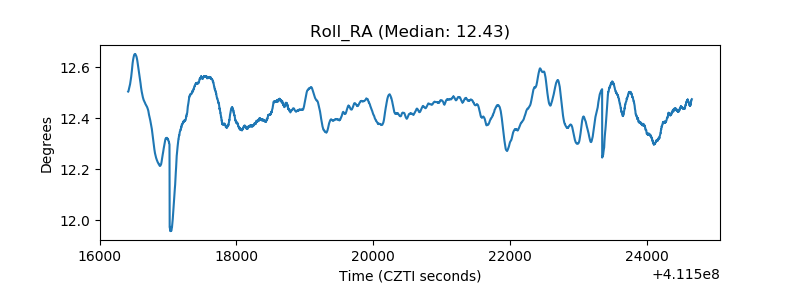 |
| Veto Counter | 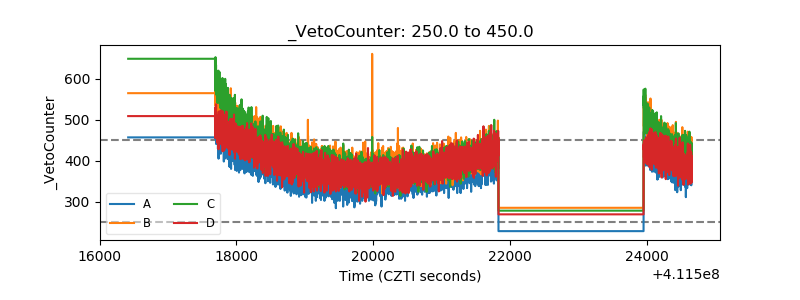 |