| Param | Original file | Final file |
|---|---|---|
| Filename | modeM0/AS1C06_010T05_9000005484_39477cztM0_level2.fits | modeM0/AS1C06_010T05_9000005484_39477cztM0_level2_quad_clean.evt |
| Size (bytes) | 923,040,000 | 205,660,800 |
| Size | 880.3 MB | 196.1 MB |
| Events in quadrant A | 7,272,377 | 1,422,182 |
| Events in quadrant B | 5,590,186 | 1,494,936 |
| Events in quadrant C | 9,241,031 | 1,328,297 |
| Events in quadrant D | 11,110,813 | 1,130,675 |
| Mode M0 | |||
|---|---|---|---|
| Quadrant | BADHDUFLAG | Total packets | Discarded packets |
| A | 0 | 29223 | 2 |
| B | 0 | 25633 | 2 |
| C | 0 | 35793 | 2 |
| D | 0 | 41400 | 2 |
| Mode SS | |||
|---|---|---|---|
| Quadrant | BADHDUFLAG | Total packets | Discarded packets |
| A | 0 | 252 | 0 |
| B | 0 | 252 | 0 |
| C | 0 | 252 | 0 |
| D | 0 | 252 | 0 |
| Mode M9 | |||
|---|---|---|---|
| Quadrant | BADHDUFLAG | Total packets | Discarded packets |
| A | 0 | 43 | 0 |
| B | 0 | 43 | 0 |
| C | 0 | 43 | 0 |
| D | 0 | 43 | 0 |
| Quadrant | Total seconds | Saturated seconds | Saturation percentage |
|---|---|---|---|
| A | 12316 | 122 | 0.990581% |
| B | 12316 | 48 | 0.389737% |
| C | 12316 | 910 | 7.388763% |
| D | 12316 | 1686 | 13.689510% |
Noise dominated data is calculated using 1-second bins in cleaned event files. If a bin has >2000 counts, and if more than 50% of those come from <1% of pixels, then it is considered to be noise-dominated and hence unusable.
| Quadrant | # 1 sec bins | Bins with >0 counts | Bins with >2000 counts | High rate bins dominated by noise | Noise dominated (total time) | Noise dominated (detector-on time) | Marked lightcurve |
|---|---|---|---|---|---|---|---|
| A | 16473 | 12318 | 111 | 111 | 0.67% | 0.90% | 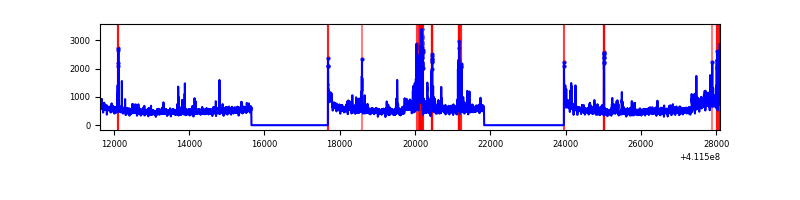 |
| B | 16473 | 12318 | 13 | 13 | 0.08% | 0.11% | 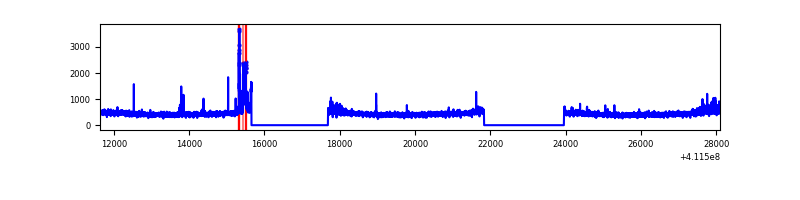 |
| C | 16473 | 12318 | 842 | 842 | 5.11% | 6.84% | 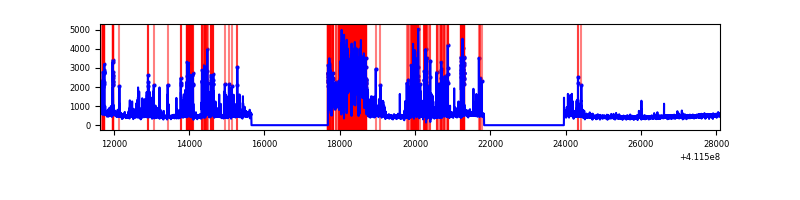 |
| D | 16473 | 12318 | 1340 | 1340 | 8.13% | 10.88% | 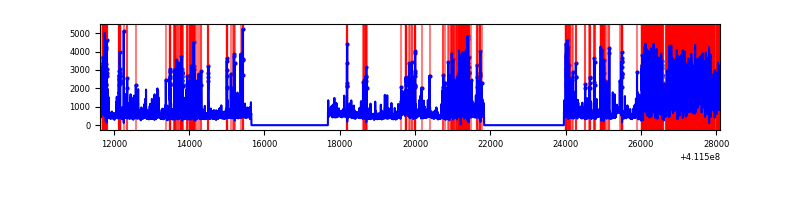 |
Top three noisy pixels from each quadrant. If the there are fewer than three noisy pixels in the level2.evt file, extra rows are filled as -1
| Pixel properties | Quadrant properties | ||||||
|---|---|---|---|---|---|---|---|
| Quadrant | DetID | PixID | Counts | Sigma | Mean | Median | Sigma |
| A | 15 | 222 | 901239 | 3395.53 | 1319 | 1291 | 265.0 |
| A | 10 | 83 | 795435 | 2996.33 | 1319 | 1291 | 265.0 |
| A | 15 | 174 | 436949 | 1643.75 | 1319 | 1291 | 265.0 |
| B | 8 | 3 | 213988 | 862.03 | 1331 | 1297 | 246.7 |
| B | 0 | 199 | 48643 | 191.89 | 1331 | 1297 | 246.7 |
| B | 5 | 172 | 43285 | 170.18 | 1331 | 1297 | 246.7 |
| C | 9 | 187 | 2286767 | 8011.23 | 1245 | 1252 | 285.3 |
| C | 15 | 208 | 1586006 | 5554.91 | 1245 | 1252 | 285.3 |
| C | 15 | 214 | 483365 | 1689.91 | 1245 | 1252 | 285.3 |
| D | 2 | 249 | 3384175 | 11619.24 | 1206 | 1171 | 291.2 |
| D | 12 | 227 | 1550807 | 5322.37 | 1206 | 1171 | 291.2 |
| D | 12 | 0 | 640010 | 2194.15 | 1206 | 1171 | 291.2 |
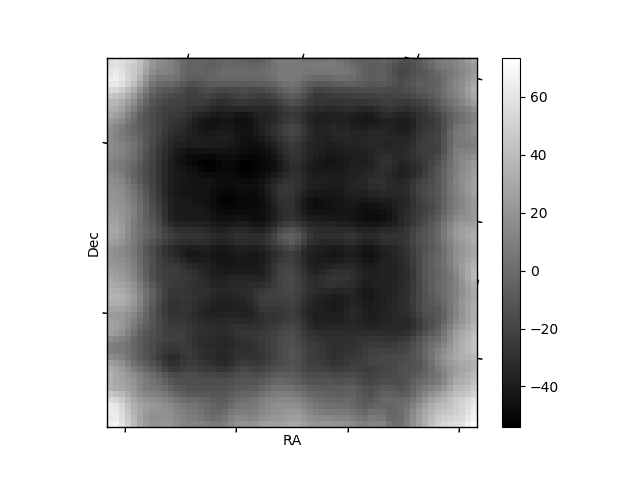
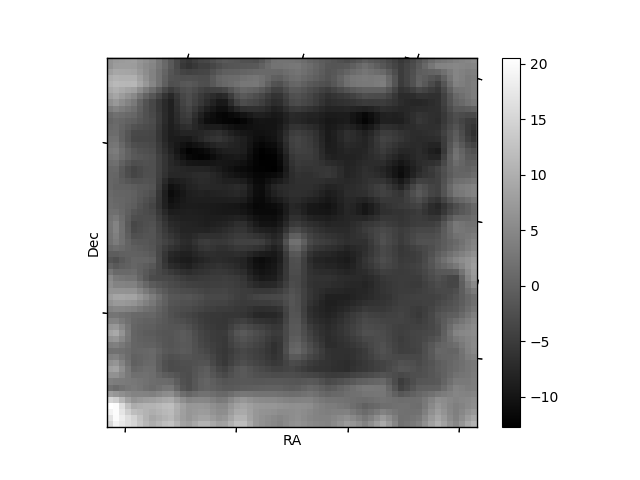
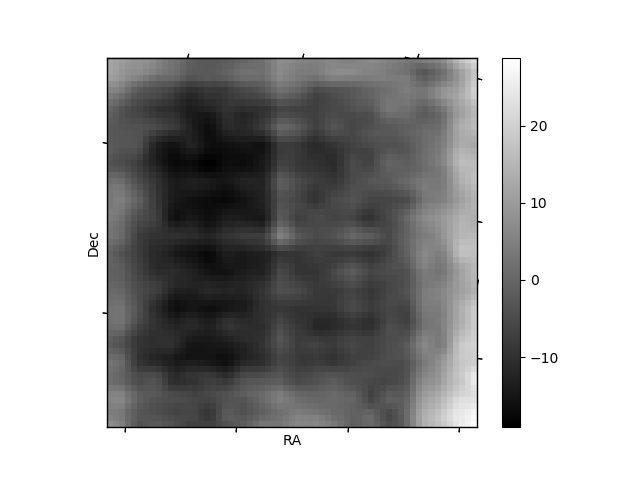
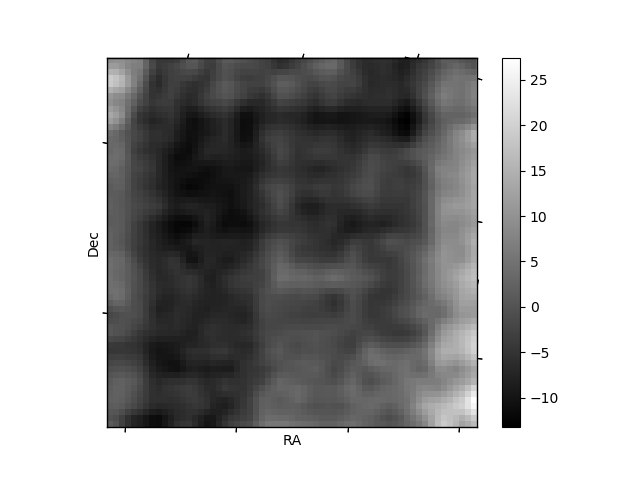
Histogram calculated using DETX and DETY for each event in the final _common_clean file
| Quadrant A | 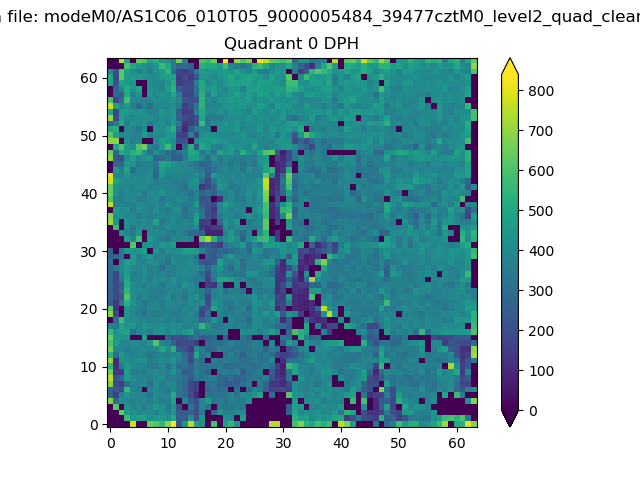 |
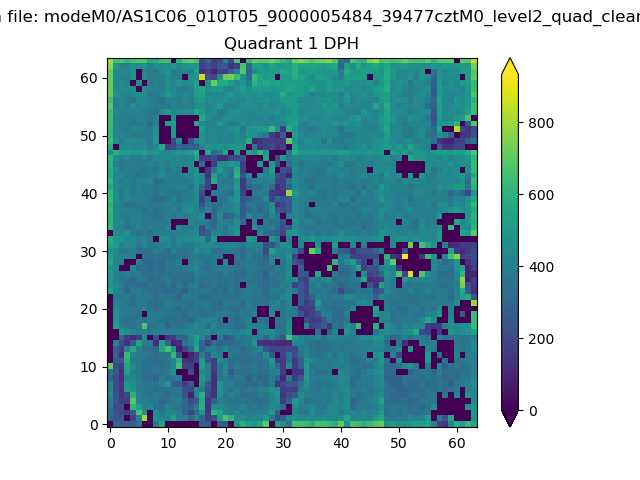 |
Quadrant B |
|---|---|---|---|
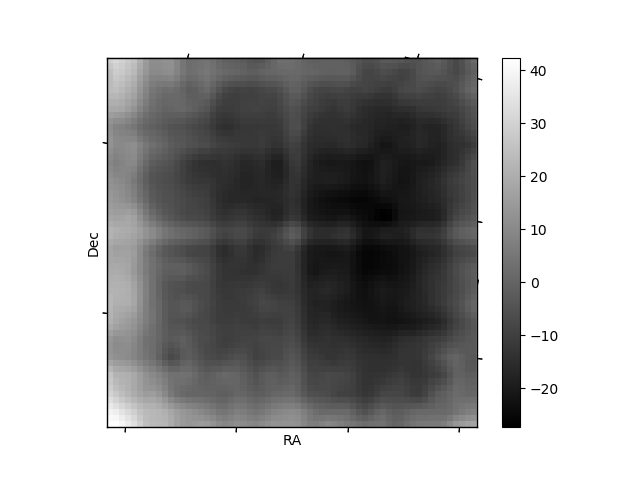
| Quadrant D | 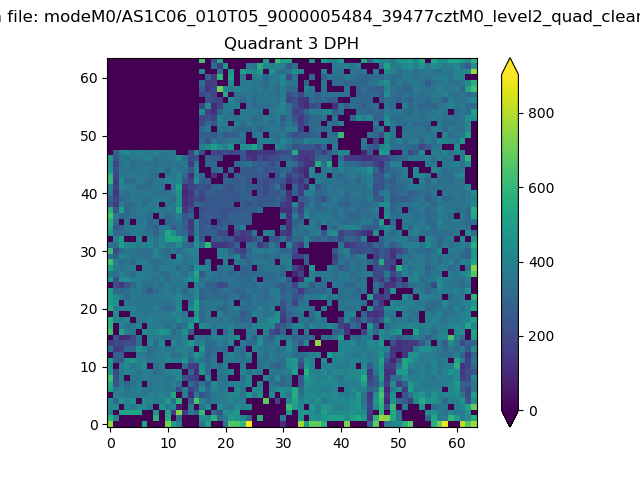 |
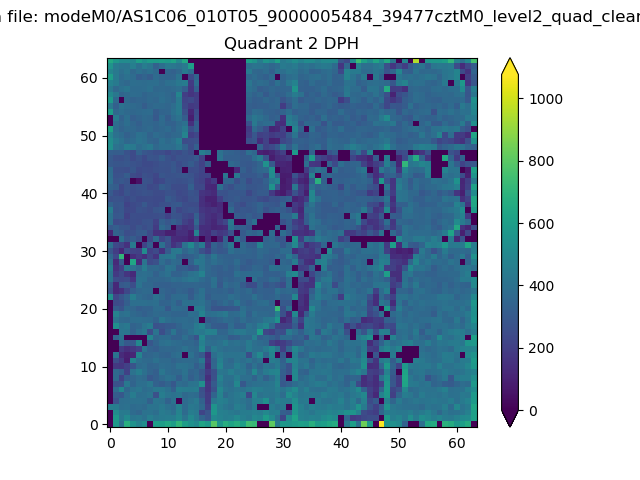 |
Quadrant C |
| Plot type | Count rate plots | Images |
|---|---|---|
| Comparison with Poisson distribution Blue bars denote a histogram of data divided into 1 sec bins. Red curve is a Poisson curve with rate = median count rate of data. |
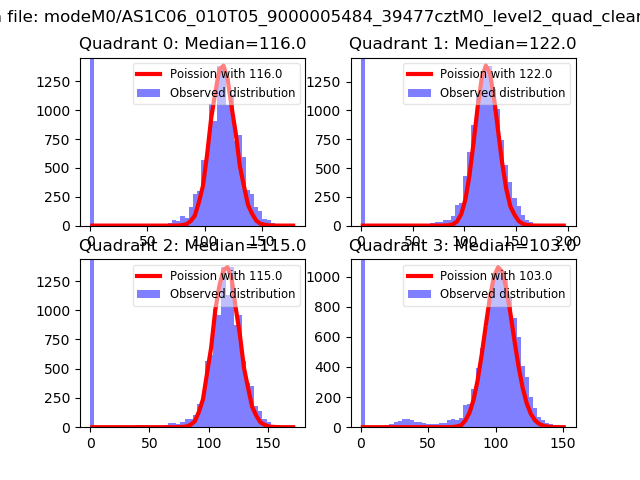 |
 |
| Quadrant-wise count rates Data is divided into 100 sec bins |
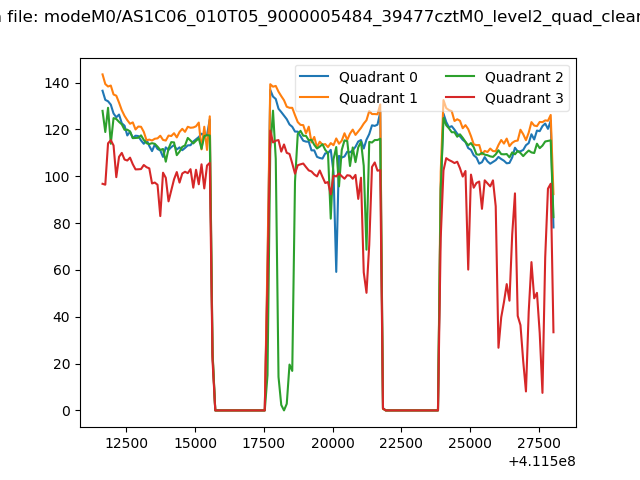 |
|
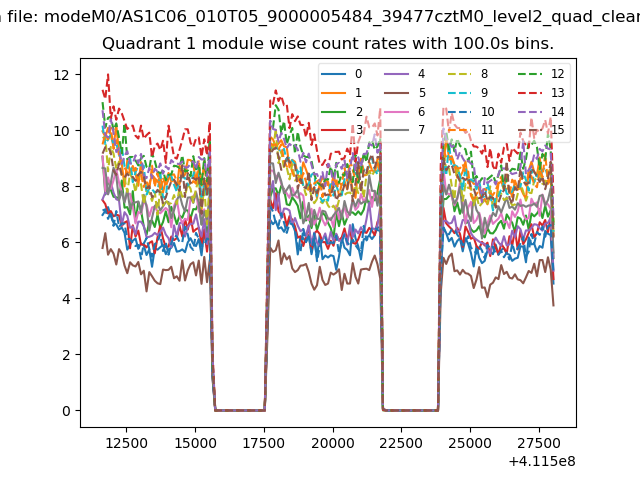
| Module-wise count rates for Quadrant A Data is divided into 100 sec bins |
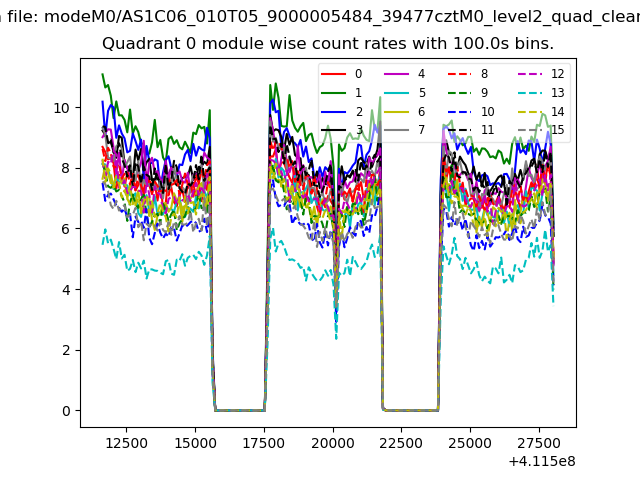 |
 |
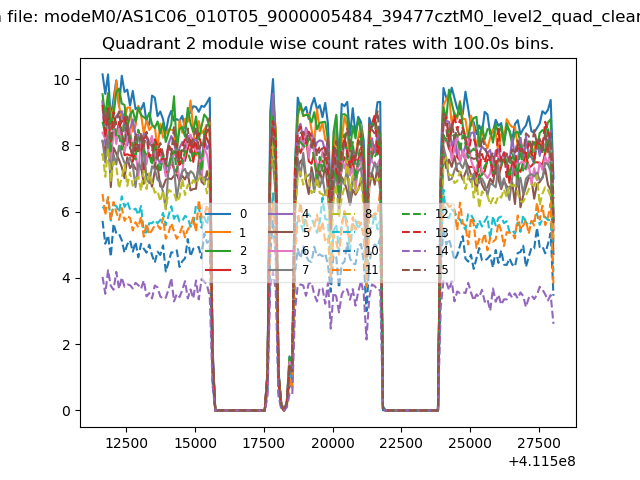
| Module-wise count rates for Quadrant B Data is divided into 100 sec bins |
 |
 |
| Module-wise count rates for Quadrant C Data is divided into 100 sec bins |
 |
 |
| Module-wise count rates for Quadrant D Data is divided into 100 sec bins |
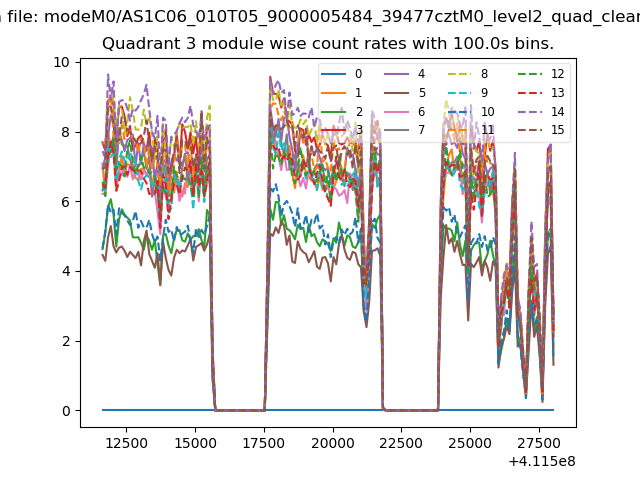 |
 |
| Parameter | Plot |
|---|---|
| CZT HV Monitor | 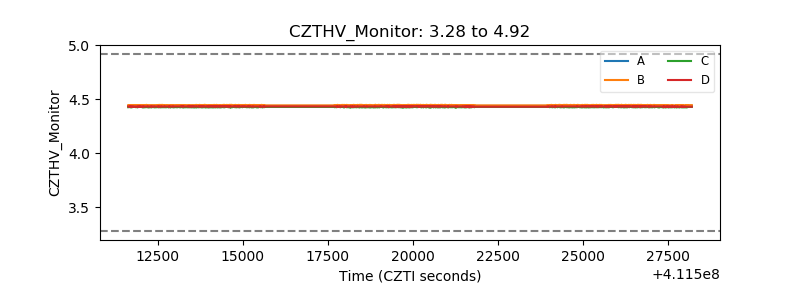 |
| D_VDD |  |
| Temperature 1 | 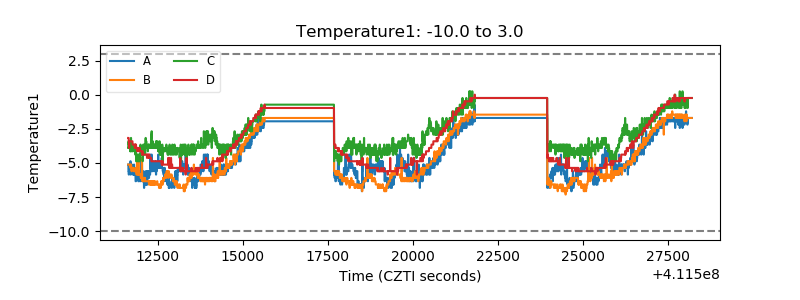 |
| Veto HV Monitor | 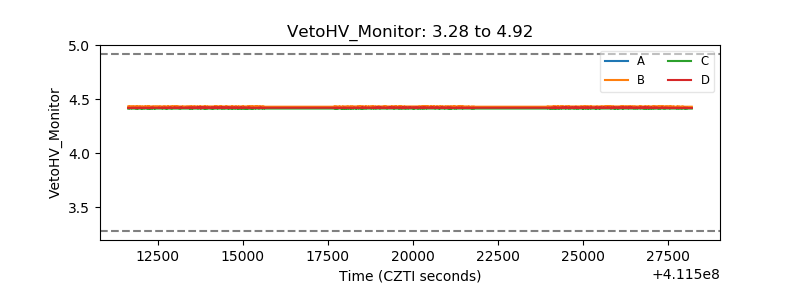 |
| Veto LLD | 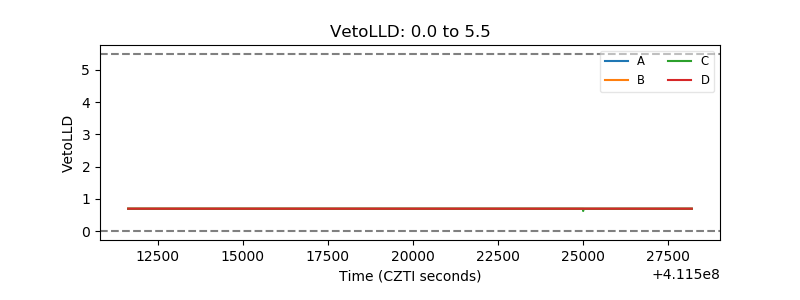 |
| Alpha Counter | 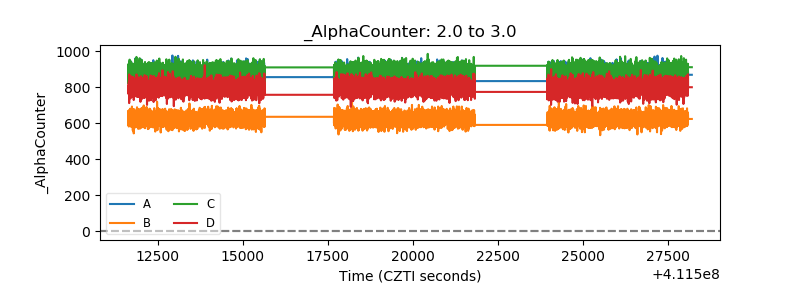 |
| _CPM_Rate | 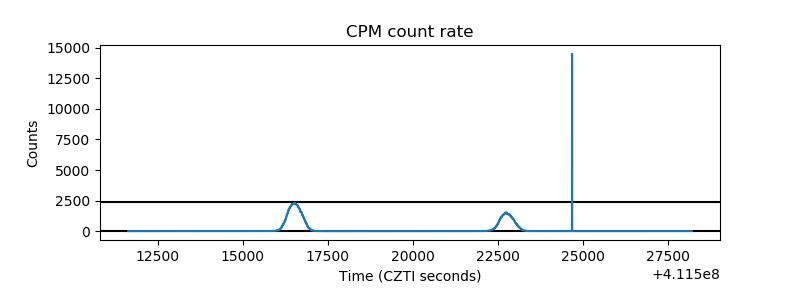 |
| CZT Counter | 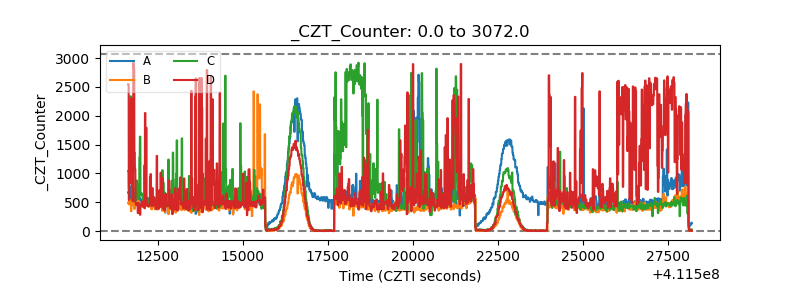 |
| +2.5 Volts monitor |  |
| +5 Volts monitor | 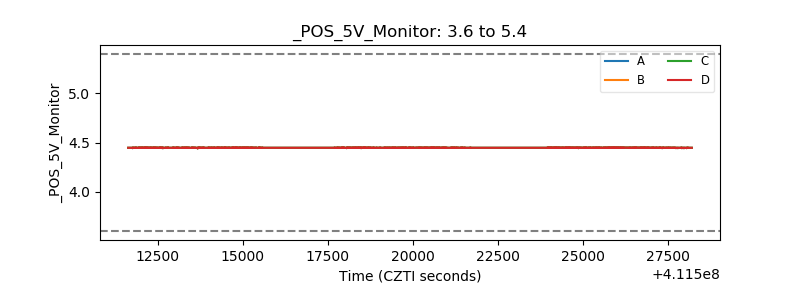 |
| _ROLL_ROT | 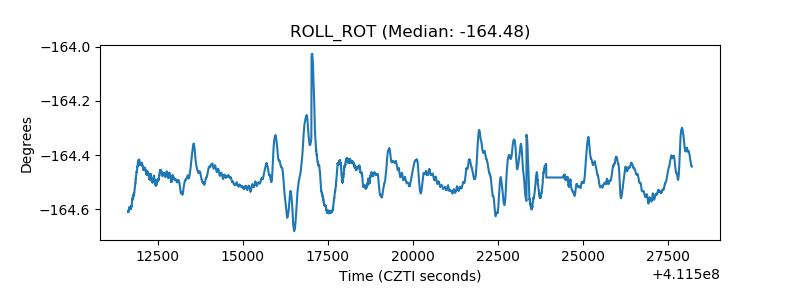 |
| _Roll_DEC | 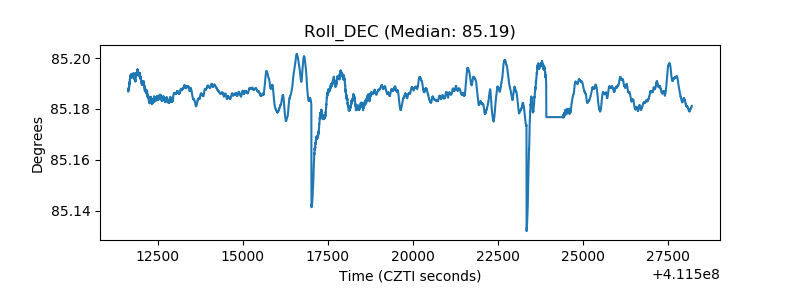 |
| _Roll_RA | 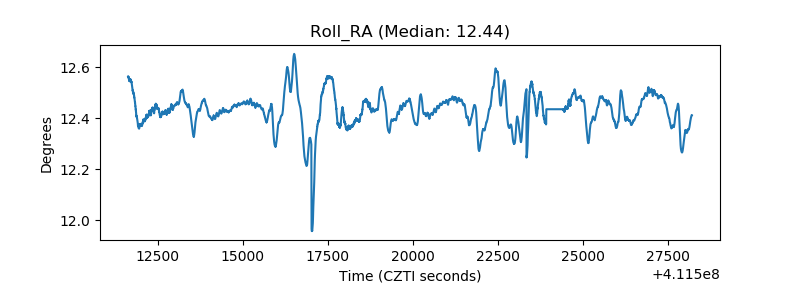 |
| Veto Counter | 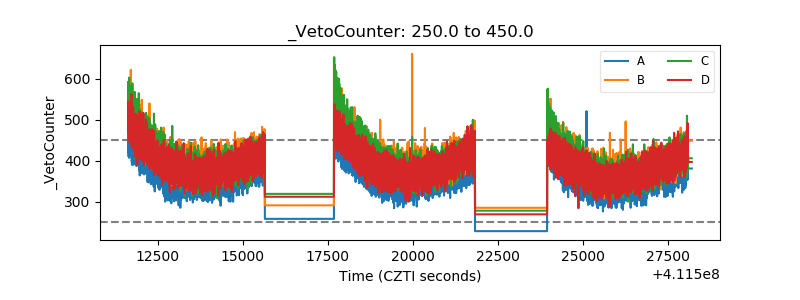 |