| Param | Original file | Final file |
|---|---|---|
| Filename | modeM0/AS1C07_001T02_9000005486_39477cztM0_level2.fits | modeM0/AS1C07_001T02_9000005486_39477cztM0_level2_quad_clean.evt |
| Size (bytes) | 117,613,440 | 18,028,800 |
| Size | 112.2 MB | 17.2 MB |
| Events in quadrant A | 1,152,787 | 124,469 |
| Events in quadrant B | 495,699 | 134,865 |
| Events in quadrant C | 572,985 | 128,180 |
| Events in quadrant D | 2,039,861 | 71,530 |
| Mode M0 | |||
|---|---|---|---|
| Quadrant | BADHDUFLAG | Total packets | Discarded packets |
| A | 0 | 4212 | 5 |
| B | 0 | 2330 | 1 |
| C | 0 | 2474 | 1 |
| D | 0 | 6851 | 1 |
| Mode M9 | |||
|---|---|---|---|
| Quadrant | BADHDUFLAG | Total packets | Discarded packets |
| A | 0 | 15 | 0 |
| B | 0 | 15 | 0 |
| C | 0 | 15 | 0 |
| D | 0 | 15 | 0 |
| Mode SS | |||
|---|---|---|---|
| Quadrant | BADHDUFLAG | Total packets | Discarded packets |
| A | 0 | 22 | 0 |
| B | 0 | 22 | 0 |
| C | 0 | 22 | 0 |
| D | 0 | 22 | 0 |
| Quadrant | Total seconds | Saturated seconds | Saturation percentage |
|---|---|---|---|
| A | 1150 | 75 | 6.521739% |
| B | 1151 | 4 | 0.347524% |
| C | 1151 | 5 | 0.434405% |
| D | 1151 | 518 | 45.004344% |
Noise dominated data is calculated using 1-second bins in cleaned event files. If a bin has >2000 counts, and if more than 50% of those come from <1% of pixels, then it is considered to be noise-dominated and hence unusable.
| Quadrant | # 1 sec bins | Bins with >0 counts | Bins with >2000 counts | High rate bins dominated by noise | Noise dominated (total time) | Noise dominated (detector-on time) | Marked lightcurve |
|---|---|---|---|---|---|---|---|
| A | 1151 | 1151 | 92 | 92 | 7.99% | 7.99% | 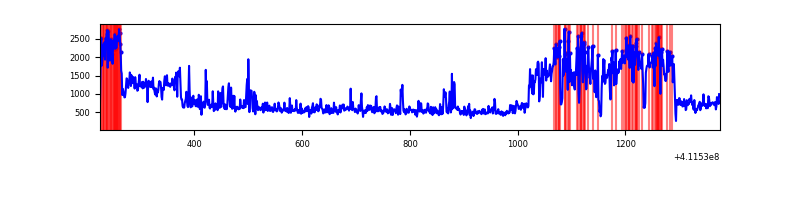 |
| B | 1151 | 1151 | 1 | 1 | 0.09% | 0.09% | 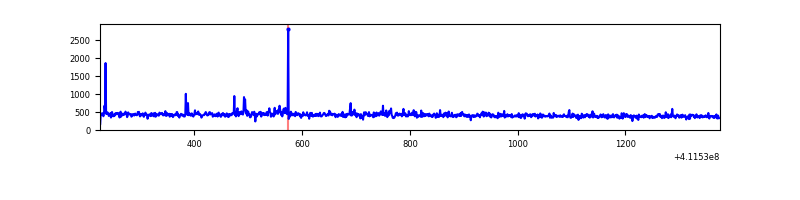 |
| C | 1151 | 1151 | 0 | 0 | 0.00% | 0.00% | 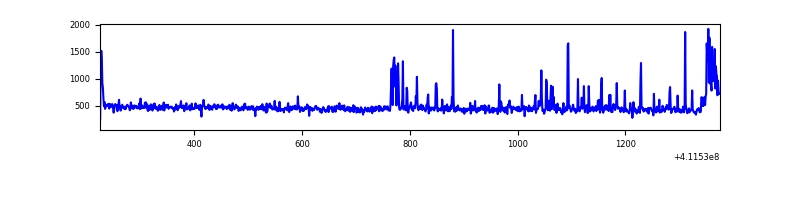 |
| D | 1150 | 1150 | 495 | 495 | 43.04% | 43.04% | 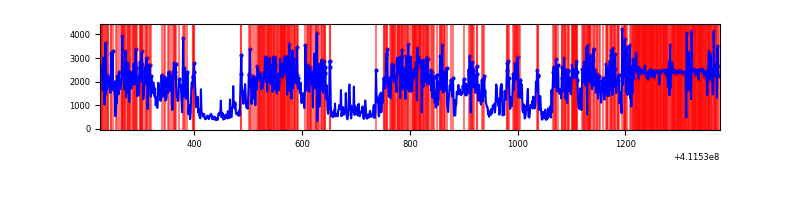 |
Top three noisy pixels from each quadrant. If the there are fewer than three noisy pixels in the level2.evt file, extra rows are filled as -1
| Pixel properties | Quadrant properties | ||||||
|---|---|---|---|---|---|---|---|
| Quadrant | DetID | PixID | Counts | Sigma | Mean | Median | Sigma |
| A | 15 | 222 | 550092 | 21512.08 | 116 | 114 | 25.6 |
| A | 10 | 83 | 139853 | 5465.81 | 116 | 114 | 25.6 |
| A | 15 | 174 | 7911 | 304.98 | 116 | 114 | 25.6 |
| B | 5 | 172 | 14739 | 573.17 | 121 | 118 | 25.5 |
| B | 12 | 111 | 3033 | 114.27 | 121 | 118 | 25.5 |
| B | 11 | 111 | 2647 | 99.14 | 121 | 118 | 25.5 |
| C | 15 | 208 | 59896 | 2040.56 | 117 | 117 | 29.3 |
| C | 15 | 214 | 52444 | 1786.19 | 117 | 117 | 29.3 |
| C | 0 | 10 | 4276 | 141.97 | 117 | 117 | 29.3 |
| D | 2 | 249 | 1522070 | 62495.81 | 89 | 86 | 24.4 |
| D | 12 | 227 | 91032 | 3734.43 | 89 | 86 | 24.4 |
| D | 13 | 249 | 58034 | 2379.46 | 89 | 86 | 24.4 |
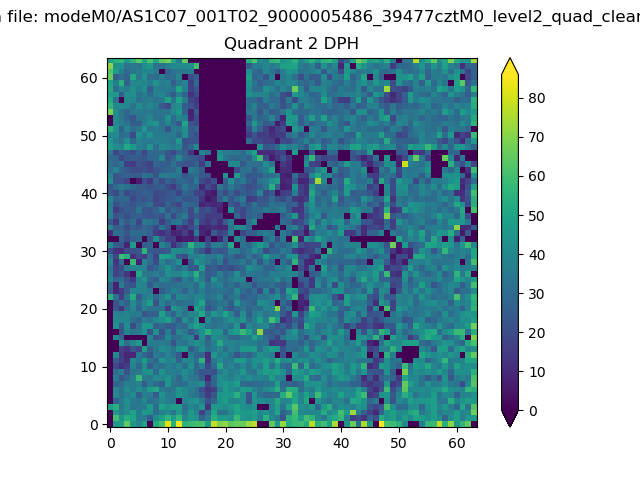
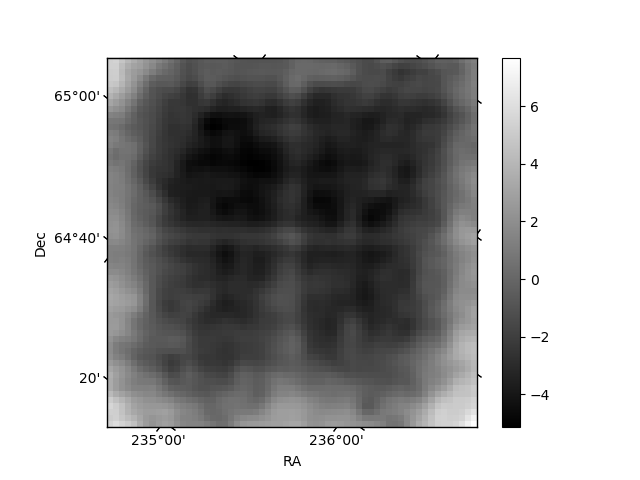
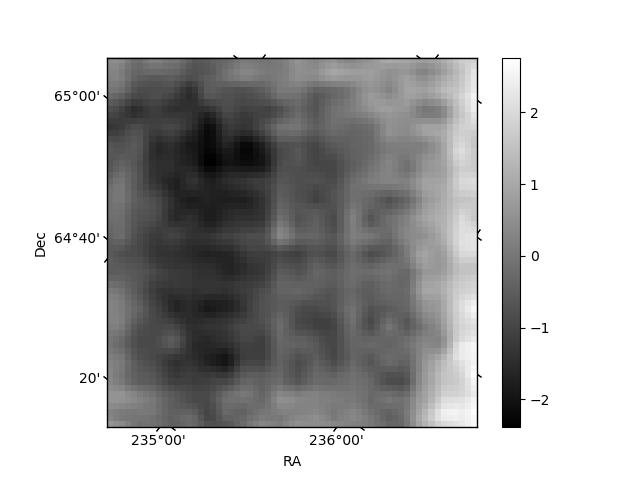
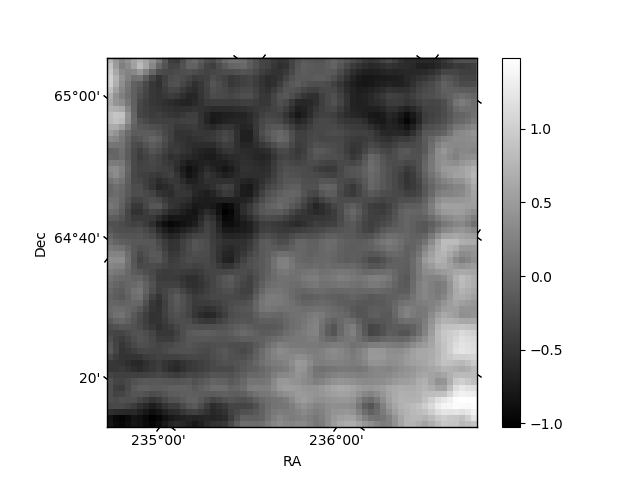
Histogram calculated using DETX and DETY for each event in the final _common_clean file
| Quadrant A | 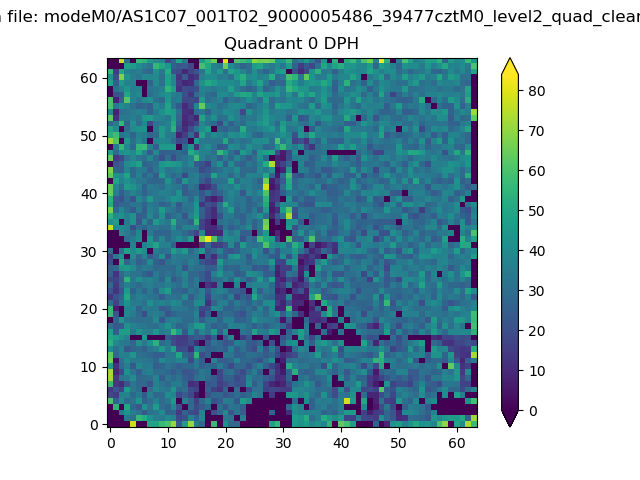 |
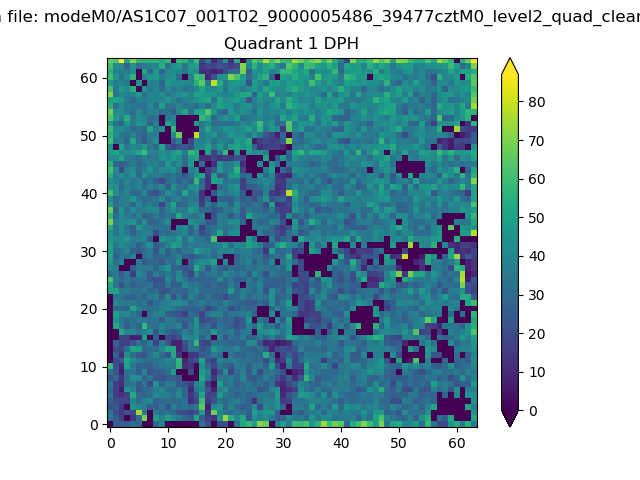 |
Quadrant B |
|---|---|---|---|
| Quadrant D | 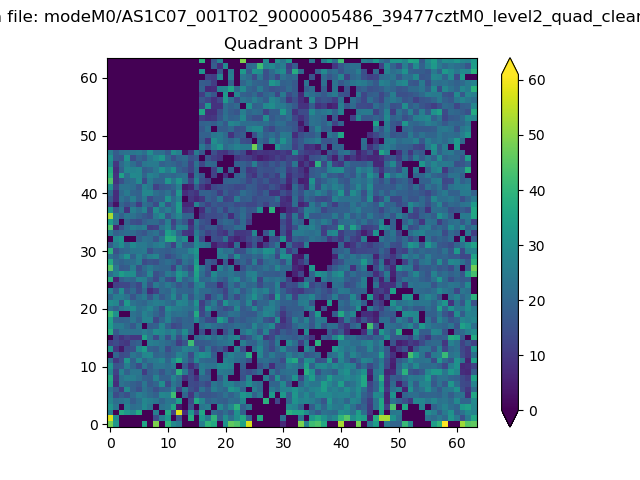 |
 |
Quadrant C |
| Plot type | Count rate plots | Images |
|---|---|---|
| Comparison with Poisson distribution Blue bars denote a histogram of data divided into 1 sec bins. Red curve is a Poisson curve with rate = median count rate of data. |
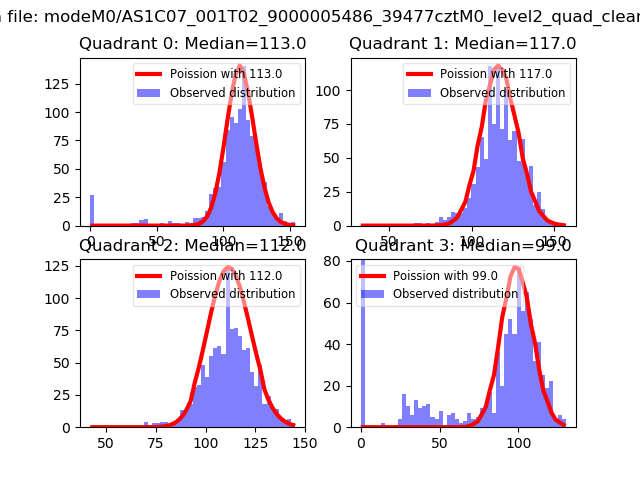 |
 |
| Quadrant-wise count rates Data is divided into 100 sec bins |
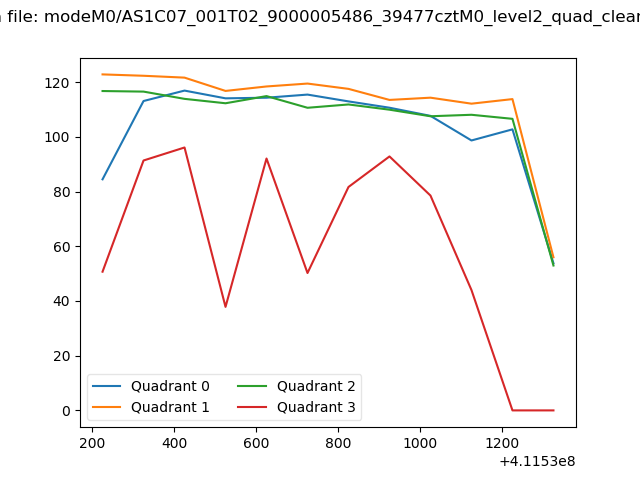 |
|
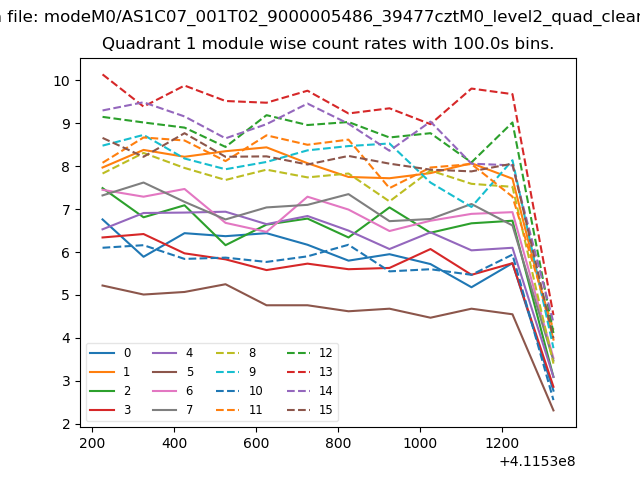
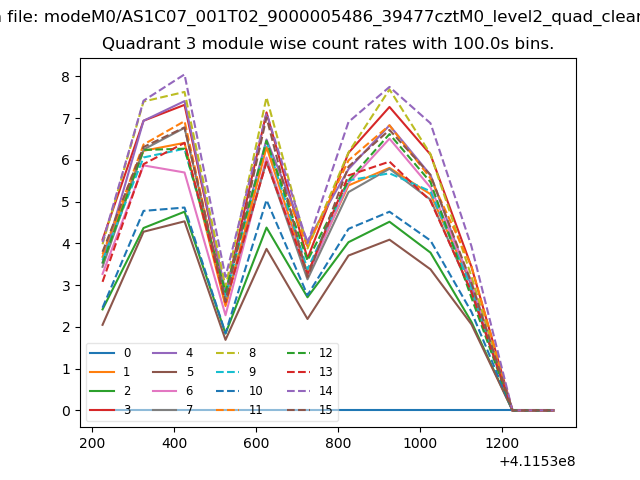
| Module-wise count rates for Quadrant A Data is divided into 100 sec bins |
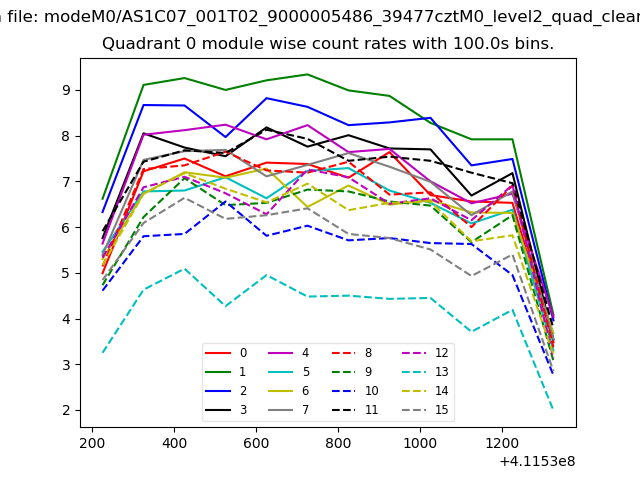 |
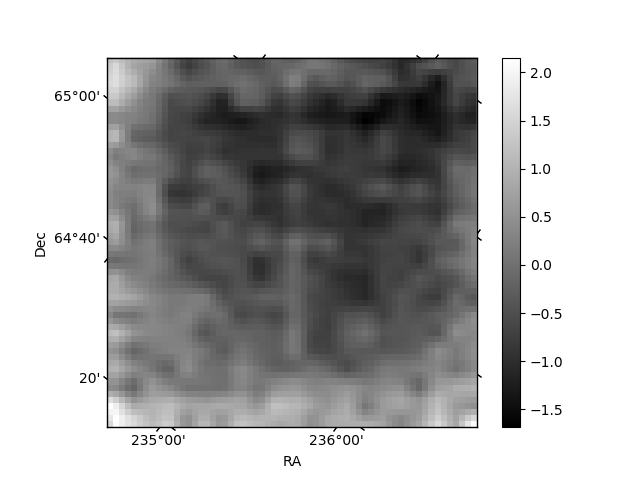 |
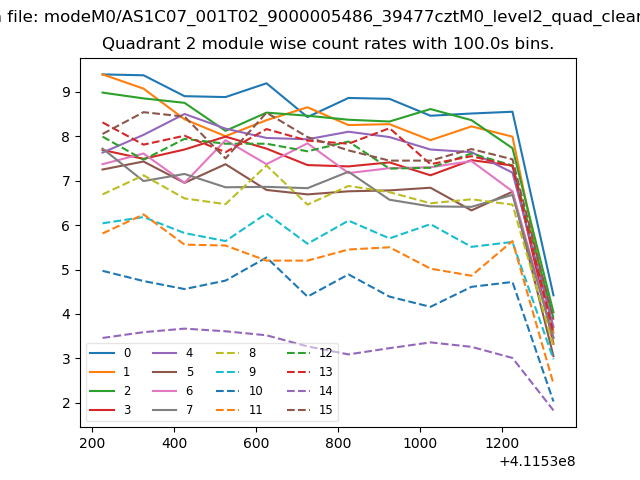
| Module-wise count rates for Quadrant B Data is divided into 100 sec bins |
 |
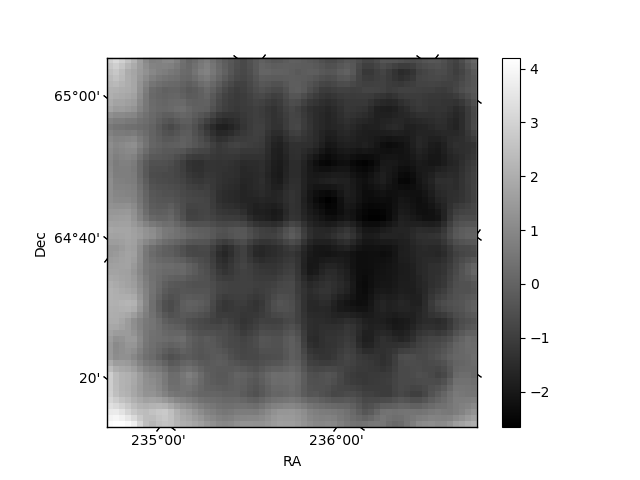 |
| Module-wise count rates for Quadrant C Data is divided into 100 sec bins |
 |
 |
| Module-wise count rates for Quadrant D Data is divided into 100 sec bins |
 |
 |
| Parameter | Plot |
|---|---|
| CZT HV Monitor | 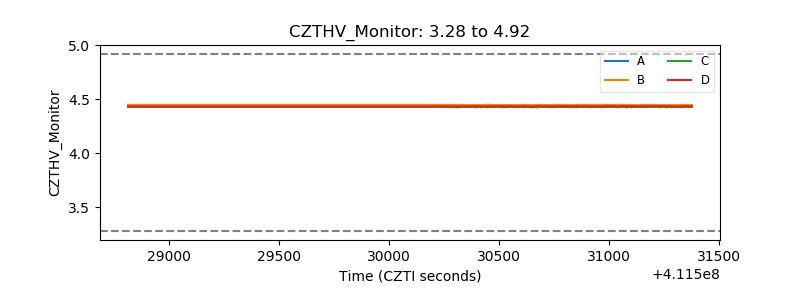 |
| D_VDD | 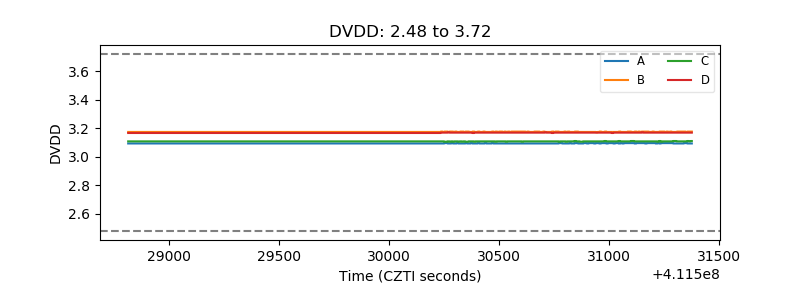 |
| Temperature 1 | 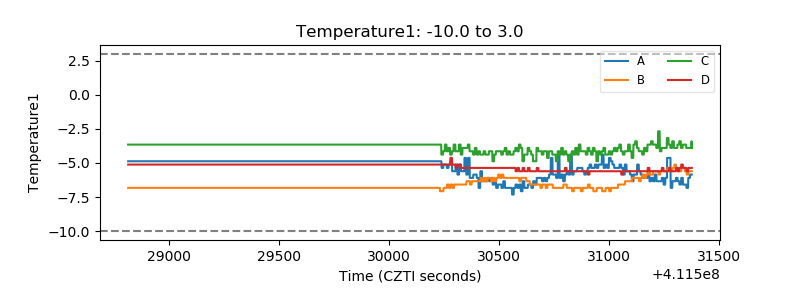 |
| Veto HV Monitor | 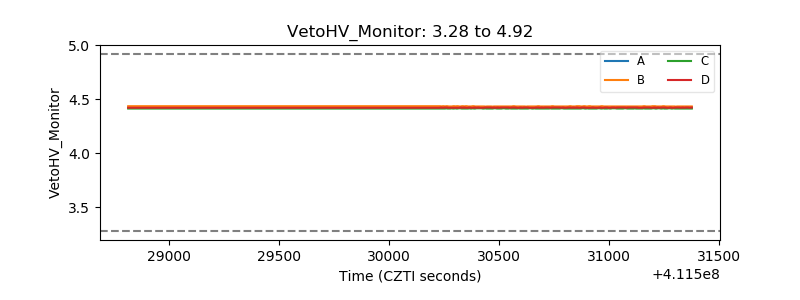 |
| Veto LLD | 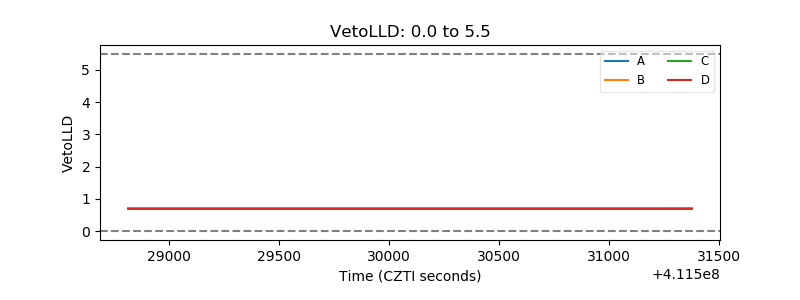 |
| Alpha Counter | 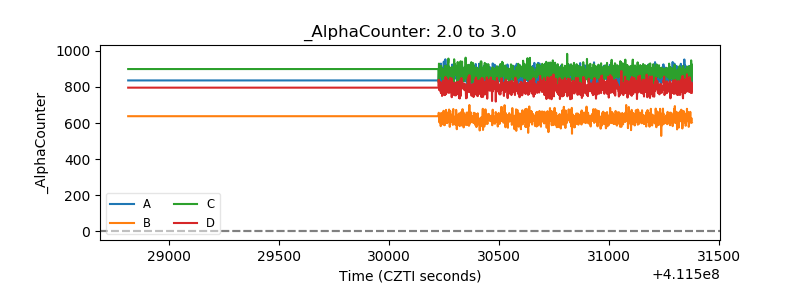 |
| _CPM_Rate | 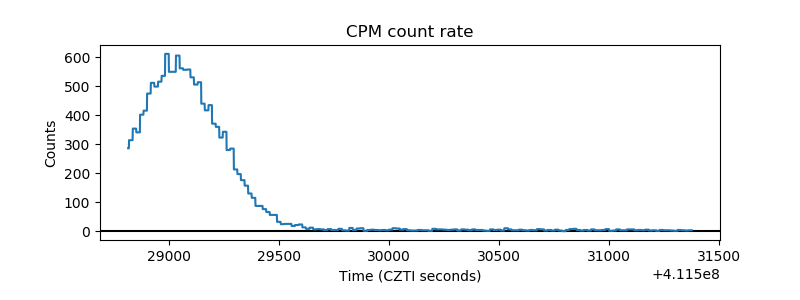 |
| CZT Counter | 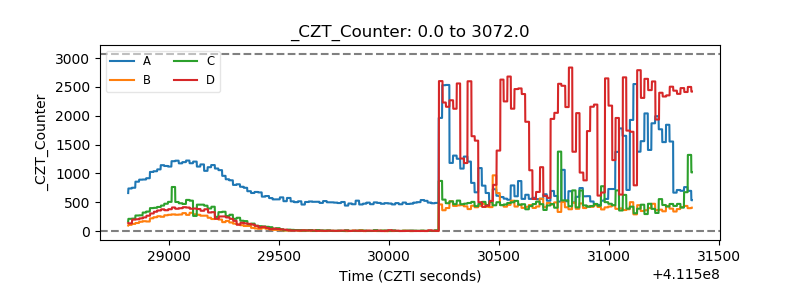 |
| +2.5 Volts monitor | 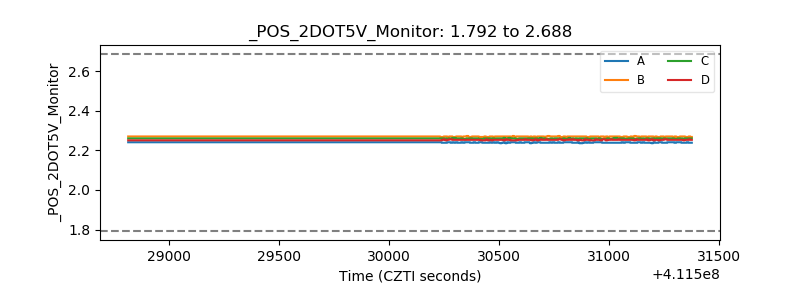 |
| +5 Volts monitor | 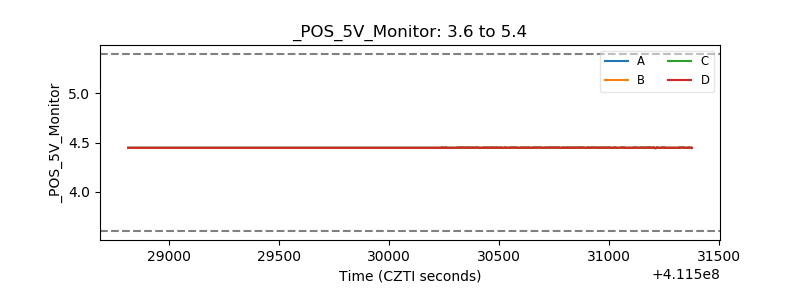 |
| _ROLL_ROT |  |
| _Roll_DEC | 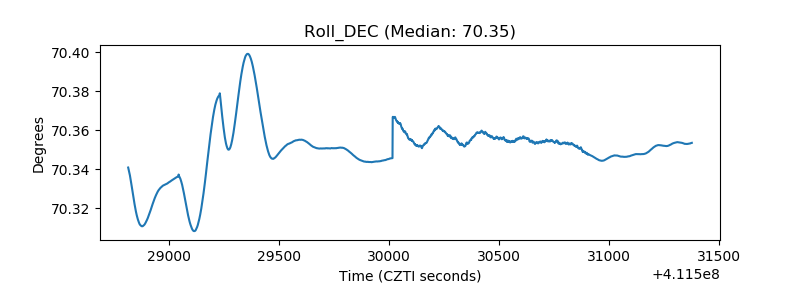 |
| _Roll_RA | 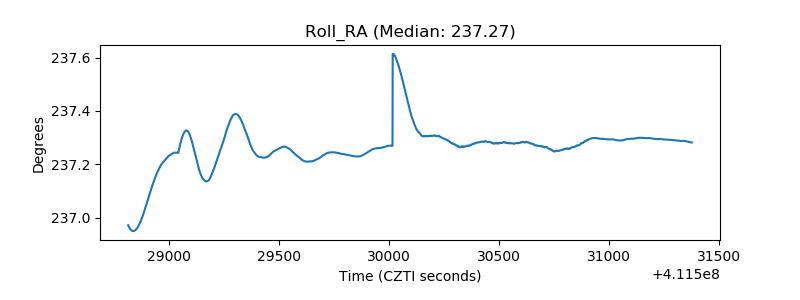 |
| Veto Counter | 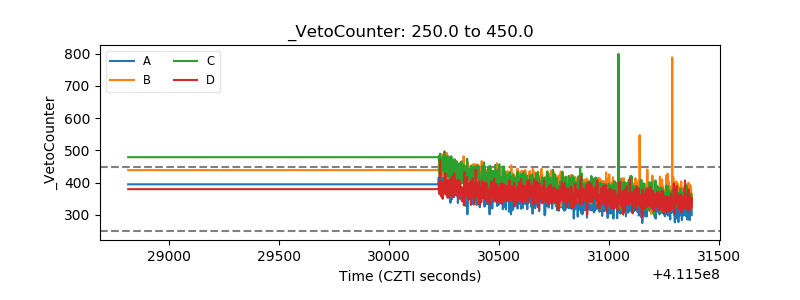 |