| Param | Original file | Final file |
|---|---|---|
| Filename | modeM0/AS1C07_001T02_9000005486_39478cztM0_level2.fits | modeM0/AS1C07_001T02_9000005486_39478cztM0_level2_quad_clean.evt |
| Size (bytes) | 574,562,880 | 76,896,000 |
| Size | 547.9 MB | 73.3 MB |
| Events in quadrant A | 6,856,622 | 470,851 |
| Events in quadrant B | 2,378,318 | 596,472 |
| Events in quadrant C | 3,978,548 | 549,629 |
| Events in quadrant D | 7,651,878 | 346,964 |
| Mode M0 | |||
|---|---|---|---|
| Quadrant | BADHDUFLAG | Total packets | Discarded packets |
| A | 0 | 23967 | 3 |
| B | 0 | 10868 | 2 |
| C | 0 | 15364 | 2 |
| D | 0 | 26406 | 2 |
| Mode M9 | |||
|---|---|---|---|
| Quadrant | BADHDUFLAG | Total packets | Discarded packets |
| A | 0 | 27 | 0 |
| B | 0 | 27 | 0 |
| C | 0 | 27 | 0 |
| D | 0 | 28 | 0 |
| Mode SS | |||
|---|---|---|---|
| Quadrant | BADHDUFLAG | Total packets | Discarded packets |
| A | 0 | 106 | 0 |
| B | 0 | 106 | 0 |
| C | 0 | 106 | 0 |
| D | 0 | 106 | 0 |
| Quadrant | Total seconds | Saturated seconds | Saturation percentage |
|---|---|---|---|
| A | 5198 | 1137 | 21.873798% |
| B | 5198 | 26 | 0.500192% |
| C | 5198 | 218 | 4.193921% |
| D | 5198 | 1945 | 37.418238% |
Noise dominated data is calculated using 1-second bins in cleaned event files. If a bin has >2000 counts, and if more than 50% of those come from <1% of pixels, then it is considered to be noise-dominated and hence unusable.
| Quadrant | # 1 sec bins | Bins with >0 counts | Bins with >2000 counts | High rate bins dominated by noise | Noise dominated (total time) | Noise dominated (detector-on time) | Marked lightcurve |
|---|---|---|---|---|---|---|---|
| A | 7201 | 5199 | 1113 | 1113 | 15.46% | 21.41% | 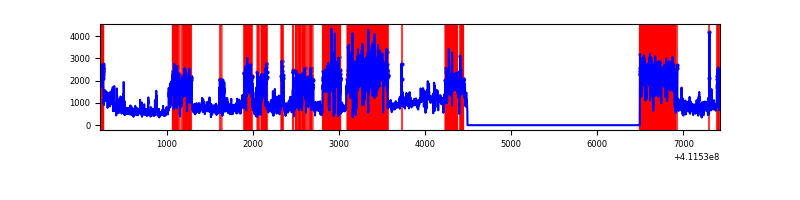 |
| B | 7201 | 5199 | 12 | 12 | 0.17% | 0.23% | 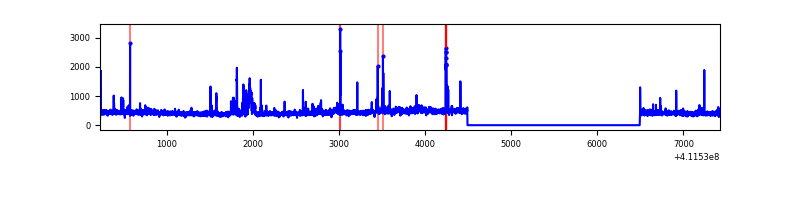 |
| C | 7201 | 5199 | 220 | 220 | 3.06% | 4.23% | 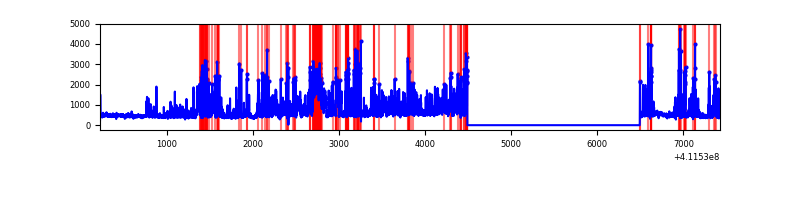 |
| D | 7201 | 5199 | 1712 | 1712 | 23.77% | 32.93% | 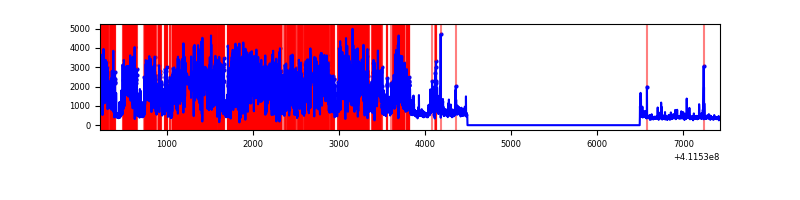 |
Top three noisy pixels from each quadrant. If the there are fewer than three noisy pixels in the level2.evt file, extra rows are filled as -1
| Pixel properties | Quadrant properties | ||||||
|---|---|---|---|---|---|---|---|
| Quadrant | DetID | PixID | Counts | Sigma | Mean | Median | Sigma |
| A | 15 | 222 | 4396440 | 42046.6 | 512 | 503 | 104.5 |
| A | 10 | 83 | 404357 | 3862.81 | 512 | 503 | 104.5 |
| A | 2 | 79 | 36032 | 339.83 | 512 | 503 | 104.5 |
| B | 8 | 3 | 82215 | 778.76 | 547 | 531 | 104.9 |
| B | 5 | 172 | 73777 | 698.31 | 547 | 531 | 104.9 |
| B | 15 | 85 | 26028 | 243.08 | 547 | 531 | 104.9 |
| C | 15 | 208 | 1559002 | 12699.06 | 524 | 528 | 122.7 |
| C | 15 | 214 | 219202 | 1781.84 | 524 | 528 | 122.7 |
| C | 9 | 187 | 143127 | 1161.95 | 524 | 528 | 122.7 |
| D | 2 | 249 | 4737297 | 43430.33 | 440 | 427 | 109.1 |
| D | 12 | 227 | 764793 | 7008.14 | 440 | 427 | 109.1 |
| D | 12 | 0 | 239554 | 2192.45 | 440 | 427 | 109.1 |
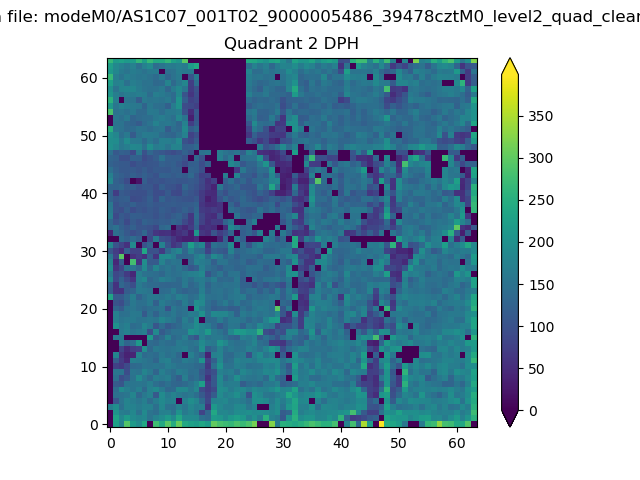
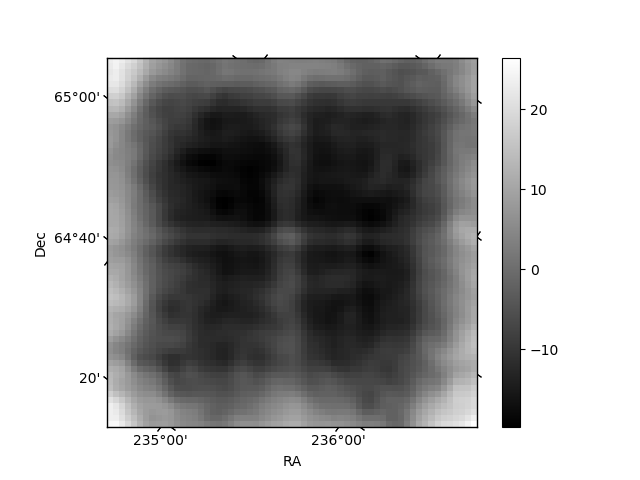
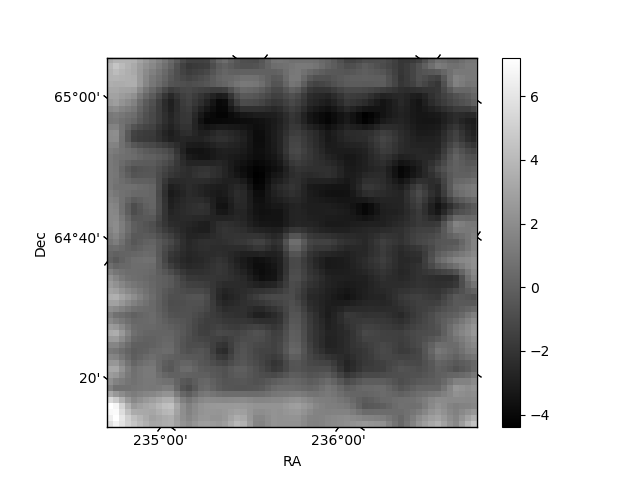
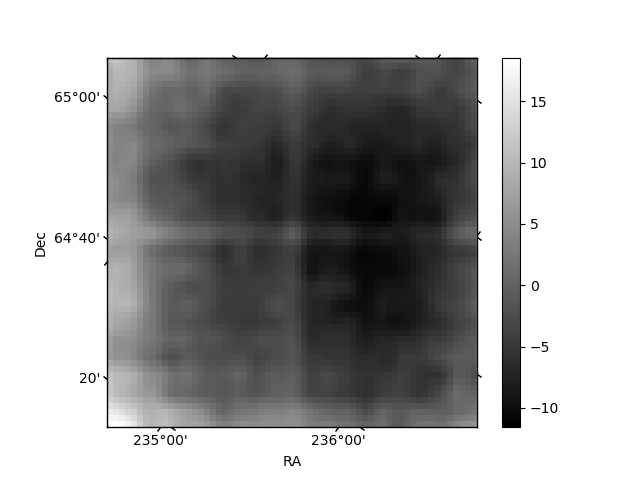
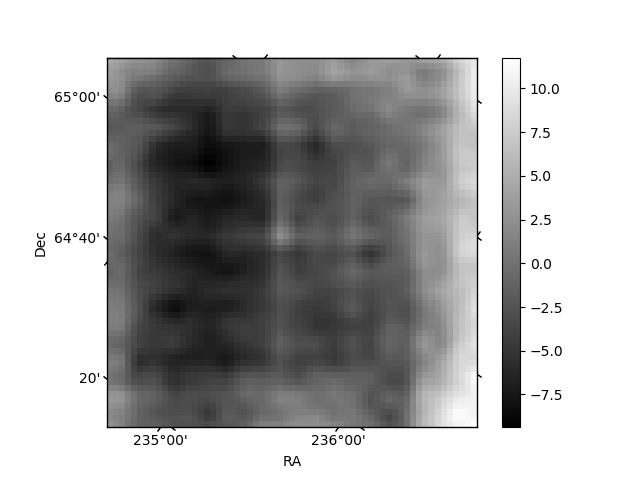
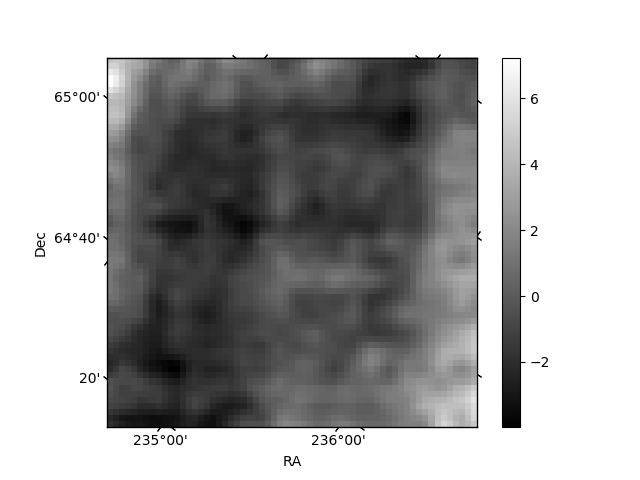
Histogram calculated using DETX and DETY for each event in the final _common_clean file
| Quadrant A | 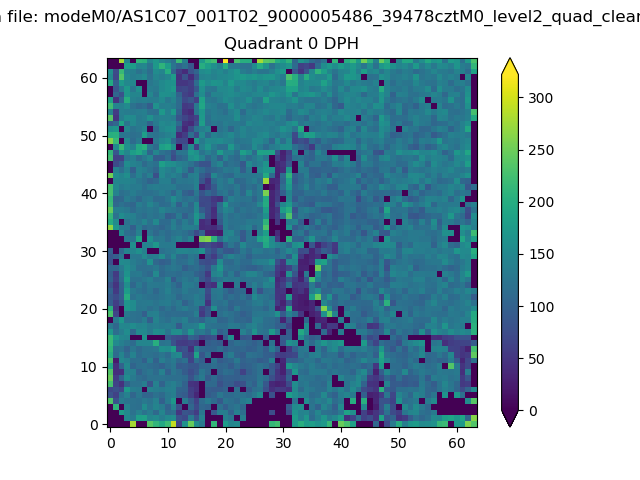 |
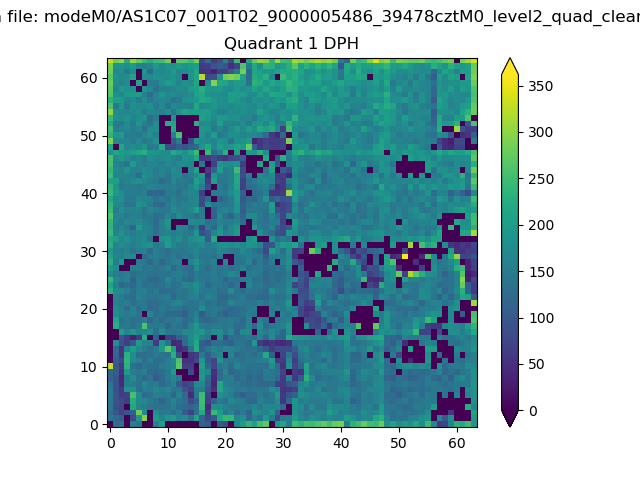 |
Quadrant B |
|---|---|---|---|
| Quadrant D | 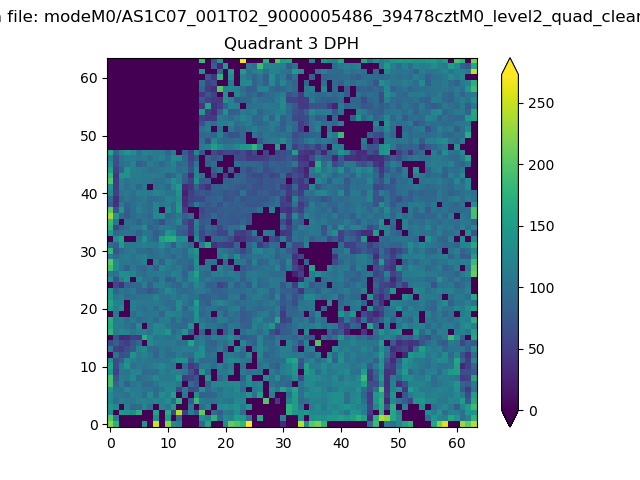 |
 |
Quadrant C |
| Plot type | Count rate plots | Images |
|---|---|---|
| Comparison with Poisson distribution Blue bars denote a histogram of data divided into 1 sec bins. Red curve is a Poisson curve with rate = median count rate of data. |
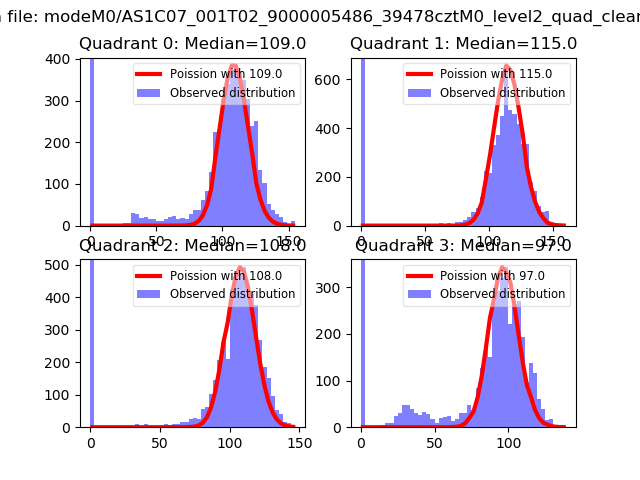 |
 |
| Quadrant-wise count rates Data is divided into 100 sec bins |
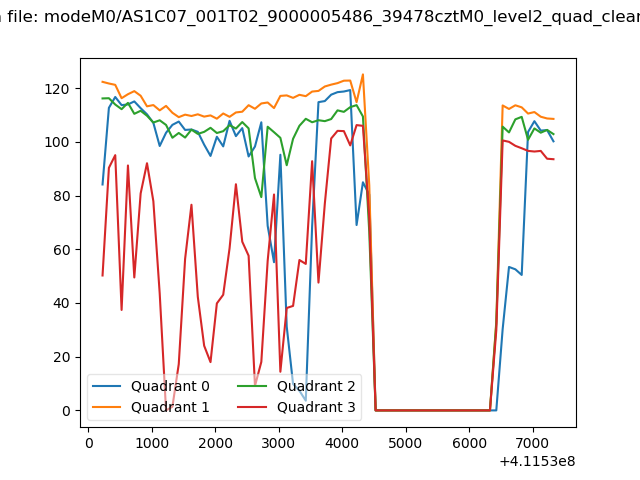 |
|
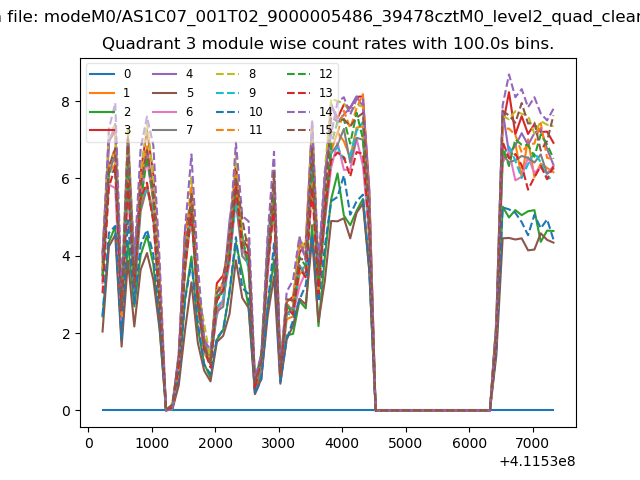
| Module-wise count rates for Quadrant A Data is divided into 100 sec bins |
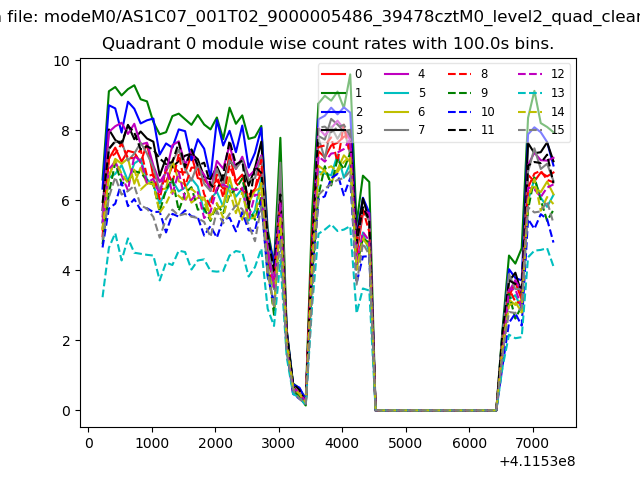 |
 |
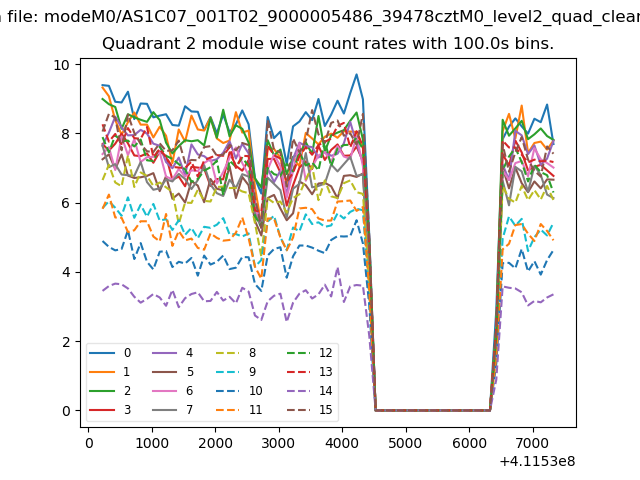
| Module-wise count rates for Quadrant B Data is divided into 100 sec bins |
 |
 |
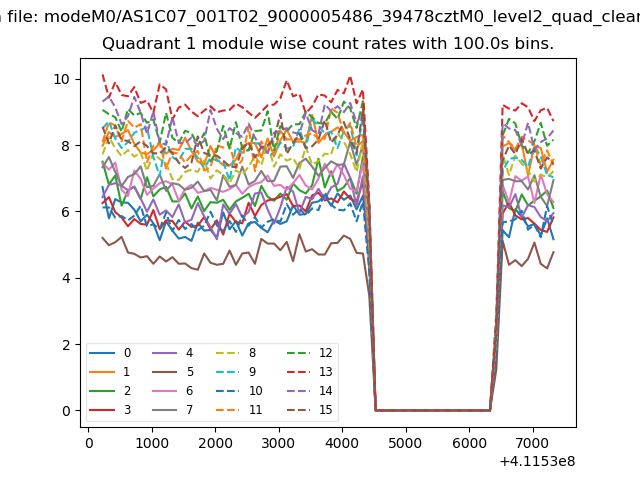
| Module-wise count rates for Quadrant C Data is divided into 100 sec bins |
 |
 |
| Module-wise count rates for Quadrant D Data is divided into 100 sec bins |
 |
 |
| Parameter | Plot |
|---|---|
| CZT HV Monitor | 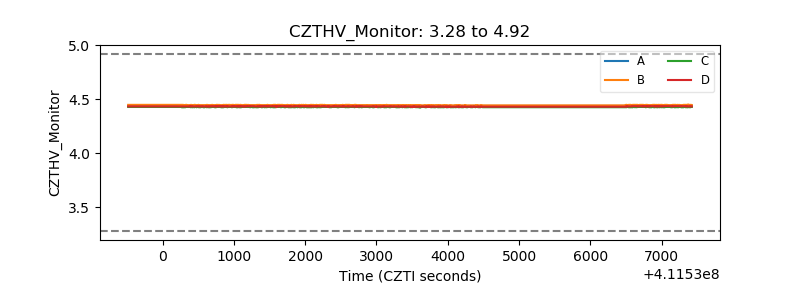 |
| D_VDD | 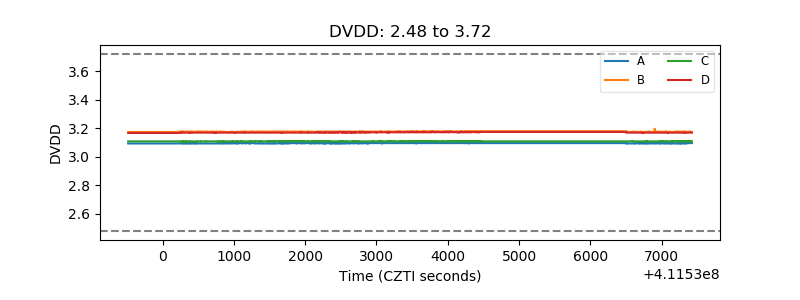 |
| Temperature 1 | 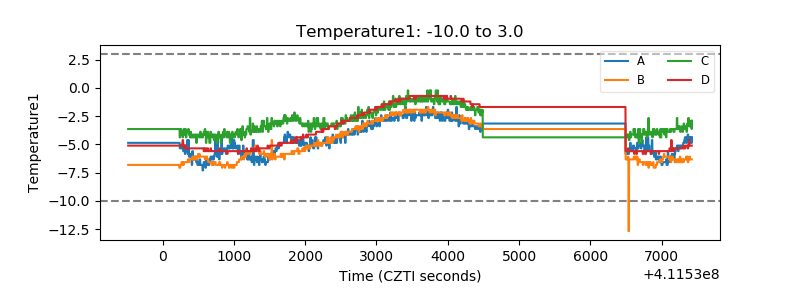 |
| Veto HV Monitor | 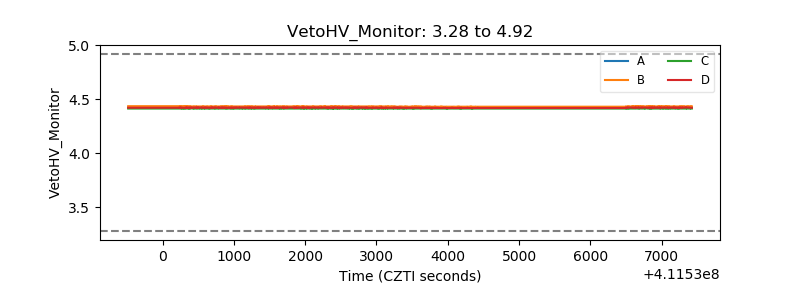 |
| Veto LLD | 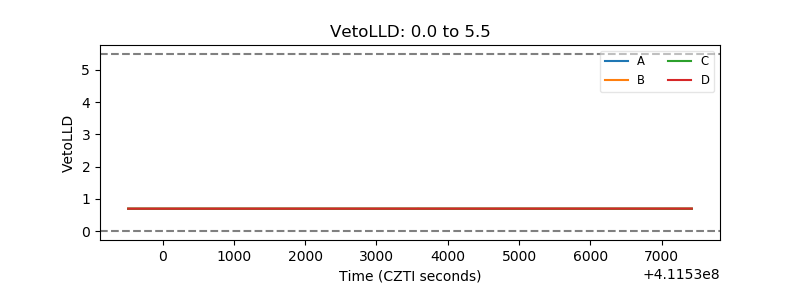 |
| Alpha Counter | 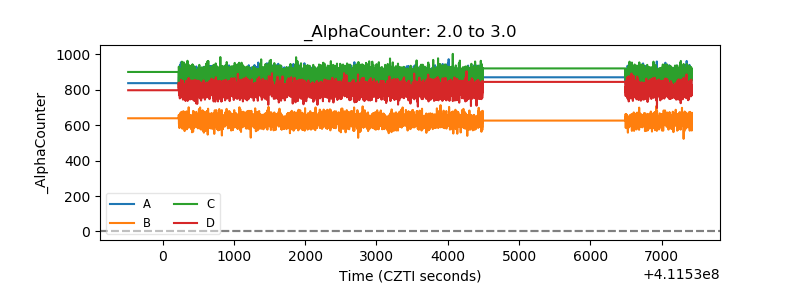 |
| _CPM_Rate | 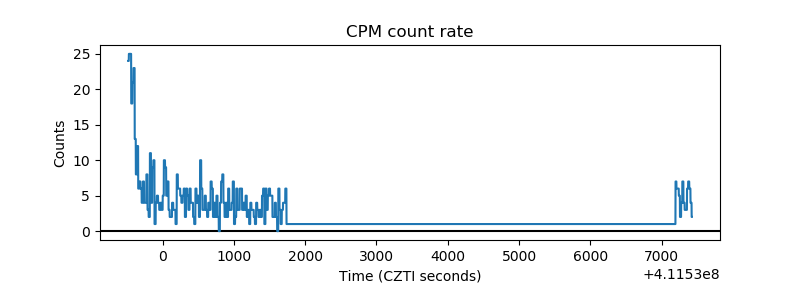 |
| CZT Counter | 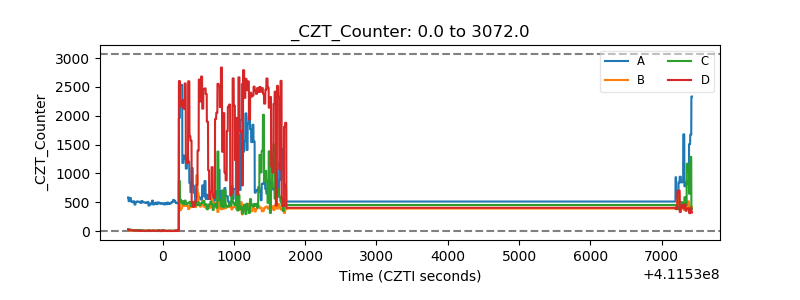 |
| +2.5 Volts monitor | 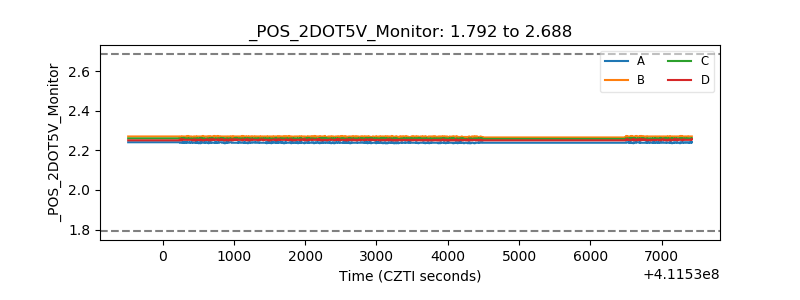 |
| +5 Volts monitor | 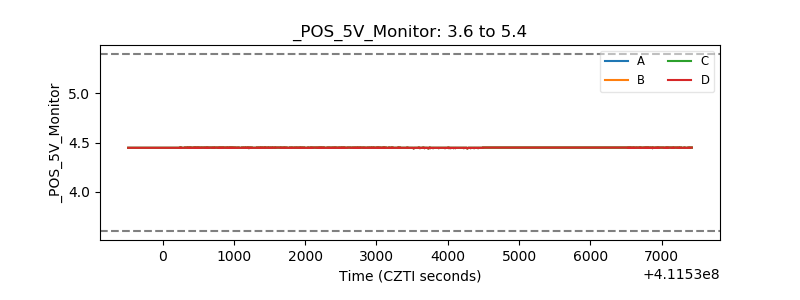 |
| _ROLL_ROT | 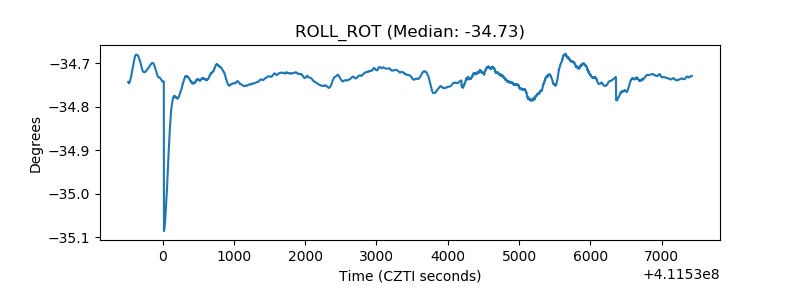 |
| _Roll_DEC | 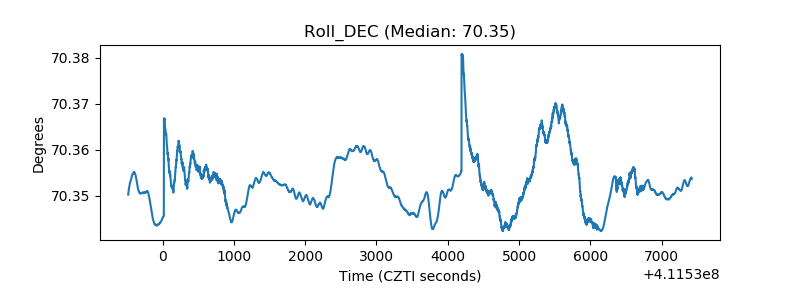 |
| _Roll_RA | 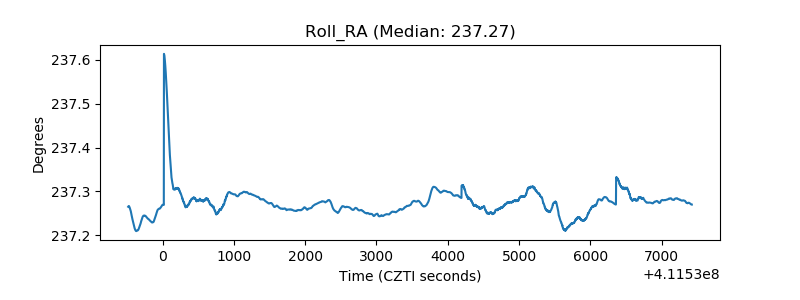 |
| Veto Counter | 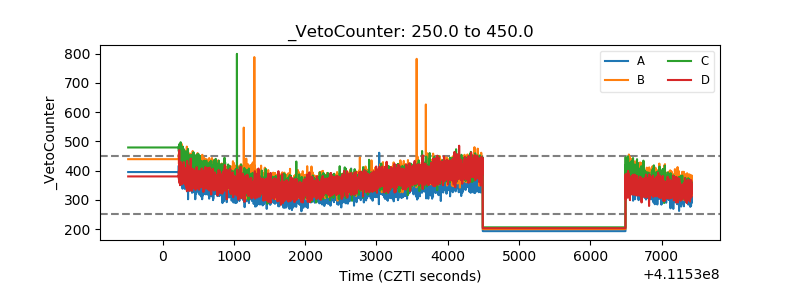 |