| Param | Original file | Final file |
|---|---|---|
| Filename | modeM0/AS1C07_001T02_9000005486_39480cztM0_level2.fits | modeM0/AS1C07_001T02_9000005486_39480cztM0_level2_quad_clean.evt |
| Size (bytes) | 379,402,560 | 89,853,120 |
| Size | 361.8 MB | 85.7 MB |
| Events in quadrant A | 3,893,659 | 597,682 |
| Events in quadrant B | 2,429,465 | 624,545 |
| Events in quadrant C | 3,094,464 | 586,003 |
| Events in quadrant D | 4,191,417 | 520,948 |
| Mode M0 | |||
|---|---|---|---|
| Quadrant | BADHDUFLAG | Total packets | Discarded packets |
| A | 0 | 15183 | 64 |
| B | 0 | 11419 | 31 |
| C | 0 | 12921 | 36 |
| D | 0 | 16532 | 43 |
| Mode M9 | |||
|---|---|---|---|
| Quadrant | BADHDUFLAG | Total packets | Discarded packets |
| A | 0 | 14 | 0 |
| B | 0 | 14 | 0 |
| C | 0 | 14 | 0 |
| D | 0 | 14 | 0 |
| Mode SS | |||
|---|---|---|---|
| Quadrant | BADHDUFLAG | Total packets | Discarded packets |
| A | 0 | 114 | 0 |
| B | 0 | 114 | 0 |
| C | 0 | 114 | 0 |
| D | 0 | 114 | 0 |
| Quadrant | Total seconds | Saturated seconds | Saturation percentage |
|---|---|---|---|
| A | 5592 | 95 | 1.698856% |
| B | 5599 | 13 | 0.232184% |
| C | 5596 | 49 | 0.875625% |
| D | 5594 | 303 | 5.416518% |
Noise dominated data is calculated using 1-second bins in cleaned event files. If a bin has >2000 counts, and if more than 50% of those come from <1% of pixels, then it is considered to be noise-dominated and hence unusable.
| Quadrant | # 1 sec bins | Bins with >0 counts | Bins with >2000 counts | High rate bins dominated by noise | Noise dominated (total time) | Noise dominated (detector-on time) | Marked lightcurve |
|---|---|---|---|---|---|---|---|
| A | 7017 | 5601 | 86 | 86 | 1.23% | 1.54% | 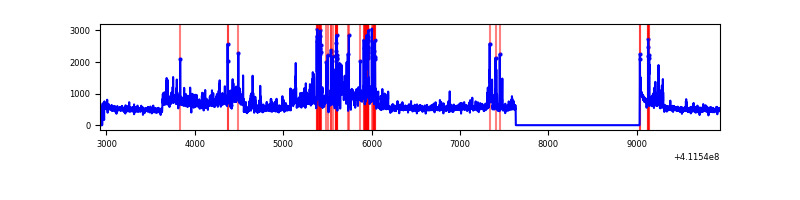 |
| B | 7016 | 5606 | 6 | 6 | 0.09% | 0.11% | 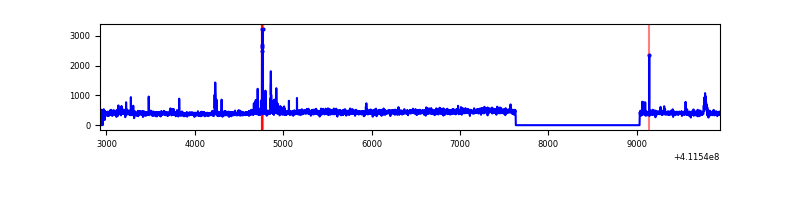 |
| C | 7017 | 5607 | 37 | 37 | 0.53% | 0.66% | 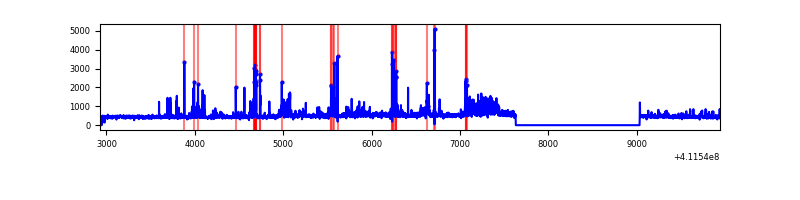 |
| D | 7014 | 5601 | 248 | 248 | 3.54% | 4.43% | 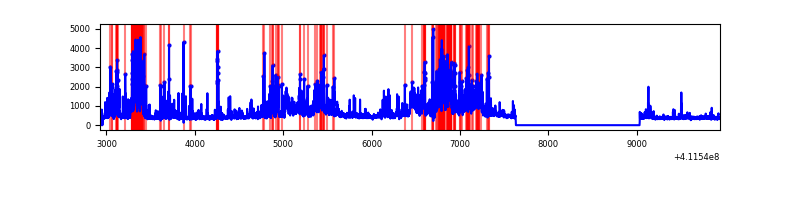 |
Top three noisy pixels from each quadrant. If the there are fewer than three noisy pixels in the level2.evt file, extra rows are filled as -1
| Pixel properties | Quadrant properties | ||||||
|---|---|---|---|---|---|---|---|
| Quadrant | DetID | PixID | Counts | Sigma | Mean | Median | Sigma |
| A | 15 | 222 | 1034723 | 8547.14 | 591 | 577 | 121.0 |
| A | 10 | 83 | 397279 | 3278.71 | 591 | 577 | 121.0 |
| A | 15 | 174 | 111156 | 913.93 | 591 | 577 | 121.0 |
| B | 5 | 172 | 60715 | 525.3 | 592 | 575 | 114.5 |
| B | 8 | 3 | 30154 | 258.36 | 592 | 575 | 114.5 |
| B | 12 | 111 | 14434 | 121.05 | 592 | 575 | 114.5 |
| C | 15 | 208 | 450355 | 3347.94 | 575 | 579 | 134.3 |
| C | 15 | 214 | 232198 | 1724.07 | 575 | 579 | 134.3 |
| C | 10 | 70 | 75427 | 557.14 | 575 | 579 | 134.3 |
| D | 12 | 0 | 1243539 | 8943.23 | 566 | 549 | 139.0 |
| D | 12 | 227 | 372356 | 2675.13 | 566 | 549 | 139.0 |
| D | 2 | 249 | 206463 | 1481.54 | 566 | 549 | 139.0 |
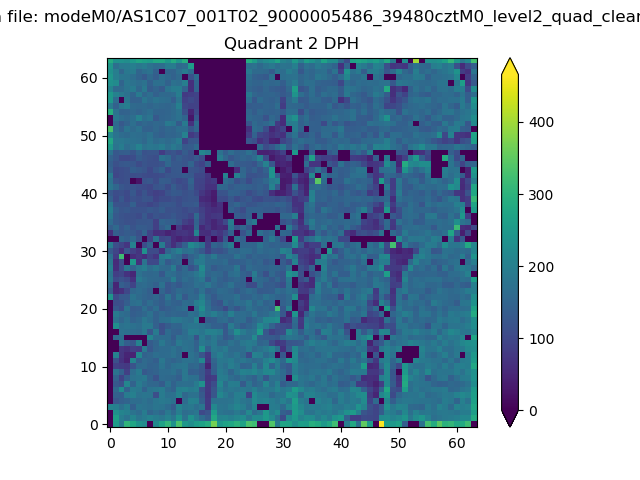
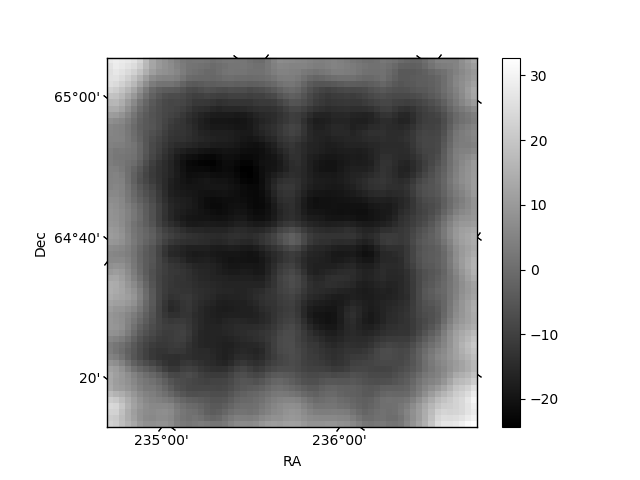
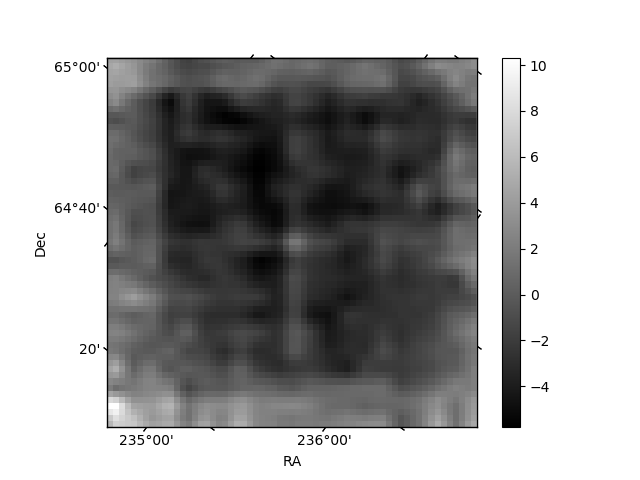
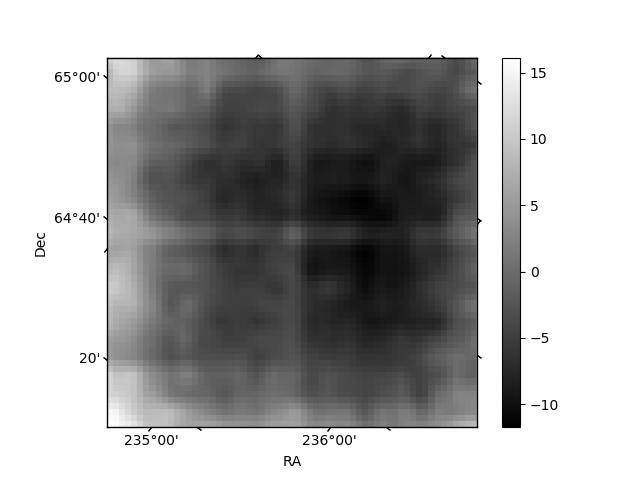
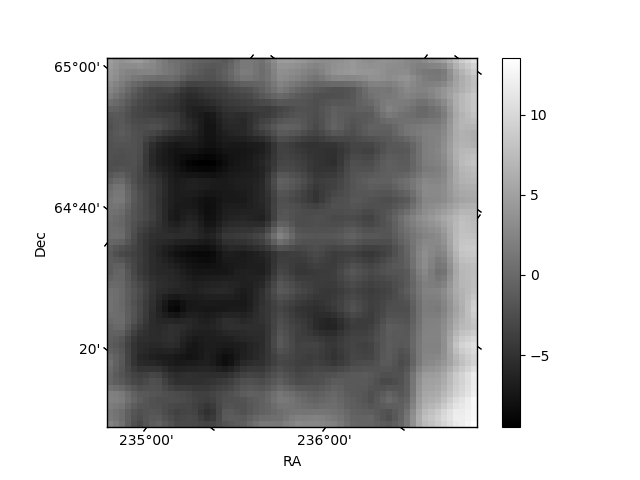
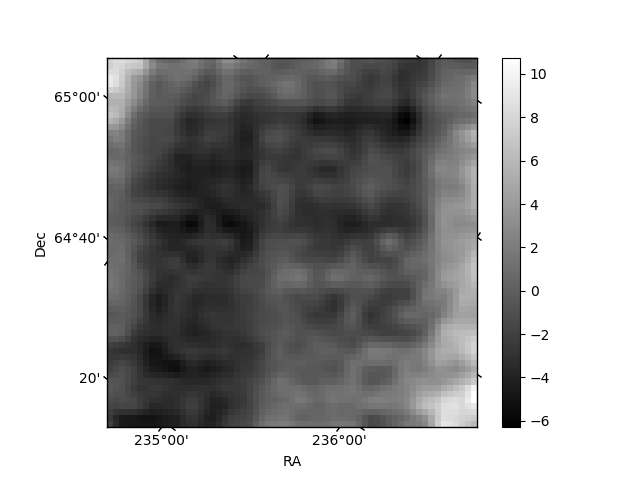
Histogram calculated using DETX and DETY for each event in the final _common_clean file
| Quadrant A | 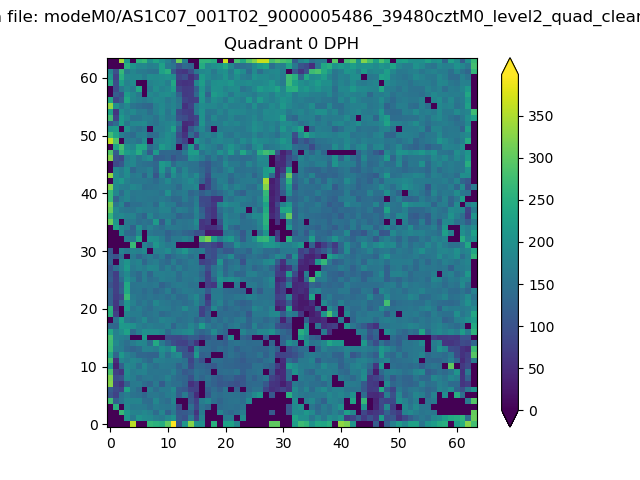 |
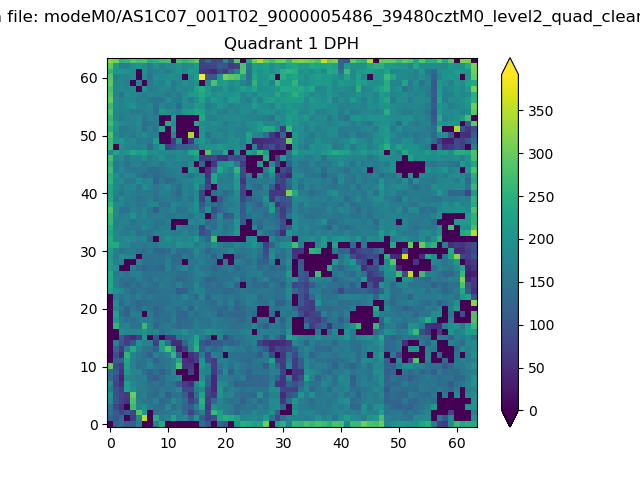 |
Quadrant B |
|---|---|---|---|
| Quadrant D | 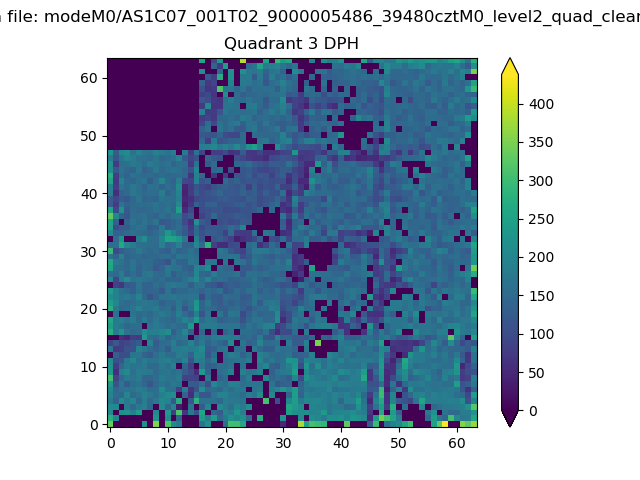 |
 |
Quadrant C |
| Plot type | Count rate plots | Images |
|---|---|---|
| Comparison with Poisson distribution Blue bars denote a histogram of data divided into 1 sec bins. Red curve is a Poisson curve with rate = median count rate of data. |
 |
 |
| Quadrant-wise count rates Data is divided into 100 sec bins |
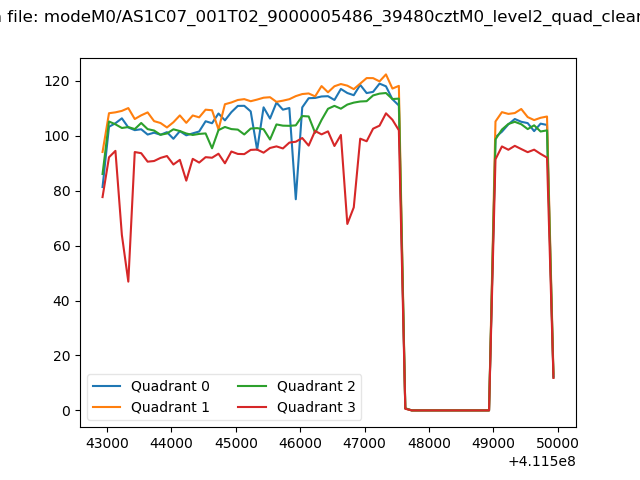 |
|
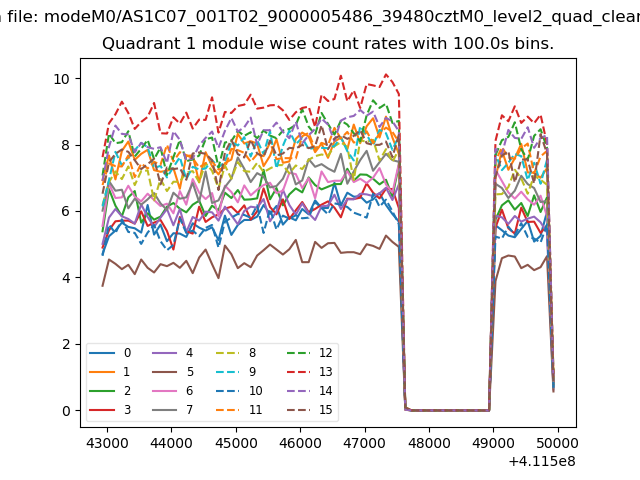
| Module-wise count rates for Quadrant A Data is divided into 100 sec bins |
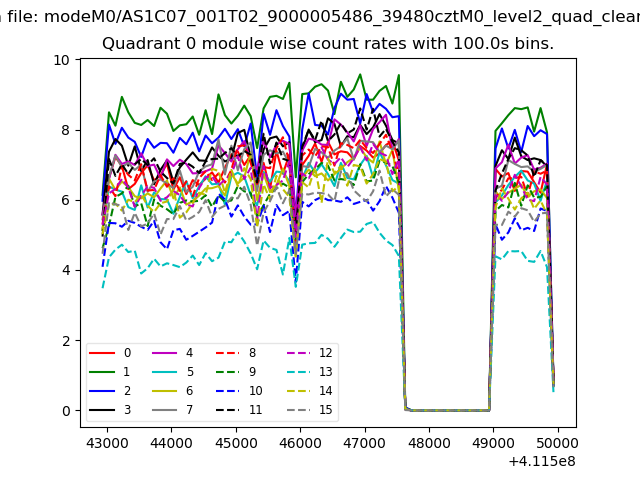 |
 |
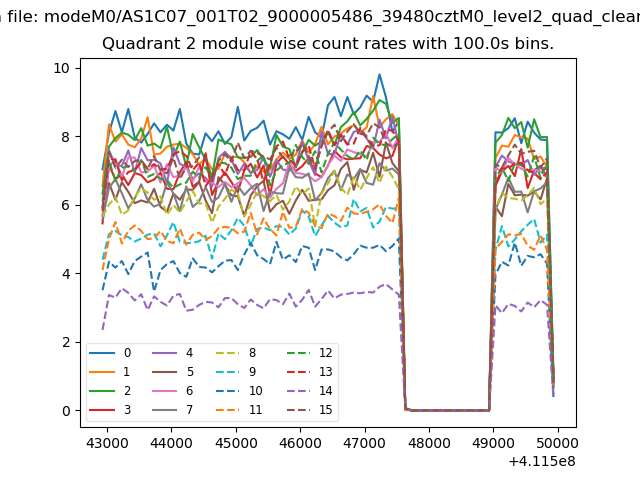
| Module-wise count rates for Quadrant B Data is divided into 100 sec bins |
 |
 |
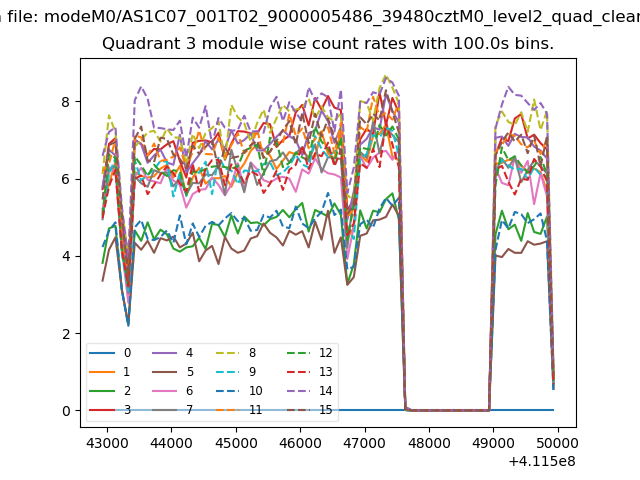
| Module-wise count rates for Quadrant C Data is divided into 100 sec bins |
 |
 |
| Module-wise count rates for Quadrant D Data is divided into 100 sec bins |
 |
 |
| Parameter | Plot |
|---|---|
| CZT HV Monitor |  |
| D_VDD | 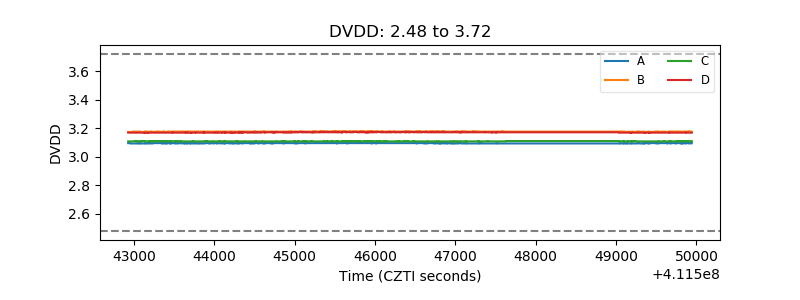 |
| Temperature 1 | 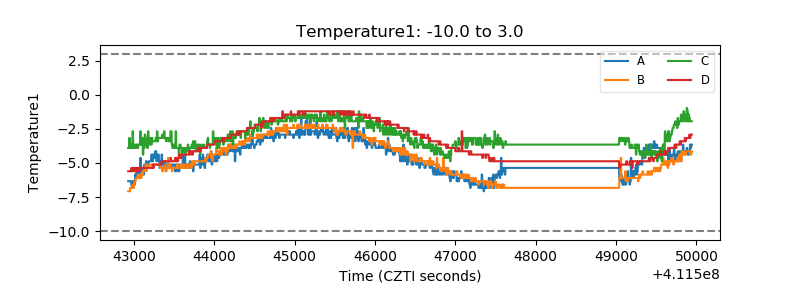 |
| Veto HV Monitor | 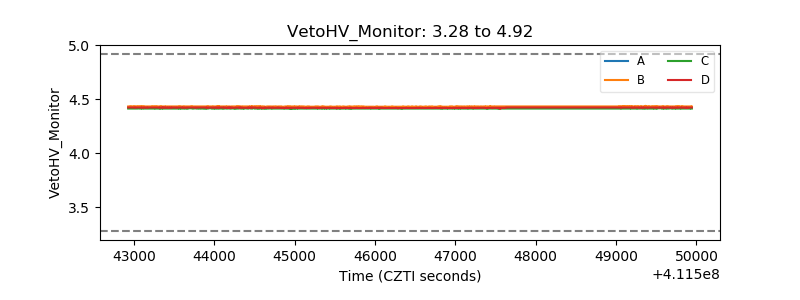 |
| Veto LLD | 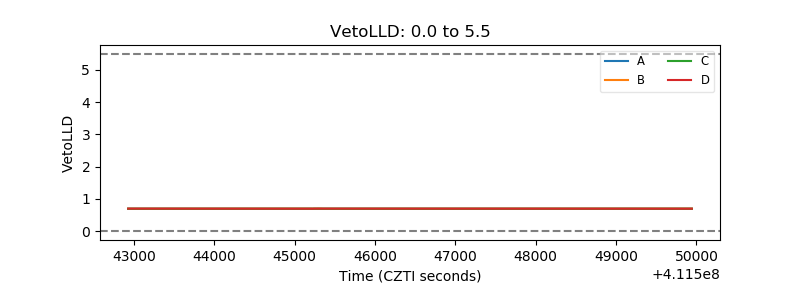 |
| Alpha Counter | 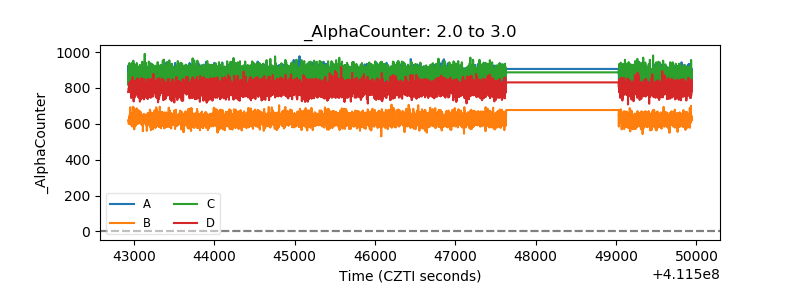 |
| _CPM_Rate | 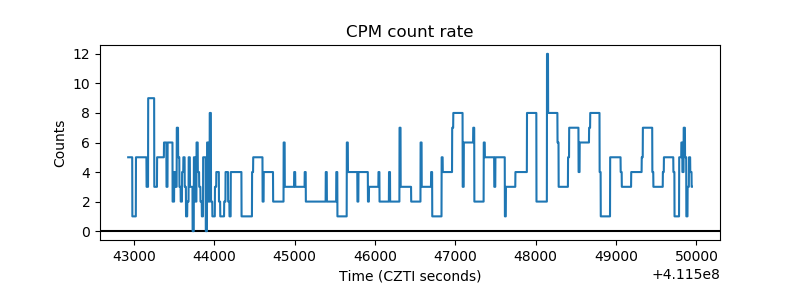 |
| CZT Counter | 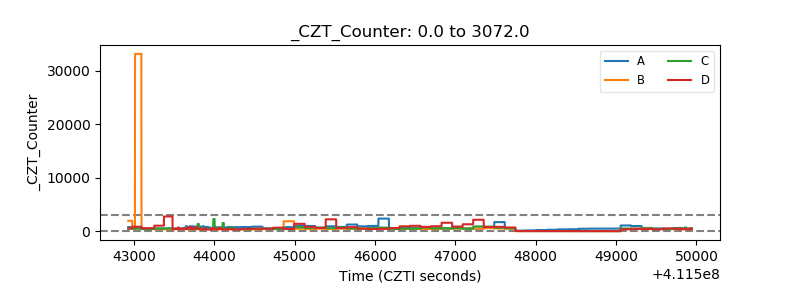 |
| +2.5 Volts monitor | 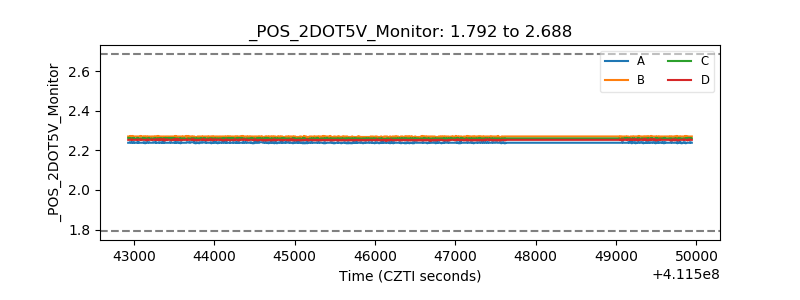 |
| +5 Volts monitor | 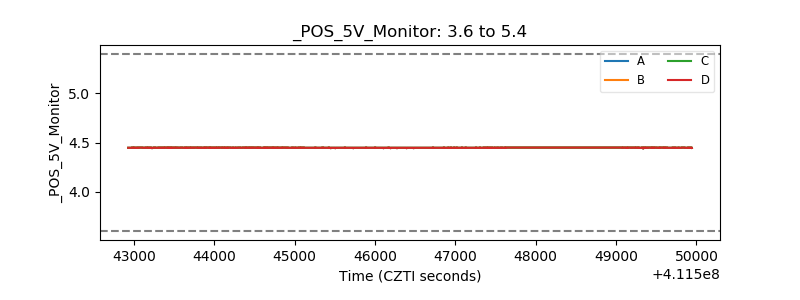 |
| _ROLL_ROT | 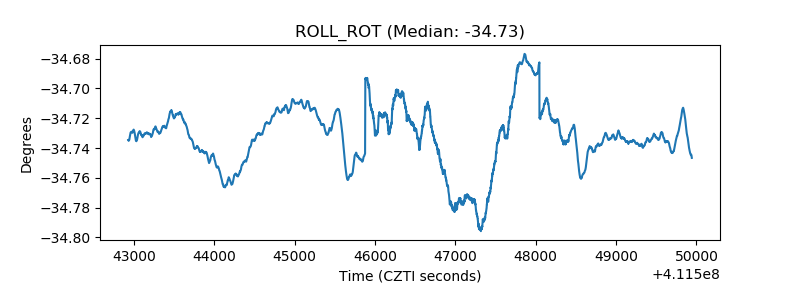 |
| _Roll_DEC |  |
| _Roll_RA | 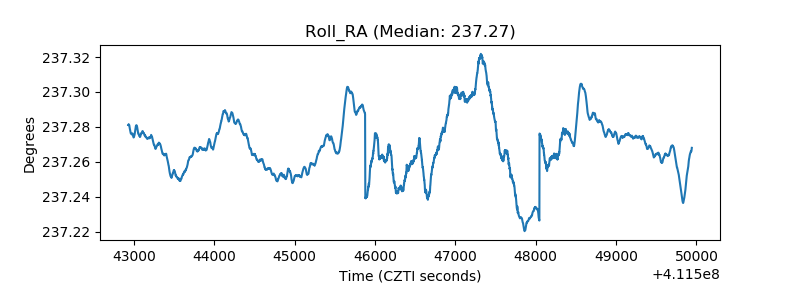 |
| Veto Counter | 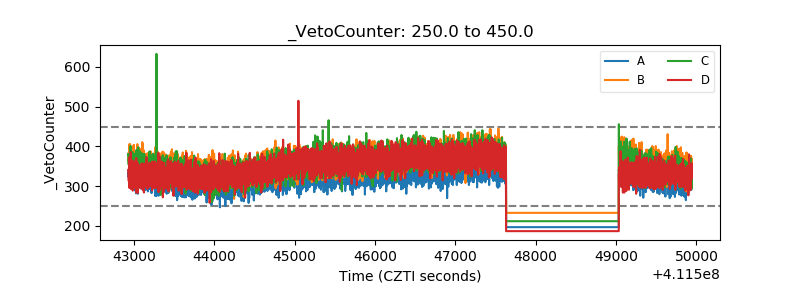 |