| Param | Original file | Final file |
|---|---|---|
| Filename | modeM0/AS1C07_001T02_9000005486_39481cztM0_level2.fits | modeM0/AS1C07_001T02_9000005486_39481cztM0_level2_quad_clean.evt |
| Size (bytes) | 389,422,080 | 95,333,760 |
| Size | 371.4 MB | 90.9 MB |
| Events in quadrant A | 3,808,624 | 636,651 |
| Events in quadrant B | 2,853,124 | 656,512 |
| Events in quadrant C | 3,544,702 | 612,644 |
| Events in quadrant D | 3,747,456 | 566,458 |
| Mode M0 | |||
|---|---|---|---|
| Quadrant | BADHDUFLAG | Total packets | Discarded packets |
| A | 0 | 15014 | 54 |
| B | 0 | 12762 | 9 |
| C | 0 | 14494 | 10 |
| D | 0 | 15384 | 4 |
| Mode M9 | |||
|---|---|---|---|
| Quadrant | BADHDUFLAG | Total packets | Discarded packets |
| A | 0 | 15 | 0 |
| B | 0 | 15 | 0 |
| C | 0 | 16 | 1 |
| D | 0 | 15 | 0 |
| Mode SS | |||
|---|---|---|---|
| Quadrant | BADHDUFLAG | Total packets | Discarded packets |
| A | 0 | 120 | 0 |
| B | 0 | 120 | 0 |
| C | 0 | 120 | 0 |
| D | 0 | 120 | 0 |
| Quadrant | Total seconds | Saturated seconds | Saturation percentage |
|---|---|---|---|
| A | 5927 | 35 | 0.590518% |
| B | 5933 | 40 | 0.674195% |
| C | 5933 | 94 | 1.584359% |
| D | 5936 | 125 | 2.105795% |
Noise dominated data is calculated using 1-second bins in cleaned event files. If a bin has >2000 counts, and if more than 50% of those come from <1% of pixels, then it is considered to be noise-dominated and hence unusable.
| Quadrant | # 1 sec bins | Bins with >0 counts | Bins with >2000 counts | High rate bins dominated by noise | Noise dominated (total time) | Noise dominated (detector-on time) | Marked lightcurve |
|---|---|---|---|---|---|---|---|
| A | 7250 | 5932 | 21 | 21 | 0.29% | 0.35% | 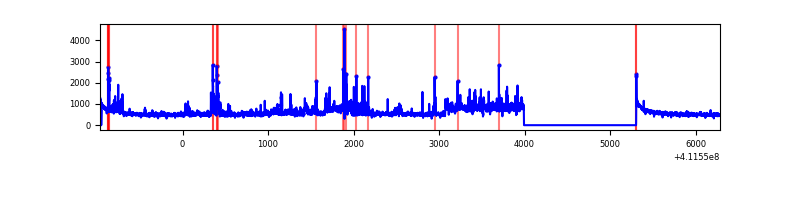 |
| B | 7249 | 5936 | 21 | 21 | 0.29% | 0.35% | 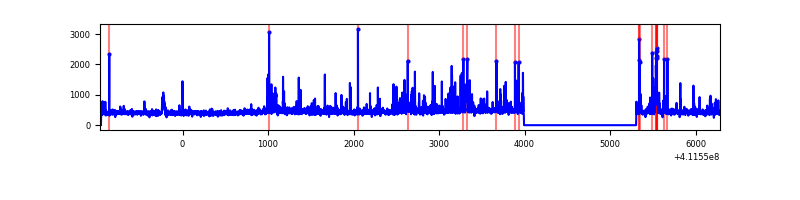 |
| C | 7250 | 5938 | 75 | 75 | 1.03% | 1.26% | 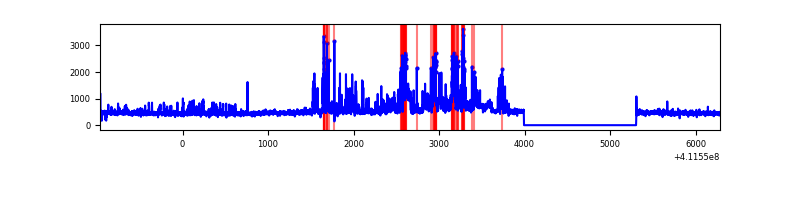 |
| D | 7250 | 5938 | 115 | 115 | 1.59% | 1.94% | 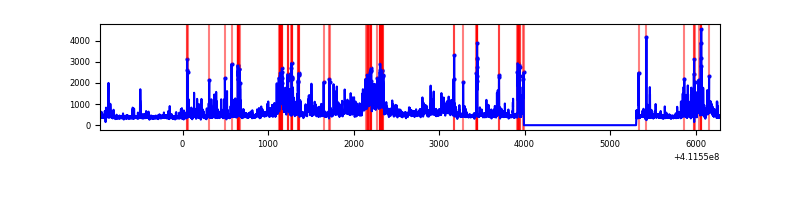 |
Top three noisy pixels from each quadrant. If the there are fewer than three noisy pixels in the level2.evt file, extra rows are filled as -1
| Pixel properties | Quadrant properties | ||||||
|---|---|---|---|---|---|---|---|
| Quadrant | DetID | PixID | Counts | Sigma | Mean | Median | Sigma |
| A | 15 | 222 | 565990 | 4342.29 | 635 | 621 | 130.2 |
| A | 10 | 83 | 476035 | 3651.4 | 635 | 621 | 130.2 |
| A | 9 | 143 | 141604 | 1082.81 | 635 | 621 | 130.2 |
| B | 5 | 255 | 156495 | 1271.27 | 632 | 614 | 122.6 |
| B | 5 | 172 | 150477 | 1222.19 | 632 | 614 | 122.6 |
| B | 8 | 3 | 30959 | 247.48 | 632 | 614 | 122.6 |
| C | 15 | 208 | 547964 | 3794.19 | 614 | 617 | 144.3 |
| C | 15 | 214 | 250163 | 1729.84 | 614 | 617 | 144.3 |
| C | 9 | 187 | 208029 | 1437.77 | 614 | 617 | 144.3 |
| D | 12 | 0 | 848402 | 5603.37 | 615 | 597 | 151.3 |
| D | 13 | 249 | 258574 | 1705.04 | 615 | 597 | 151.3 |
| D | 12 | 227 | 125088 | 822.79 | 615 | 597 | 151.3 |
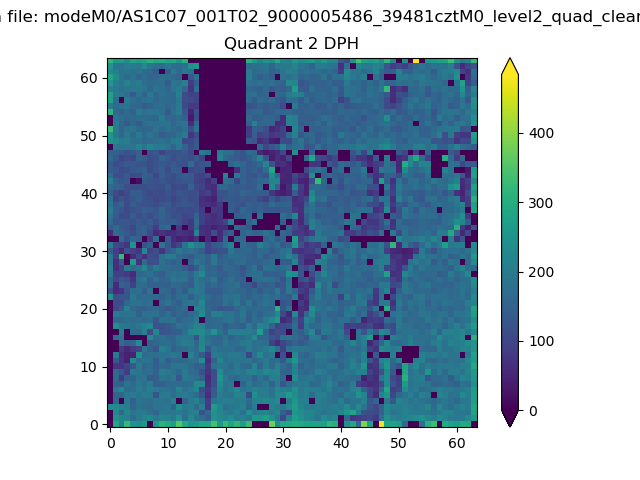
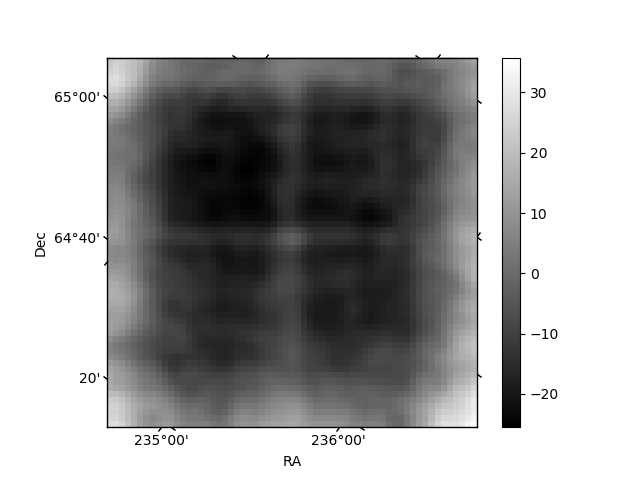
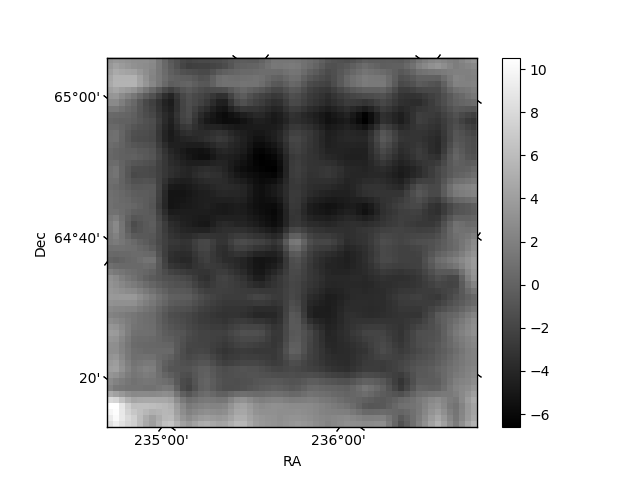
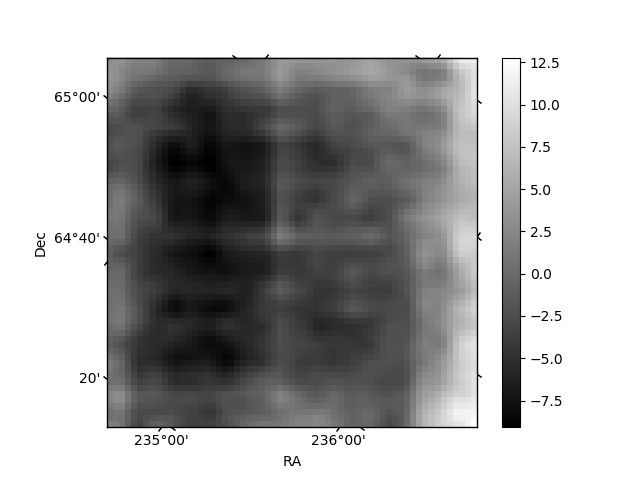
Histogram calculated using DETX and DETY for each event in the final _common_clean file
| Quadrant A | 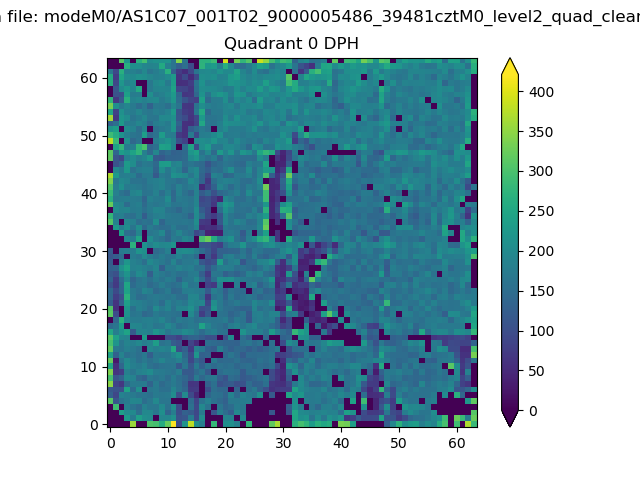 |
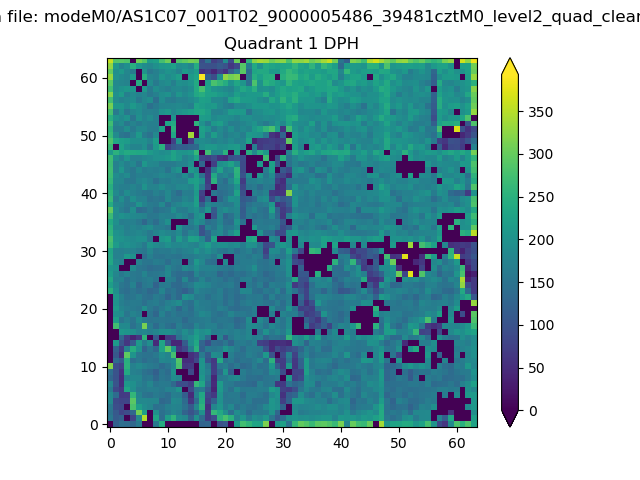 |
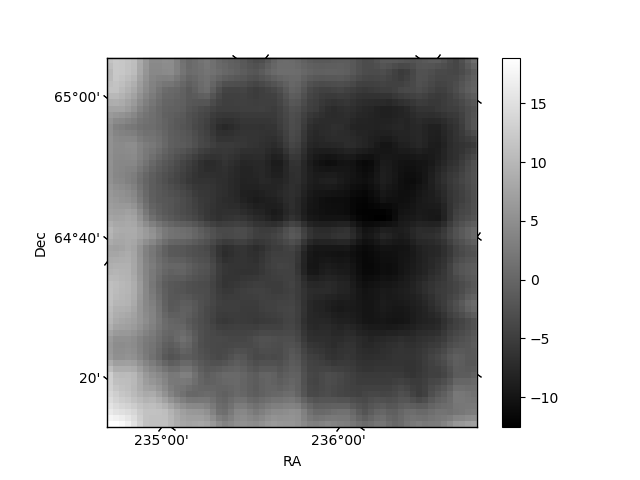
Quadrant B |
|---|---|---|---|
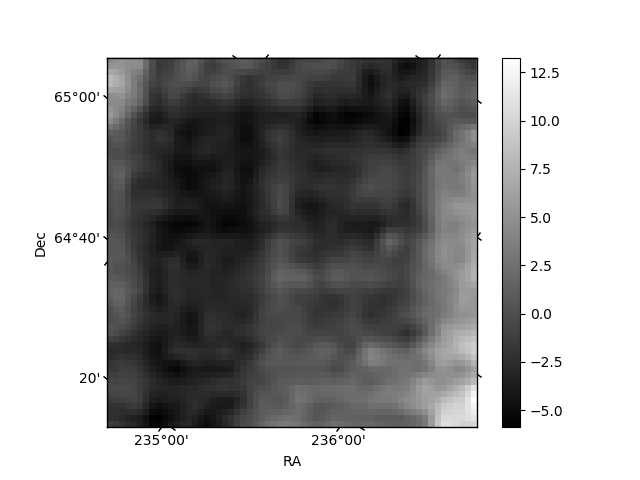
| Quadrant D | 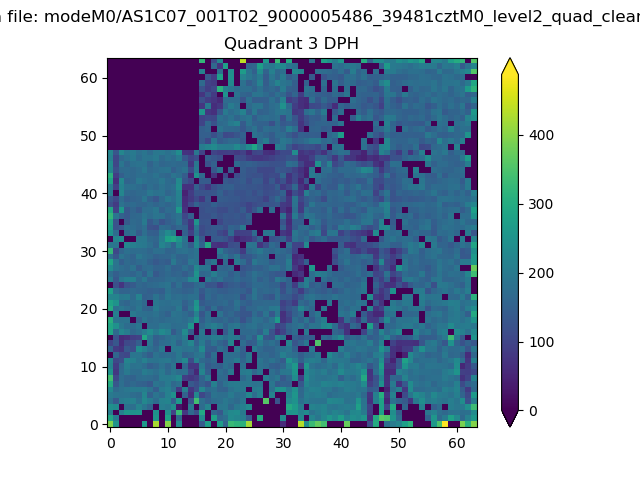 |
 |
Quadrant C |
| Plot type | Count rate plots | Images |
|---|---|---|
| Comparison with Poisson distribution Blue bars denote a histogram of data divided into 1 sec bins. Red curve is a Poisson curve with rate = median count rate of data. |
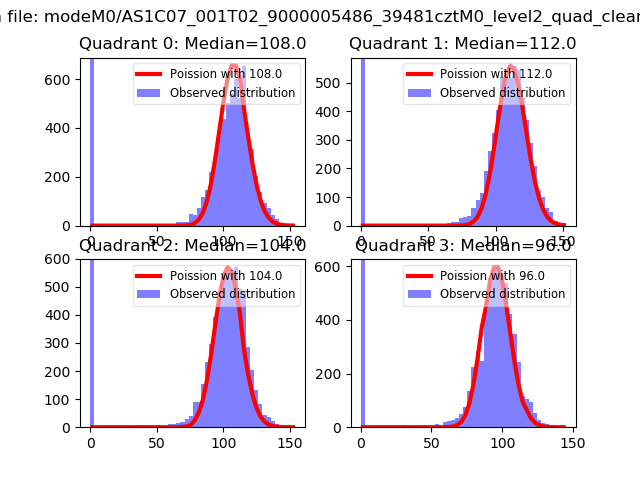 |
 |
| Quadrant-wise count rates Data is divided into 100 sec bins |
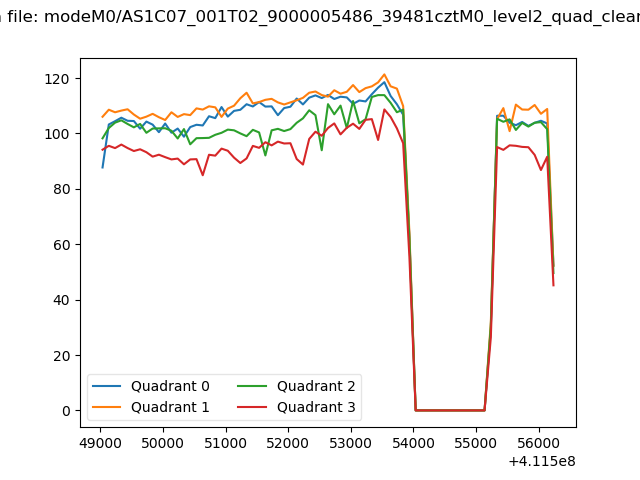 |
|
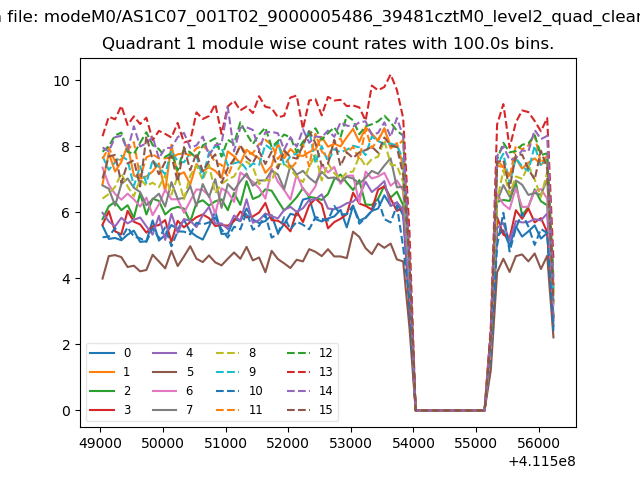
| Module-wise count rates for Quadrant A Data is divided into 100 sec bins |
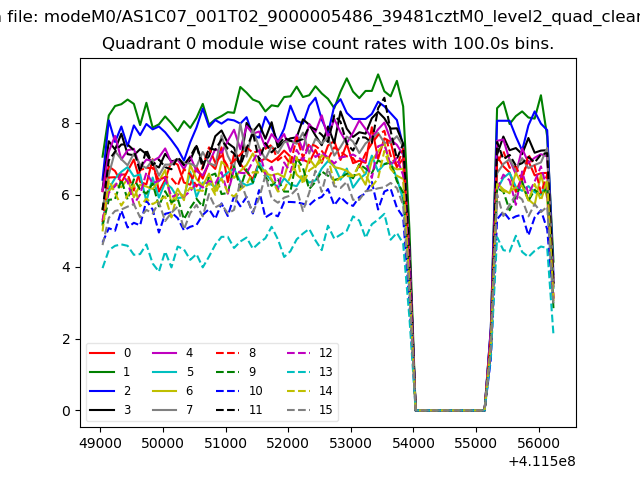 |
 |
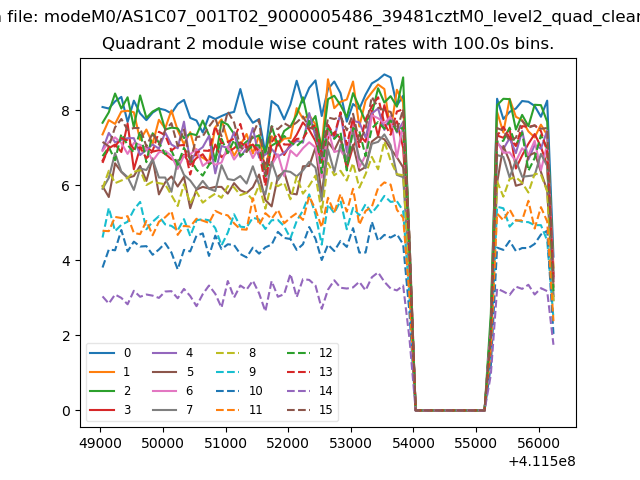
| Module-wise count rates for Quadrant B Data is divided into 100 sec bins |
 |
 |
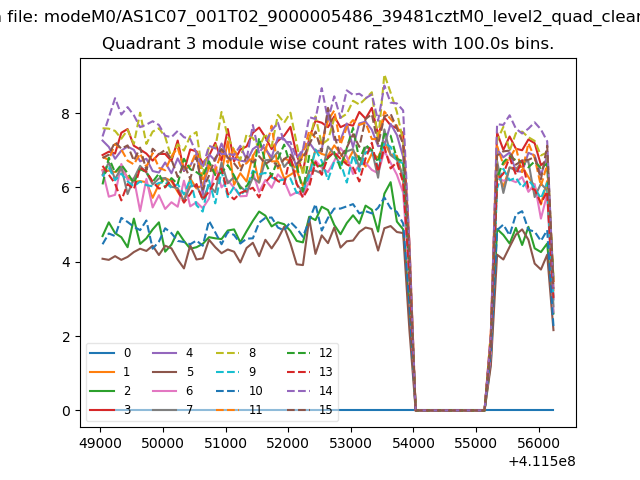
| Module-wise count rates for Quadrant C Data is divided into 100 sec bins |
 |
 |
| Module-wise count rates for Quadrant D Data is divided into 100 sec bins |
 |
 |
| Parameter | Plot |
|---|---|
| CZT HV Monitor |  |
| D_VDD | 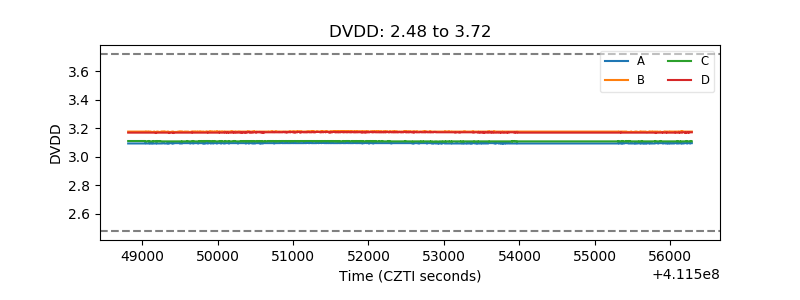 |
| Temperature 1 | 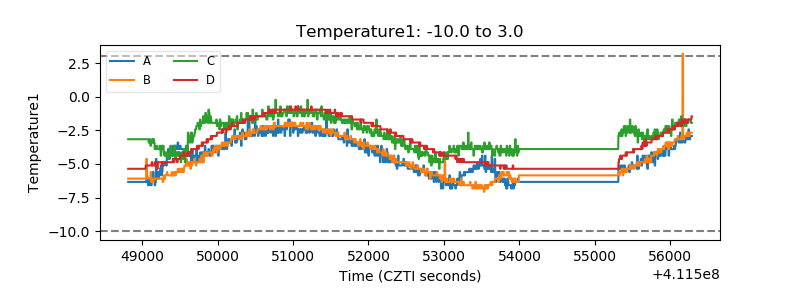 |
| Veto HV Monitor | 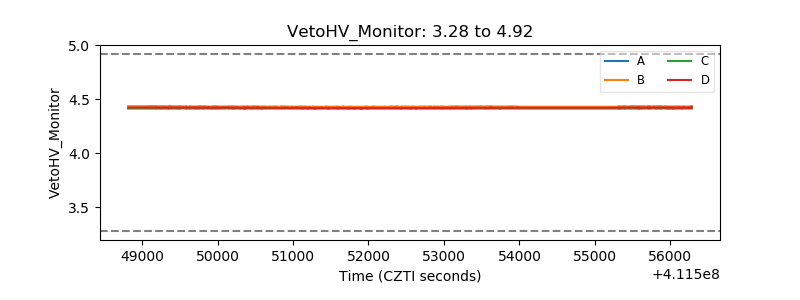 |
| Veto LLD | 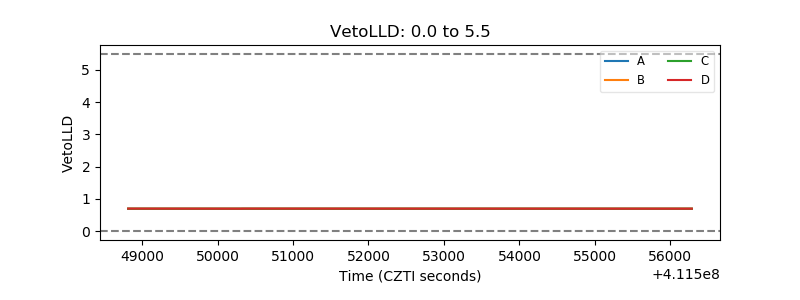 |
| Alpha Counter | 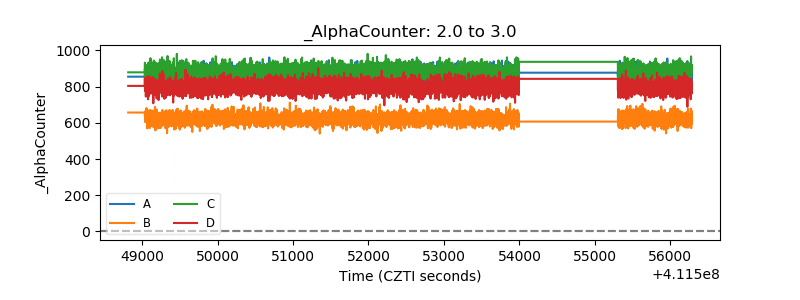 |
| _CPM_Rate | 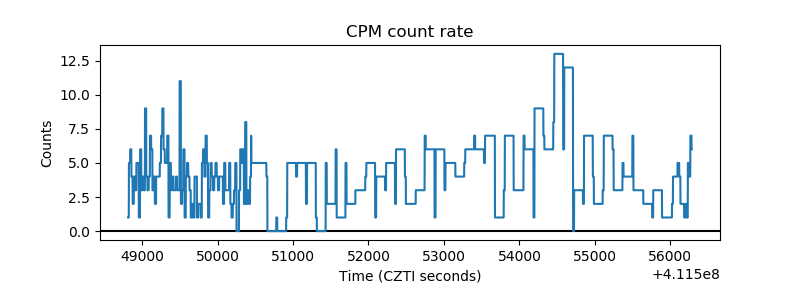 |
| CZT Counter | 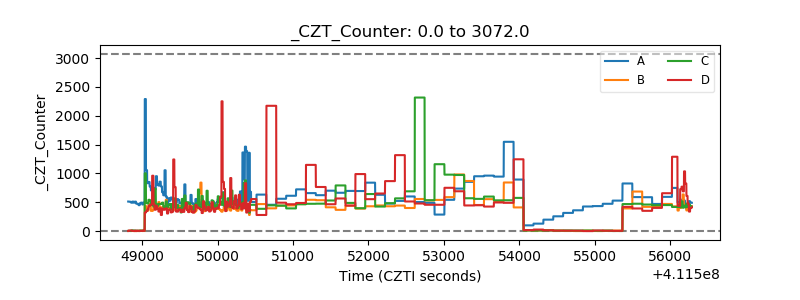 |
| +2.5 Volts monitor | 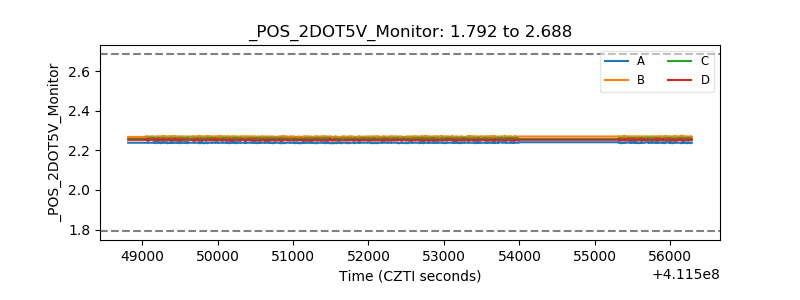 |
| +5 Volts monitor | 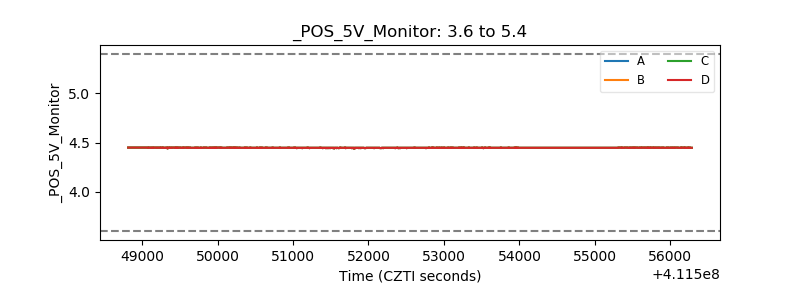 |
| _ROLL_ROT | 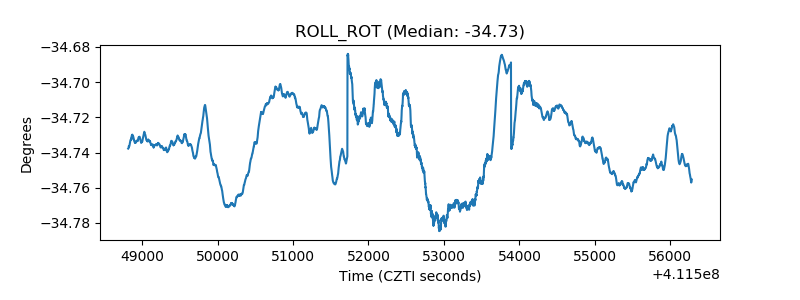 |
| _Roll_DEC | 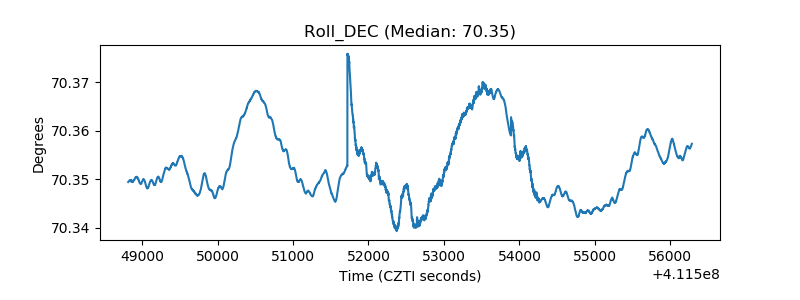 |
| _Roll_RA | 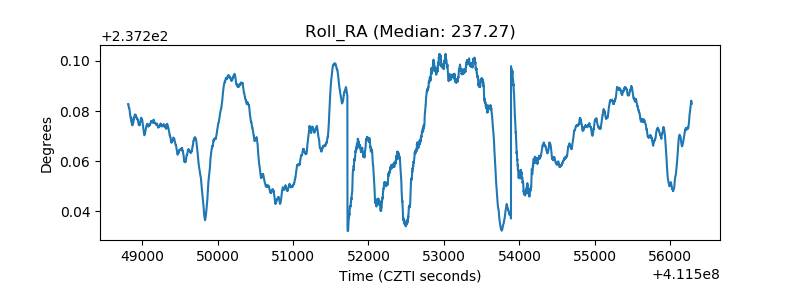 |
| Veto Counter | 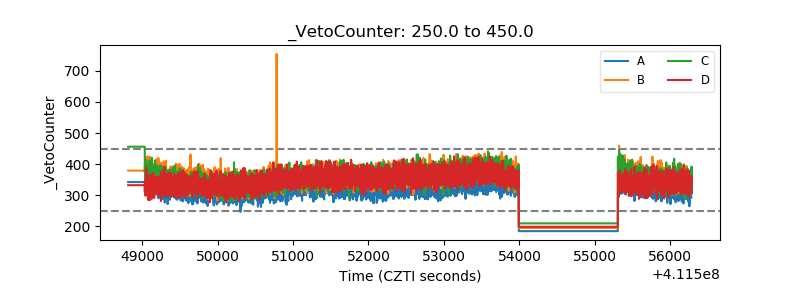 |