| Param | Original file | Final file |
|---|---|---|
| Filename | modeM0/AS1C07_001T02_9000005486_39484cztM0_level2.fits | modeM0/AS1C07_001T02_9000005486_39484cztM0_level2_quad_clean.evt |
| Size (bytes) | 1,065,980,160 | 245,295,360 |
| Size | 1016.6 MB | 233.9 MB |
| Events in quadrant A | 11,171,686 | 1,661,540 |
| Events in quadrant B | 8,960,388 | 1,622,138 |
| Events in quadrant C | 8,849,578 | 1,605,134 |
| Events in quadrant D | 9,268,732 | 1,460,808 |
| Mode M0 | |||
|---|---|---|---|
| Quadrant | BADHDUFLAG | Total packets | Discarded packets |
| A | 0 | 43412 | 4 |
| B | 0 | 37408 | 3 |
| C | 0 | 36075 | 3 |
| D | 0 | 38620 | 3 |
| Mode M9 | |||
|---|---|---|---|
| Quadrant | BADHDUFLAG | Total packets | Discarded packets |
| A | 0 | 43 | 0 |
| B | 0 | 43 | 0 |
| C | 0 | 43 | 0 |
| D | 0 | 43 | 0 |
| Mode SS | |||
|---|---|---|---|
| Quadrant | BADHDUFLAG | Total packets | Discarded packets |
| A | 0 | 316 | 0 |
| B | 0 | 316 | 0 |
| C | 0 | 316 | 0 |
| D | 0 | 316 | 0 |
| Quadrant | Total seconds | Saturated seconds | Saturation percentage |
|---|---|---|---|
| A | 15617 | 432 | 2.766216% |
| B | 15617 | 718 | 4.597554% |
| C | 15617 | 262 | 1.677659% |
| D | 15617 | 537 | 3.438561% |
Noise dominated data is calculated using 1-second bins in cleaned event files. If a bin has >2000 counts, and if more than 50% of those come from <1% of pixels, then it is considered to be noise-dominated and hence unusable.
| Quadrant | # 1 sec bins | Bins with >0 counts | Bins with >2000 counts | High rate bins dominated by noise | Noise dominated (total time) | Noise dominated (detector-on time) | Marked lightcurve |
|---|---|---|---|---|---|---|---|
| A | 19856 | 15620 | 310 | 310 | 1.56% | 1.98% | 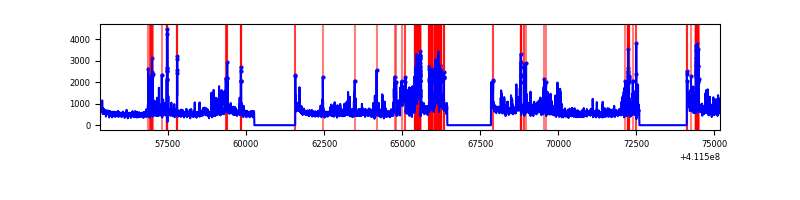 |
| B | 19856 | 15620 | 565 | 565 | 2.85% | 3.62% | 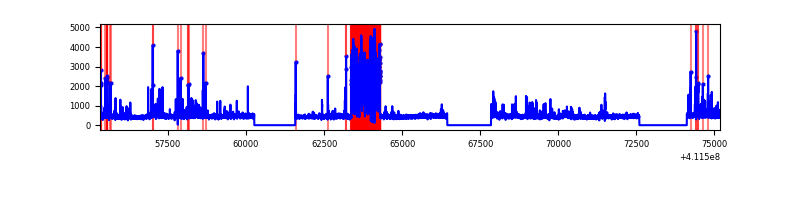 |
| C | 19856 | 15620 | 207 | 207 | 1.04% | 1.33% | 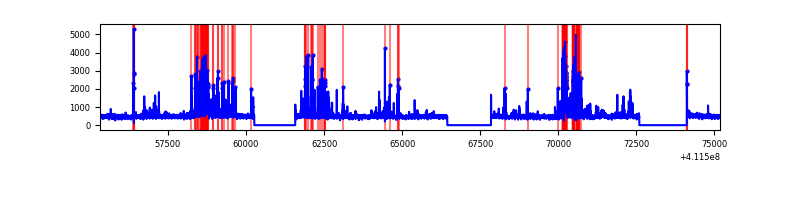 |
| D | 19856 | 15620 | 416 | 416 | 2.10% | 2.66% | 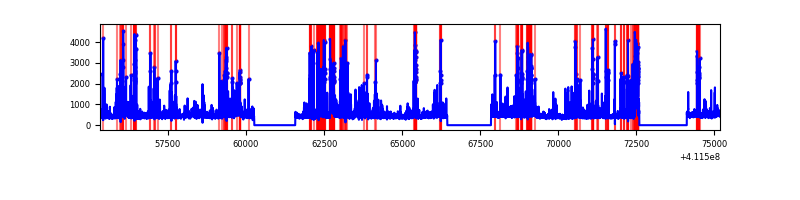 |
Top three noisy pixels from each quadrant. If the there are fewer than three noisy pixels in the level2.evt file, extra rows are filled as -1
| Pixel properties | Quadrant properties | ||||||
|---|---|---|---|---|---|---|---|
| Quadrant | DetID | PixID | Counts | Sigma | Mean | Median | Sigma |
| A | 15 | 222 | 2505511 | 7354.14 | 1683 | 1650 | 340.5 |
| A | 10 | 83 | 1126453 | 3303.68 | 1683 | 1650 | 340.5 |
| A | 15 | 174 | 555740 | 1627.43 | 1683 | 1650 | 340.5 |
| B | 5 | 255 | 2026526 | 6381.88 | 1658 | 1610 | 317.3 |
| B | 5 | 172 | 323853 | 1015.61 | 1658 | 1610 | 317.3 |
| B | 0 | 199 | 44114 | 133.96 | 1658 | 1610 | 317.3 |
| C | 15 | 208 | 1018151 | 2672.91 | 1647 | 1657 | 380.3 |
| C | 15 | 214 | 650227 | 1705.44 | 1647 | 1657 | 380.3 |
| C | 9 | 187 | 614161 | 1610.6 | 1647 | 1657 | 380.3 |
| D | 13 | 249 | 806165 | 1995.5 | 1638 | 1589 | 403.2 |
| D | 12 | 0 | 759852 | 1880.64 | 1638 | 1589 | 403.2 |
| D | 2 | 249 | 693593 | 1716.3 | 1638 | 1589 | 403.2 |
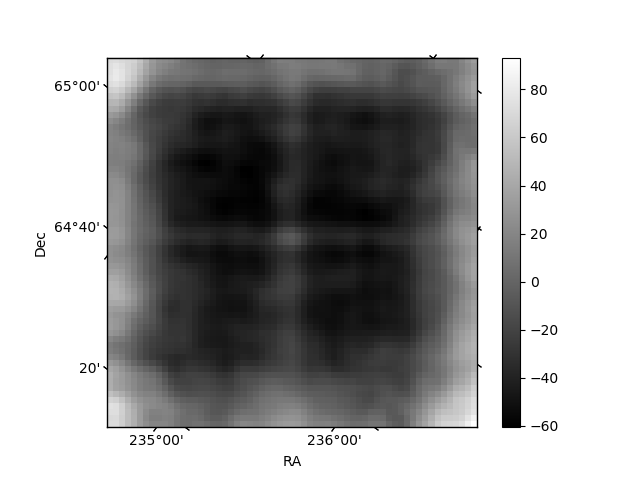
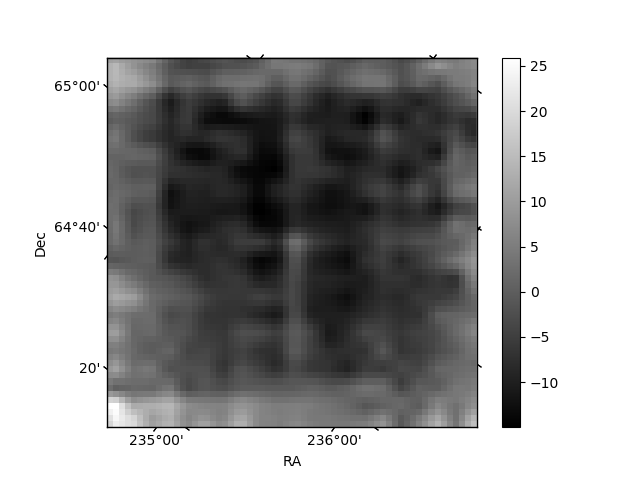
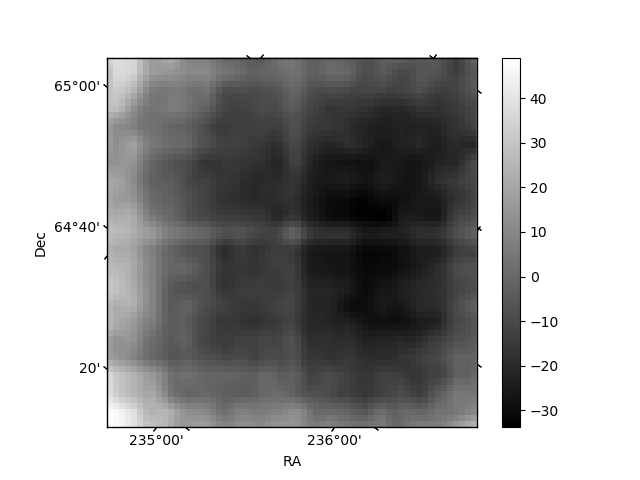
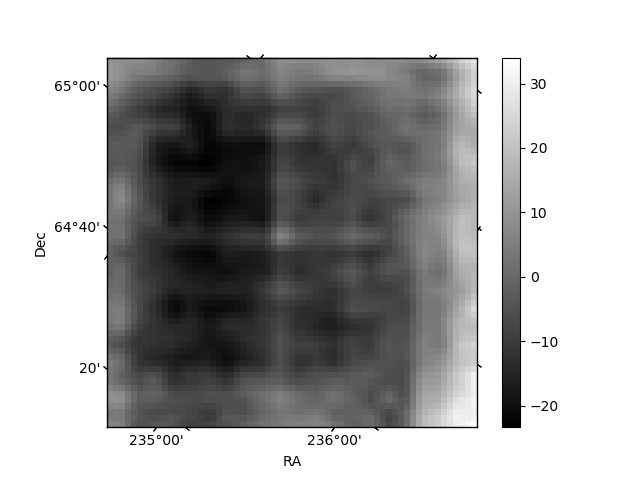
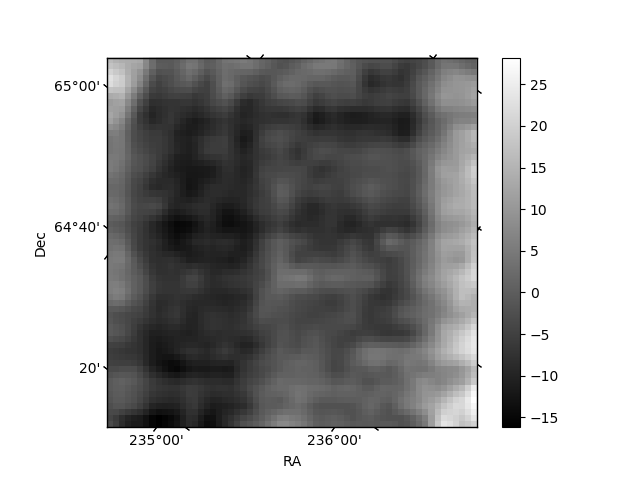
Histogram calculated using DETX and DETY for each event in the final _common_clean file
| Quadrant A | 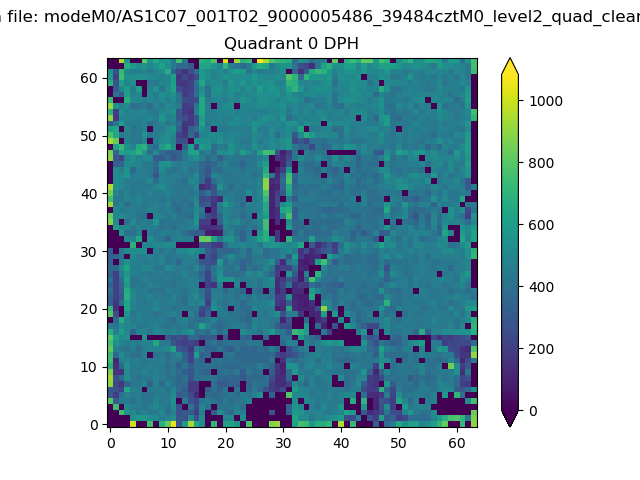 |
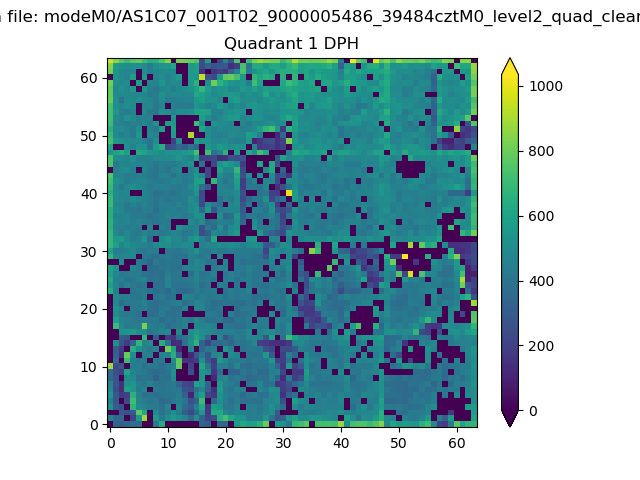 |
Quadrant B |
|---|---|---|---|
| Quadrant D | 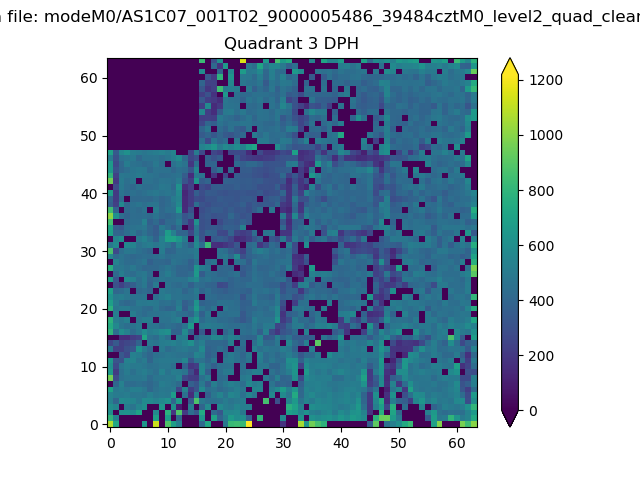 |
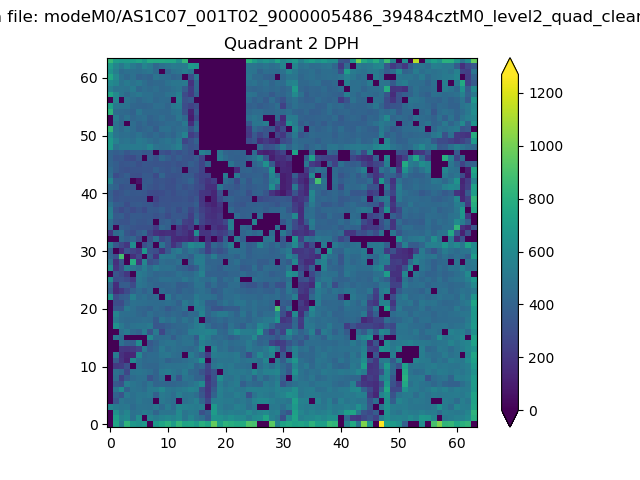 |
Quadrant C |
| Plot type | Count rate plots | Images |
|---|---|---|
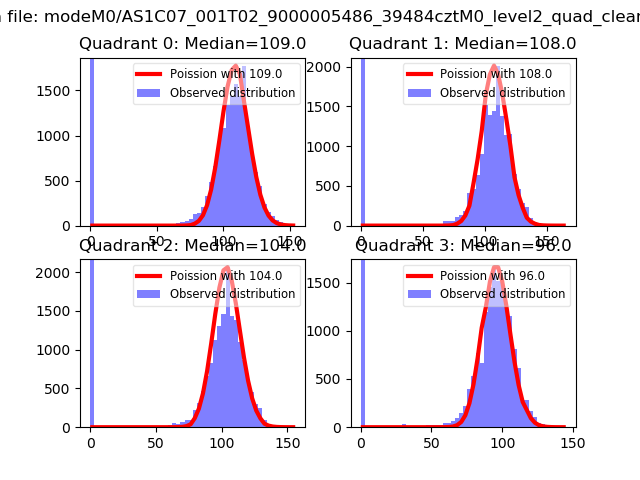
| Comparison with Poisson distribution Blue bars denote a histogram of data divided into 1 sec bins. Red curve is a Poisson curve with rate = median count rate of data. |
 |
 |
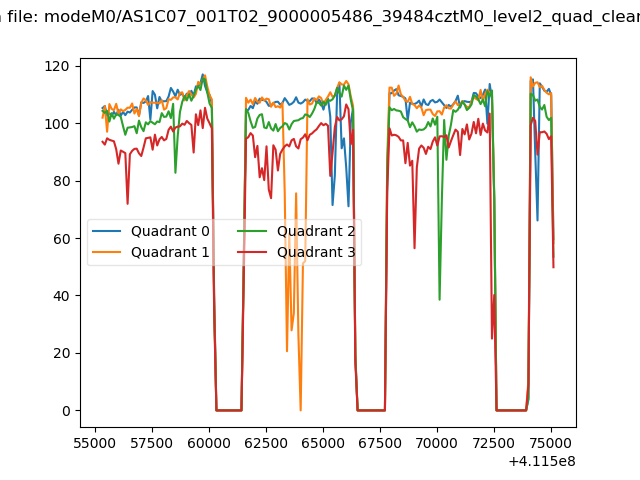
| Quadrant-wise count rates Data is divided into 100 sec bins |
 |
|
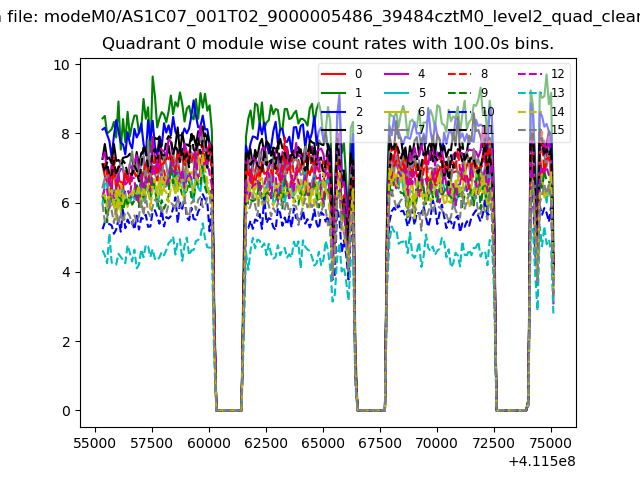
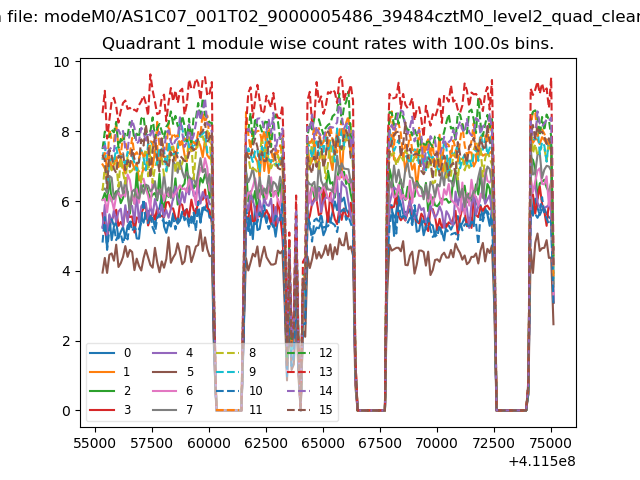
| Module-wise count rates for Quadrant A Data is divided into 100 sec bins |
 |
 |
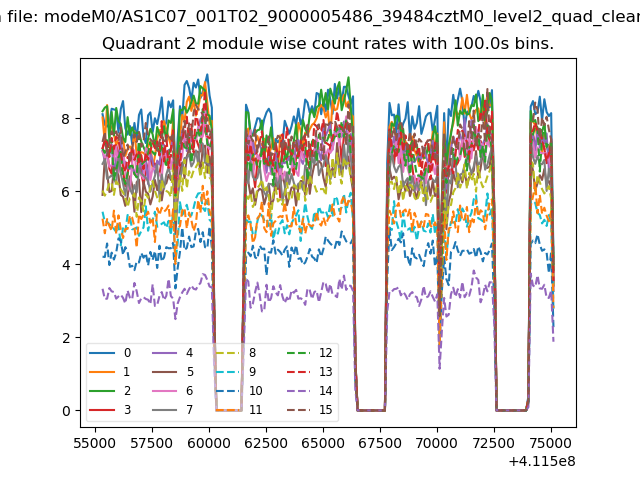
| Module-wise count rates for Quadrant B Data is divided into 100 sec bins |
 |
 |
| Module-wise count rates for Quadrant C Data is divided into 100 sec bins |
 |
 |
| Module-wise count rates for Quadrant D Data is divided into 100 sec bins |
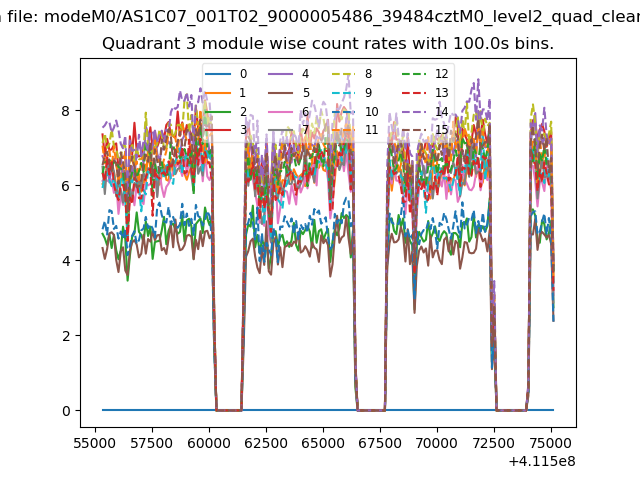 |
 |
| Parameter | Plot |
|---|---|
| CZT HV Monitor | 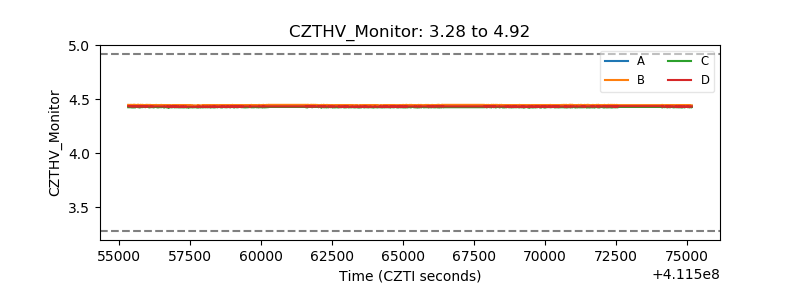 |
| D_VDD | 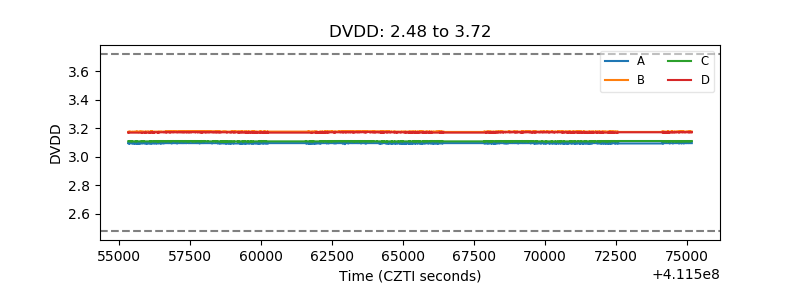 |
| Temperature 1 | 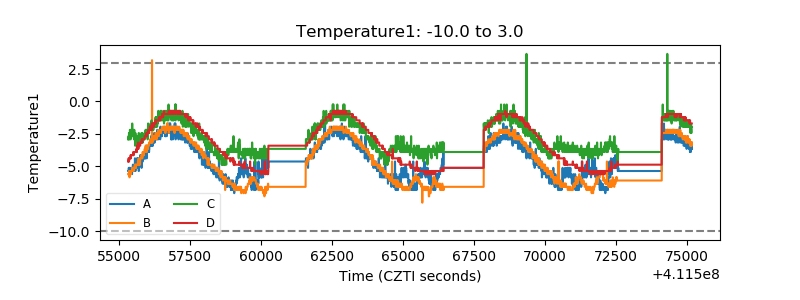 |
| Veto HV Monitor | 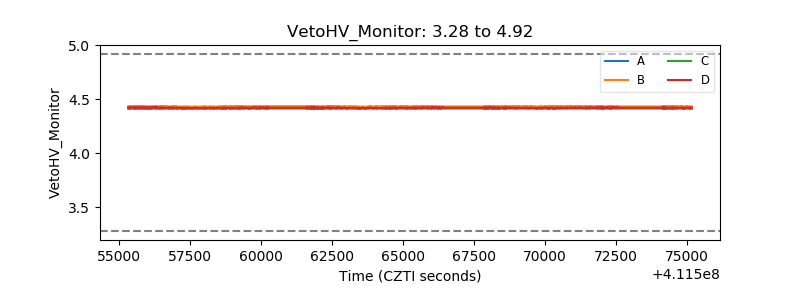 |
| Veto LLD | 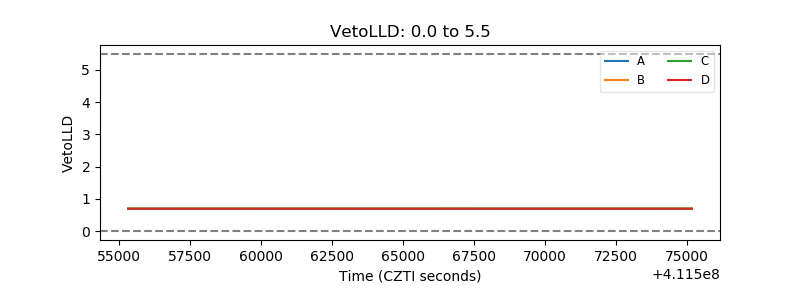 |
| Alpha Counter | 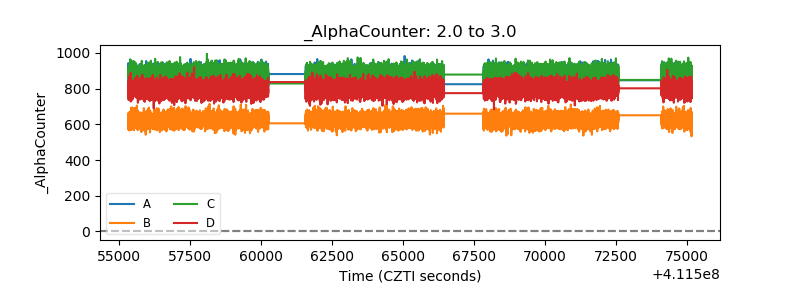 |
| _CPM_Rate | 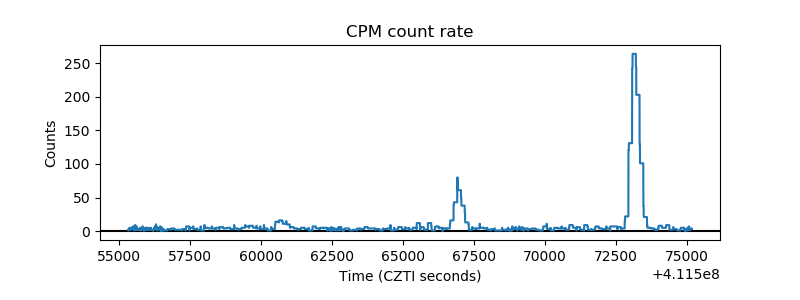 |
| CZT Counter | 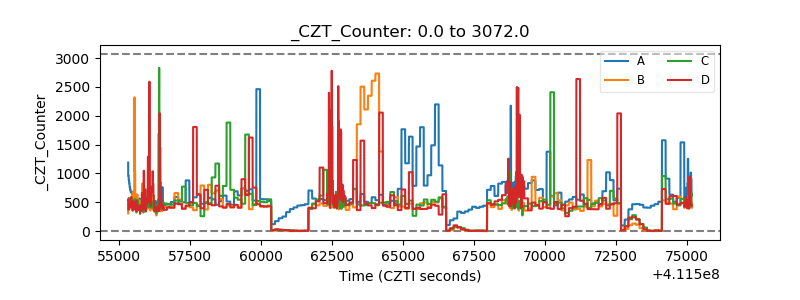 |
| +2.5 Volts monitor |  |
| +5 Volts monitor | 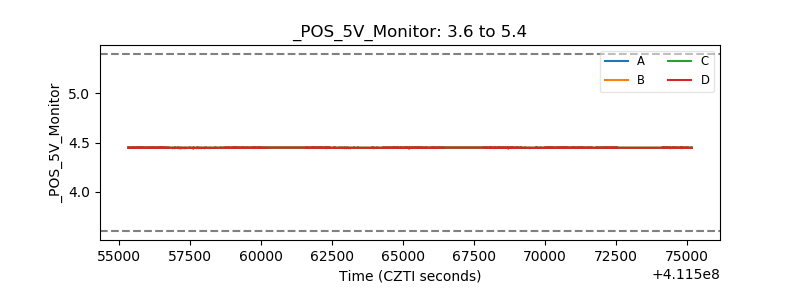 |
| _ROLL_ROT | 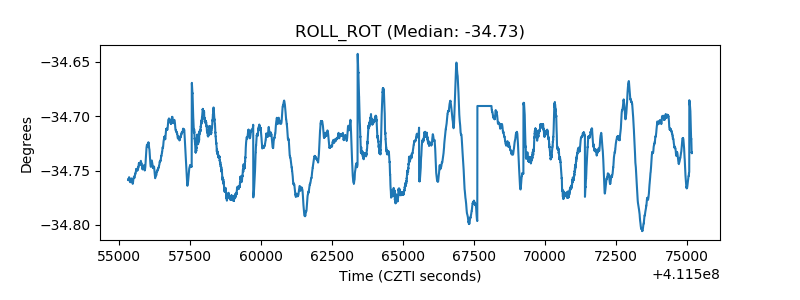 |
| _Roll_DEC | 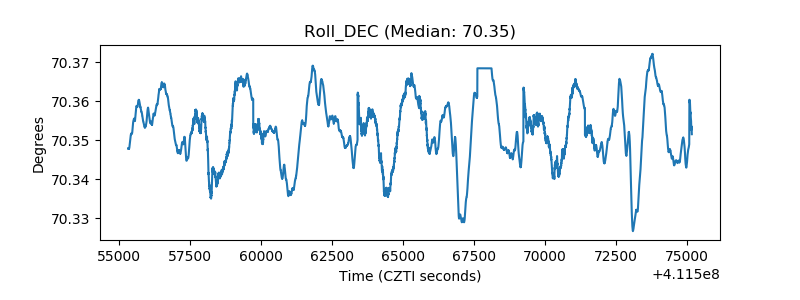 |
| _Roll_RA | 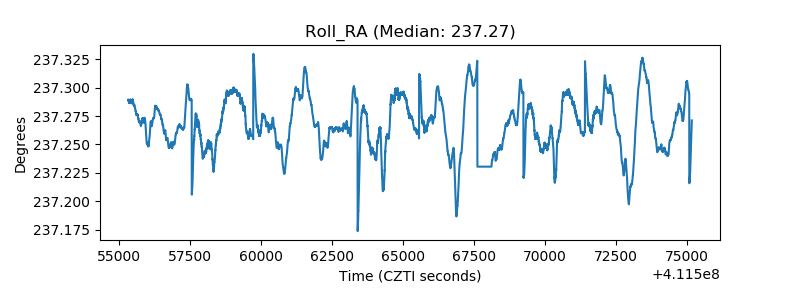 |
| Veto Counter | 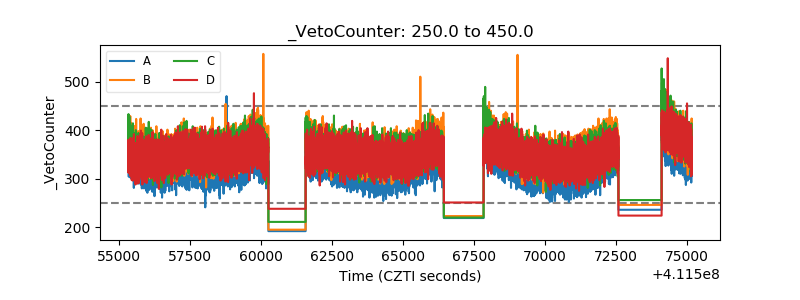 |