| Param | Original file | Final file |
|---|---|---|
| Filename | modeM0/AS1C07_001T02_9000005486_39485cztM0_level2.fits | modeM0/AS1C07_001T02_9000005486_39485cztM0_level2_quad_clean.evt |
| Size (bytes) | 396,002,880 | 86,950,080 |
| Size | 377.7 MB | 82.9 MB |
| Events in quadrant A | 5,488,153 | 549,598 |
| Events in quadrant B | 2,763,927 | 608,412 |
| Events in quadrant C | 3,129,238 | 572,484 |
| Events in quadrant D | 2,860,350 | 526,461 |
| Mode M0 | |||
|---|---|---|---|
| Quadrant | BADHDUFLAG | Total packets | Discarded packets |
| A | 0 | 20000 | 2 |
| B | 0 | 11936 | 1 |
| C | 0 | 12690 | 1 |
| D | 0 | 12291 | 1 |
| Mode M9 | |||
|---|---|---|---|
| Quadrant | BADHDUFLAG | Total packets | Discarded packets |
| A | 0 | 16 | 0 |
| B | 0 | 16 | 0 |
| C | 0 | 16 | 0 |
| D | 0 | 16 | 0 |
| Mode SS | |||
|---|---|---|---|
| Quadrant | BADHDUFLAG | Total packets | Discarded packets |
| A | 0 | 110 | 0 |
| B | 0 | 110 | 0 |
| C | 0 | 110 | 0 |
| D | 0 | 110 | 0 |
| Quadrant | Total seconds | Saturated seconds | Saturation percentage |
|---|---|---|---|
| A | 5365 | 562 | 10.475303% |
| B | 5365 | 42 | 0.782852% |
| C | 5365 | 50 | 0.931966% |
| D | 5365 | 99 | 1.845294% |
Noise dominated data is calculated using 1-second bins in cleaned event files. If a bin has >2000 counts, and if more than 50% of those come from <1% of pixels, then it is considered to be noise-dominated and hence unusable.
| Quadrant | # 1 sec bins | Bins with >0 counts | Bins with >2000 counts | High rate bins dominated by noise | Noise dominated (total time) | Noise dominated (detector-on time) | Marked lightcurve |
|---|---|---|---|---|---|---|---|
| A | 6978 | 5366 | 590 | 590 | 8.46% | 11.00% | 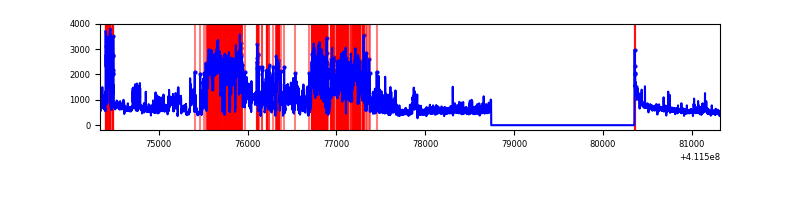 |
| B | 6978 | 5366 | 17 | 17 | 0.24% | 0.32% | 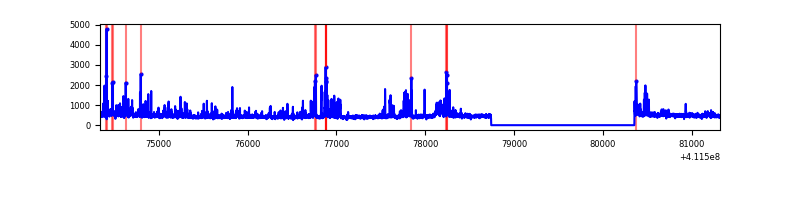 |
| C | 6978 | 5366 | 47 | 47 | 0.67% | 0.88% | 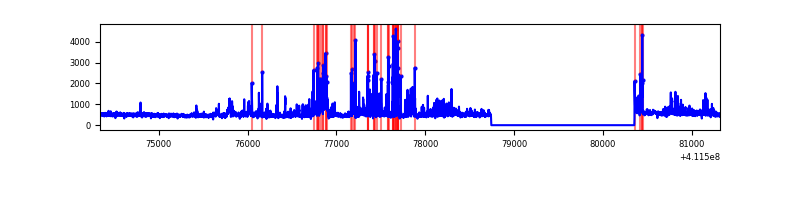 |
| D | 6978 | 5366 | 70 | 70 | 1.00% | 1.30% | 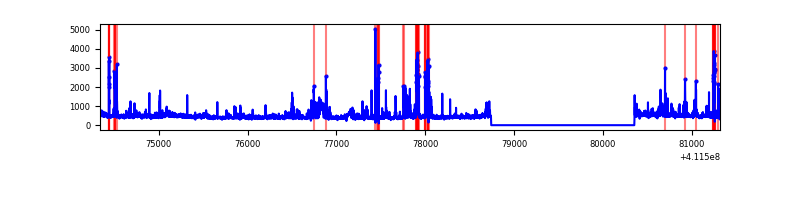 |
Top three noisy pixels from each quadrant. If the there are fewer than three noisy pixels in the level2.evt file, extra rows are filled as -1
| Pixel properties | Quadrant properties | ||||||
|---|---|---|---|---|---|---|---|
| Quadrant | DetID | PixID | Counts | Sigma | Mean | Median | Sigma |
| A | 15 | 222 | 2678987 | 23042.34 | 569 | 554 | 116.2 |
| A | 10 | 83 | 380428 | 3268.03 | 569 | 554 | 116.2 |
| A | 15 | 174 | 189952 | 1629.38 | 569 | 554 | 116.2 |
| B | 5 | 255 | 453627 | 4016.12 | 581 | 563 | 112.8 |
| B | 12 | 111 | 14378 | 122.46 | 581 | 563 | 112.8 |
| B | 11 | 111 | 12927 | 109.6 | 581 | 563 | 112.8 |
| C | 15 | 208 | 565578 | 4240.92 | 572 | 575 | 133.2 |
| C | 15 | 214 | 223439 | 1672.82 | 572 | 575 | 133.2 |
| C | 9 | 187 | 96764 | 722.0 | 572 | 575 | 133.2 |
| D | 13 | 249 | 245938 | 1751.39 | 569 | 551 | 140.1 |
| D | 12 | 227 | 186238 | 1325.3 | 569 | 551 | 140.1 |
| D | 12 | 0 | 89326 | 633.61 | 569 | 551 | 140.1 |
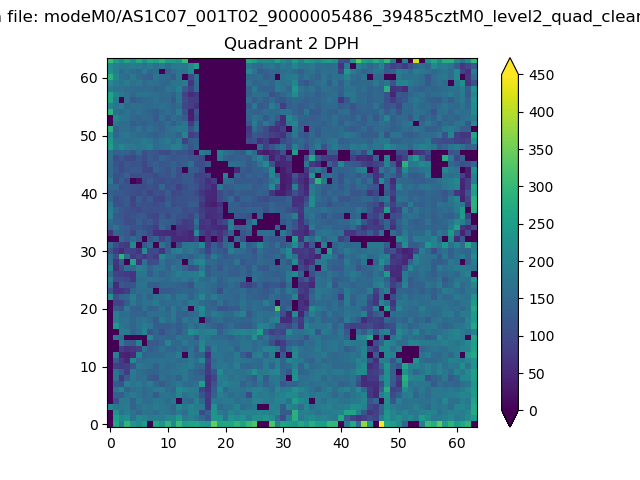
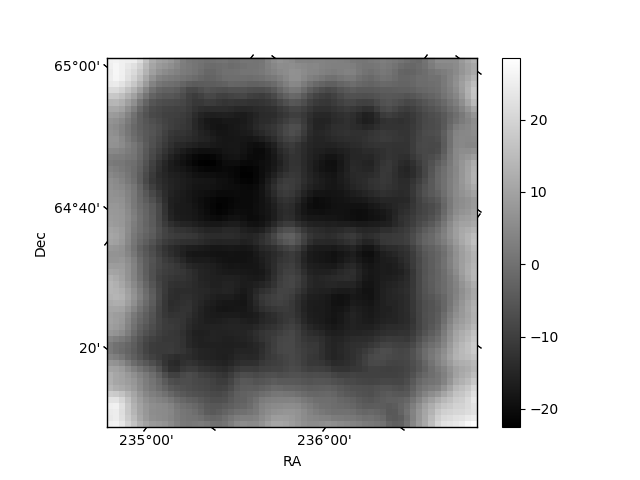
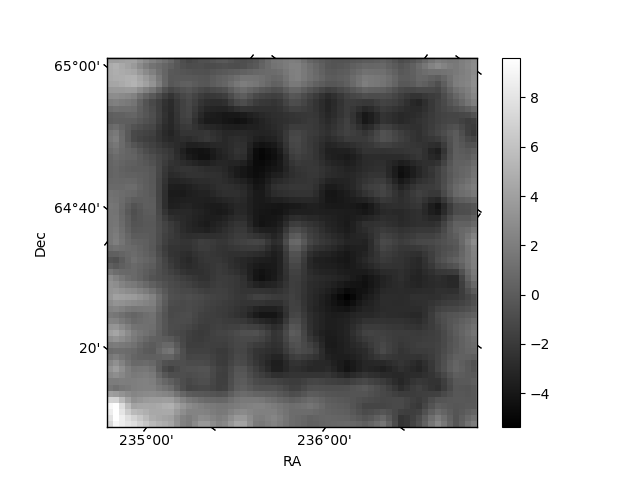
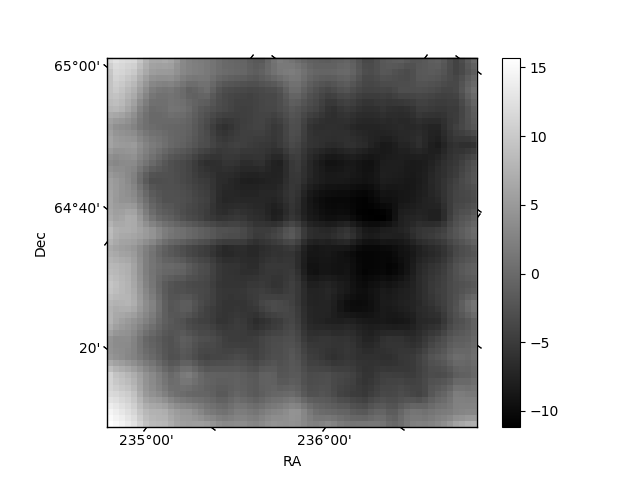
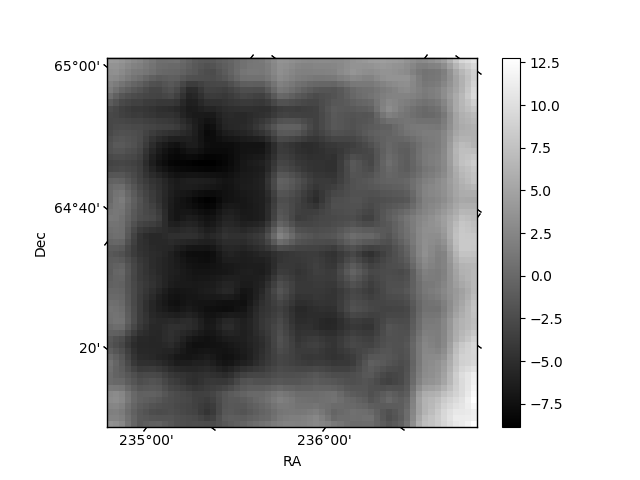
Histogram calculated using DETX and DETY for each event in the final _common_clean file
| Quadrant A | 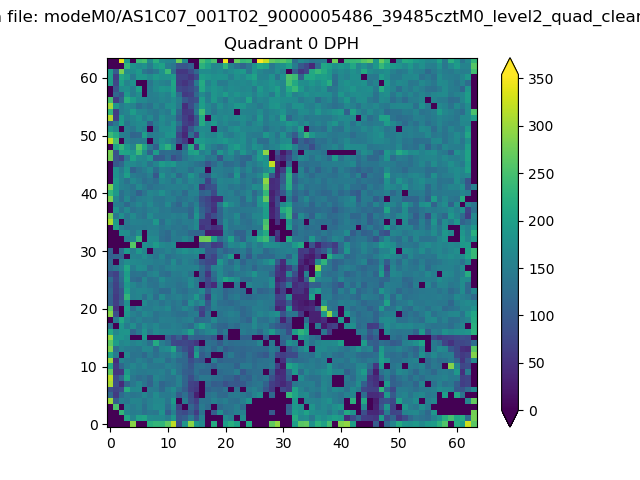 |
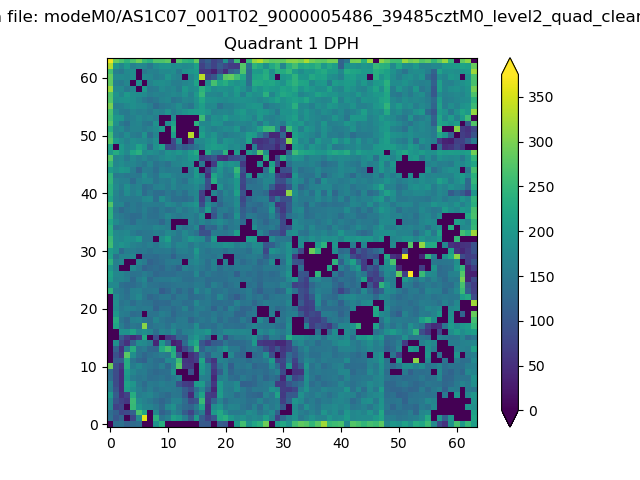 |
Quadrant B |
|---|---|---|---|
| Quadrant D | 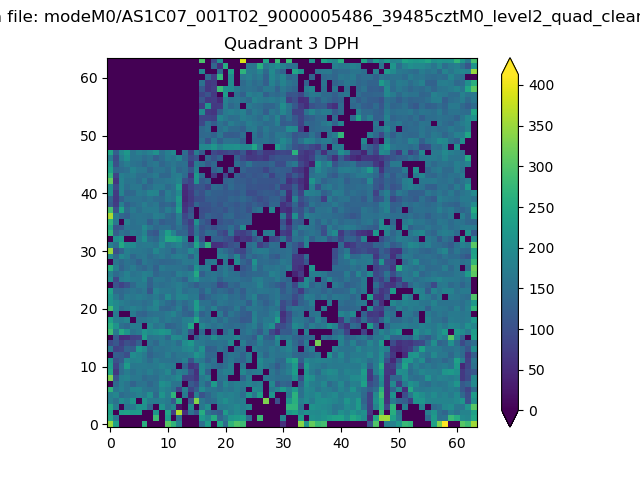 |
 |
Quadrant C |
| Plot type | Count rate plots | Images |
|---|---|---|
| Comparison with Poisson distribution Blue bars denote a histogram of data divided into 1 sec bins. Red curve is a Poisson curve with rate = median count rate of data. |
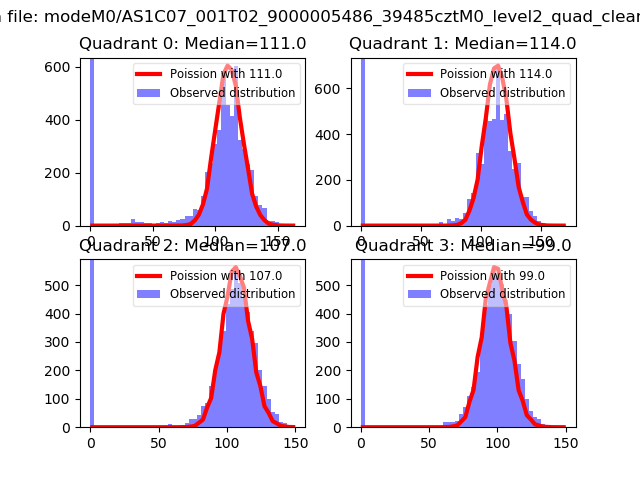 |
 |
| Quadrant-wise count rates Data is divided into 100 sec bins |
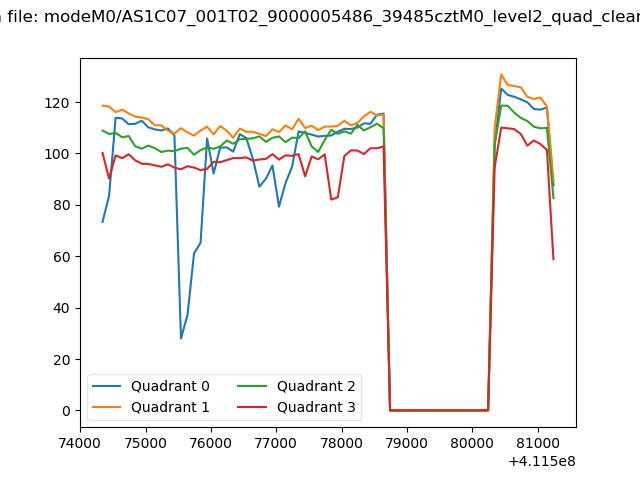 |
|
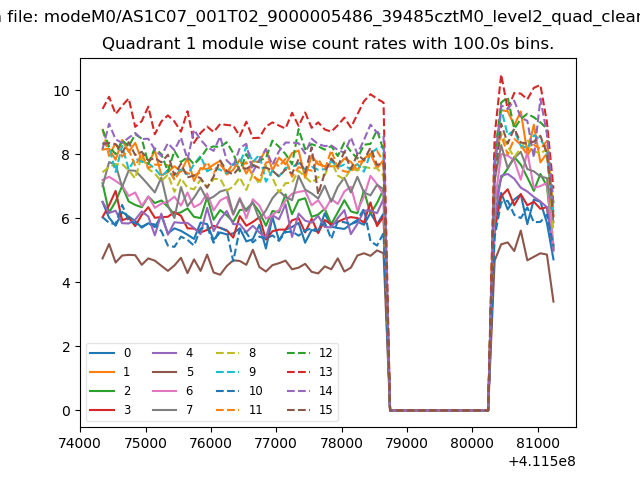
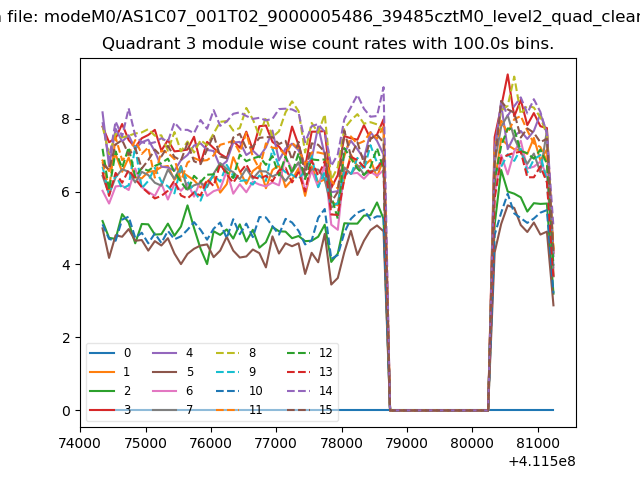
| Module-wise count rates for Quadrant A Data is divided into 100 sec bins |
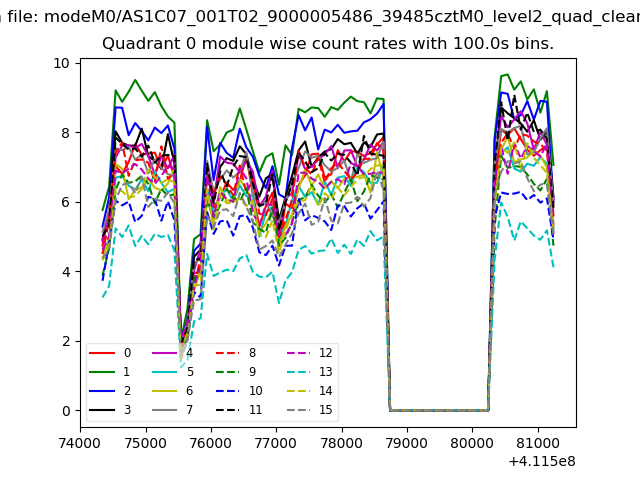 |
 |
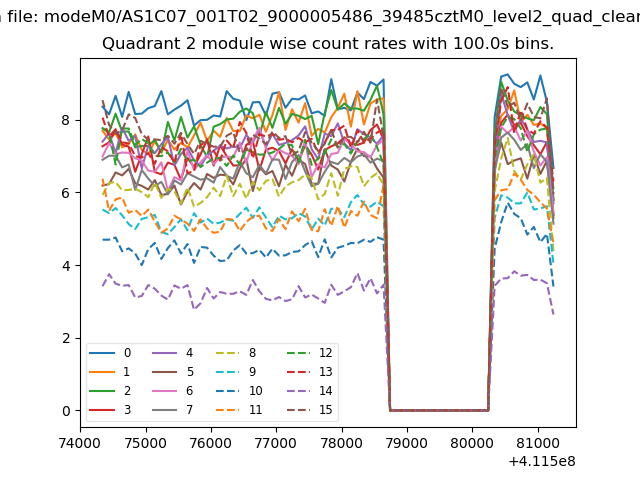
| Module-wise count rates for Quadrant B Data is divided into 100 sec bins |
 |
 |
| Module-wise count rates for Quadrant C Data is divided into 100 sec bins |
 |
 |
| Module-wise count rates for Quadrant D Data is divided into 100 sec bins |
 |
 |
| Parameter | Plot |
|---|---|
| CZT HV Monitor | 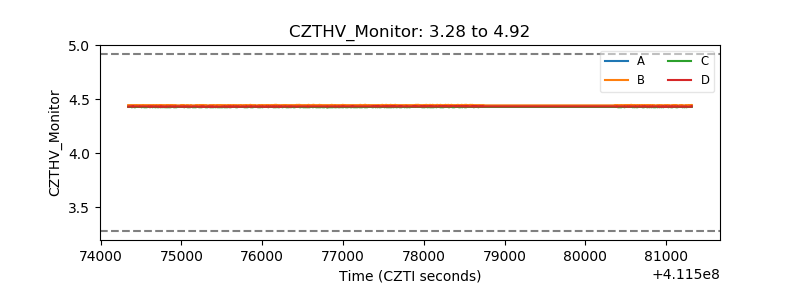 |
| D_VDD | 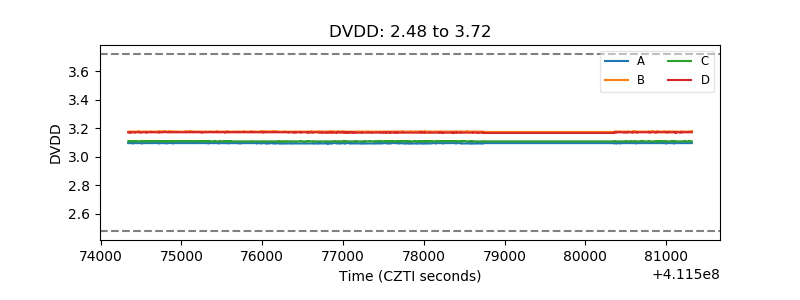 |
| Temperature 1 | 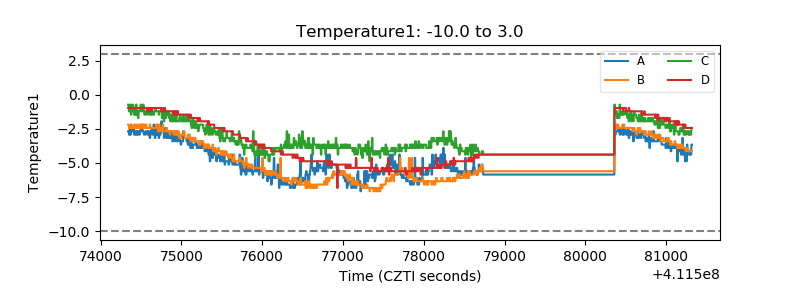 |
| Veto HV Monitor | 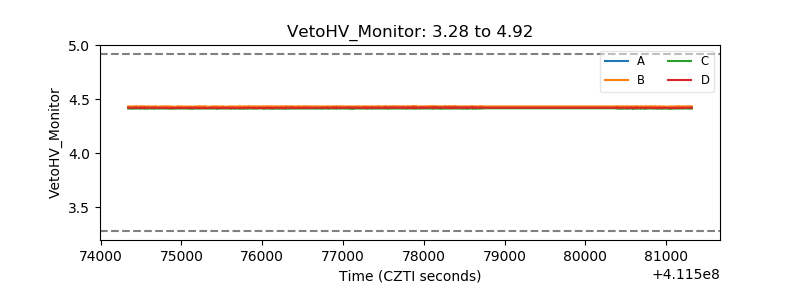 |
| Veto LLD | 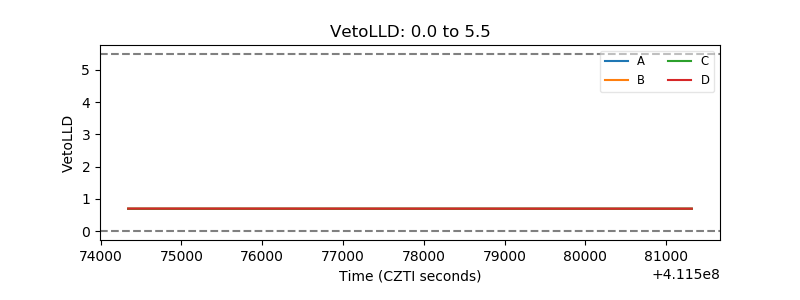 |
| Alpha Counter | 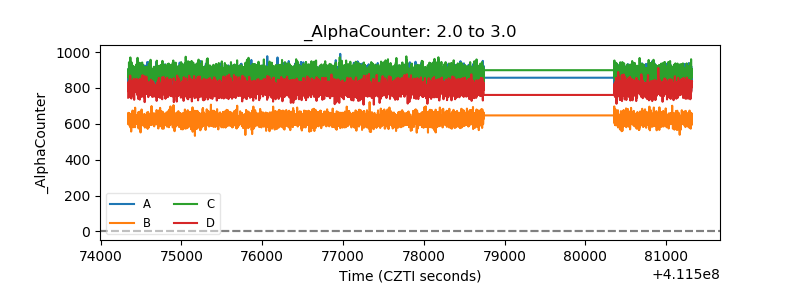 |
| _CPM_Rate | 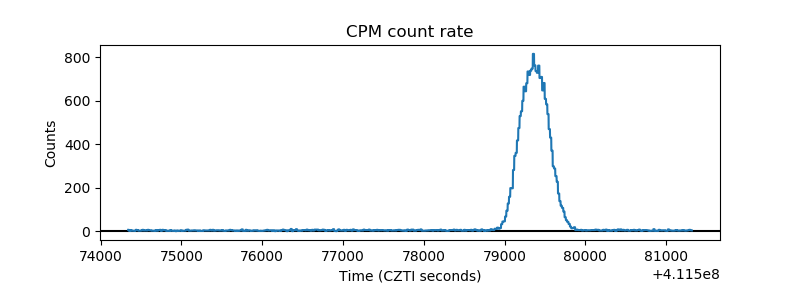 |
| CZT Counter | 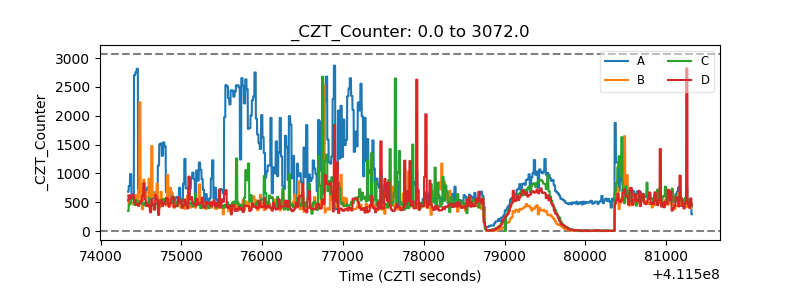 |
| +2.5 Volts monitor | 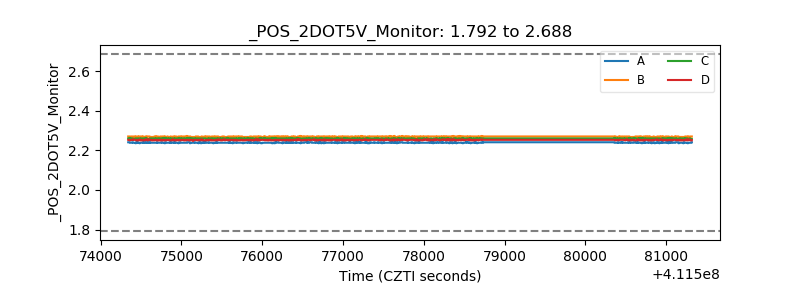 |
| +5 Volts monitor | 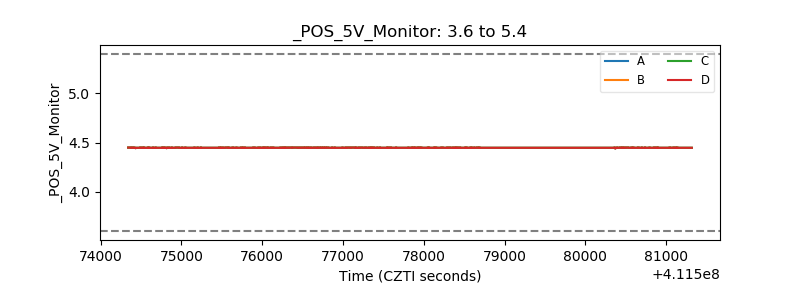 |
| _ROLL_ROT | 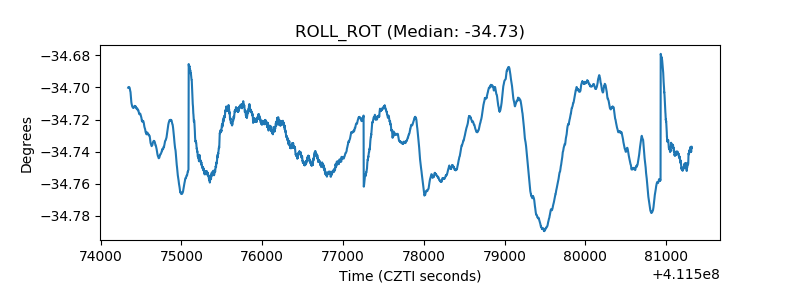 |
| _Roll_DEC | 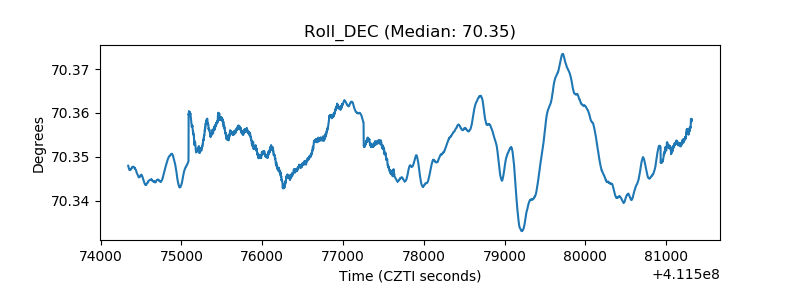 |
| _Roll_RA | 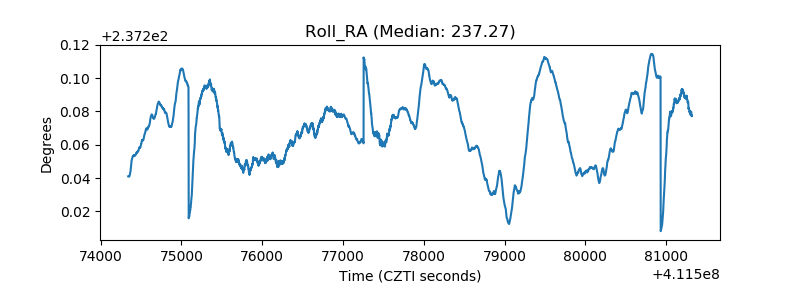 |
| Veto Counter | 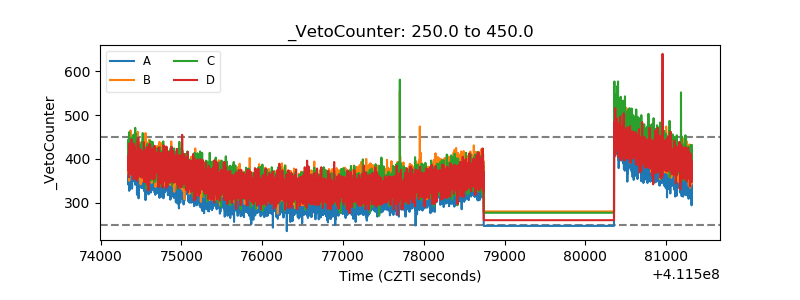 |