| Param | Original file | Final file |
|---|---|---|
| Filename | modeM0/AS1C07_001T02_9000005486_39487cztM0_level2.fits | modeM0/AS1C07_001T02_9000005486_39487cztM0_level2_quad_clean.evt |
| Size (bytes) | 541,578,240 | 133,202,880 |
| Size | 516.5 MB | 127.0 MB |
| Events in quadrant A | 5,949,208 | 883,495 |
| Events in quadrant B | 4,162,354 | 918,269 |
| Events in quadrant C | 4,660,615 | 877,233 |
| Events in quadrant D | 4,654,145 | 797,839 |
| Mode M0 | |||
|---|---|---|---|
| Quadrant | BADHDUFLAG | Total packets | Discarded packets |
| A | 0 | 22902 | 3 |
| B | 0 | 17975 | 2 |
| C | 0 | 19123 | 2 |
| D | 0 | 19631 | 2 |
| Mode M9 | |||
|---|---|---|---|
| Quadrant | BADHDUFLAG | Total packets | Discarded packets |
| A | 0 | 34 | 0 |
| B | 0 | 34 | 0 |
| C | 0 | 34 | 0 |
| D | 0 | 34 | 0 |
| Mode SS | |||
|---|---|---|---|
| Quadrant | BADHDUFLAG | Total packets | Discarded packets |
| A | 0 | 164 | 0 |
| B | 0 | 164 | 0 |
| C | 0 | 164 | 0 |
| D | 0 | 164 | 0 |
| Quadrant | Total seconds | Saturated seconds | Saturation percentage |
|---|---|---|---|
| A | 8008 | 239 | 2.984515% |
| B | 8008 | 77 | 0.961538% |
| C | 8008 | 74 | 0.924076% |
| D | 8008 | 230 | 2.872128% |
Noise dominated data is calculated using 1-second bins in cleaned event files. If a bin has >2000 counts, and if more than 50% of those come from <1% of pixels, then it is considered to be noise-dominated and hence unusable.
| Quadrant | # 1 sec bins | Bins with >0 counts | Bins with >2000 counts | High rate bins dominated by noise | Noise dominated (total time) | Noise dominated (detector-on time) | Marked lightcurve |
|---|---|---|---|---|---|---|---|
| A | 11383 | 8010 | 264 | 264 | 2.32% | 3.30% | 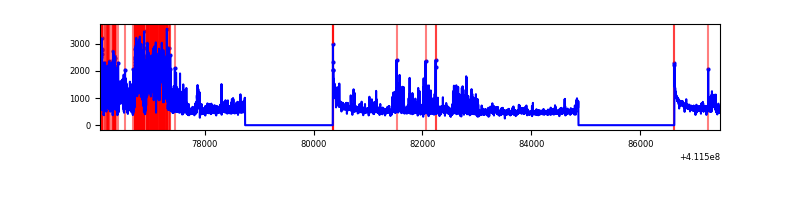 |
| B | 11383 | 8010 | 45 | 45 | 0.40% | 0.56% | 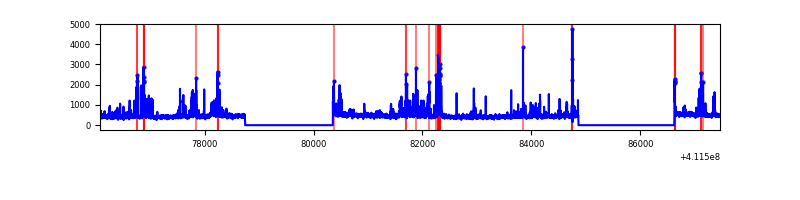 |
| C | 11383 | 8010 | 62 | 62 | 0.54% | 0.77% | 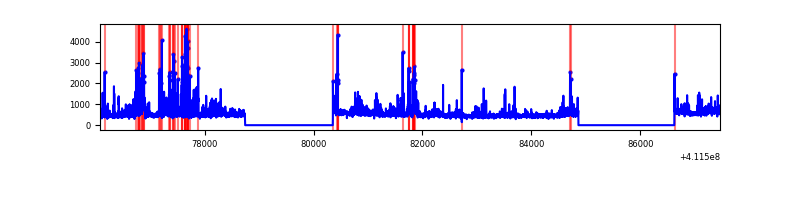 |
| D | 11383 | 8010 | 172 | 172 | 1.51% | 2.15% | 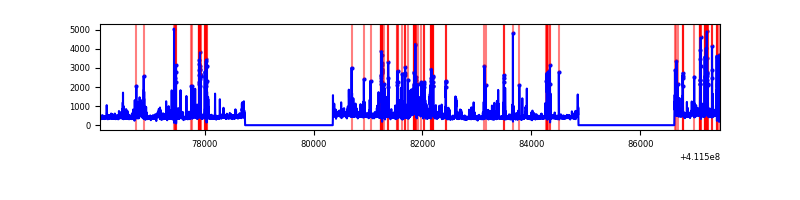 |
Top three noisy pixels from each quadrant. If the there are fewer than three noisy pixels in the level2.evt file, extra rows are filled as -1
| Pixel properties | Quadrant properties | ||||||
|---|---|---|---|---|---|---|---|
| Quadrant | DetID | PixID | Counts | Sigma | Mean | Median | Sigma |
| A | 15 | 222 | 1800182 | 10325.83 | 860 | 841 | 174.3 |
| A | 10 | 83 | 569785 | 3264.98 | 860 | 841 | 174.3 |
| A | 15 | 174 | 163514 | 933.53 | 860 | 841 | 174.3 |
| B | 5 | 255 | 589881 | 3560.46 | 864 | 838 | 165.4 |
| B | 5 | 172 | 156510 | 940.96 | 864 | 838 | 165.4 |
| B | 12 | 111 | 21410 | 124.35 | 864 | 838 | 165.4 |
| C | 15 | 208 | 706122 | 3586.95 | 849 | 856 | 196.6 |
| C | 15 | 214 | 331294 | 1680.59 | 849 | 856 | 196.6 |
| C | 9 | 187 | 283832 | 1439.2 | 849 | 856 | 196.6 |
| D | 13 | 249 | 554359 | 2714.39 | 837 | 813 | 203.9 |
| D | 12 | 227 | 337482 | 1650.9 | 837 | 813 | 203.9 |
| D | 2 | 249 | 295203 | 1443.58 | 837 | 813 | 203.9 |
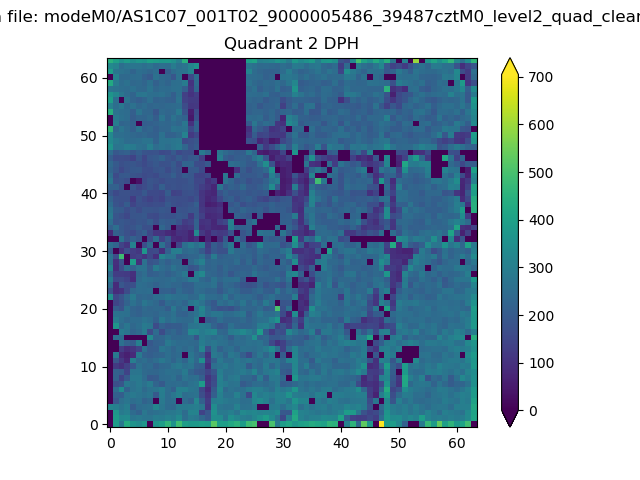
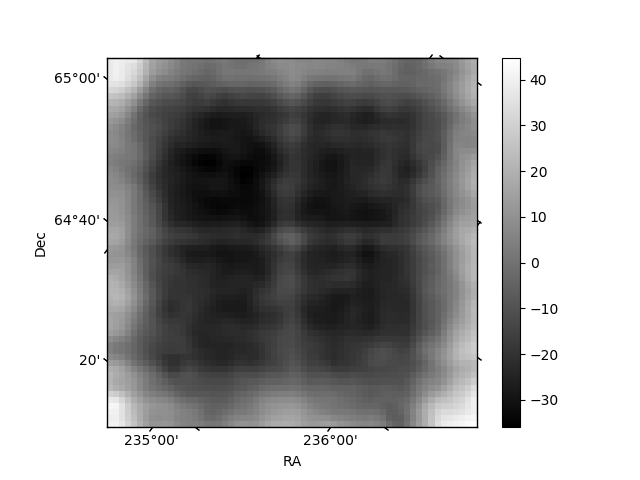
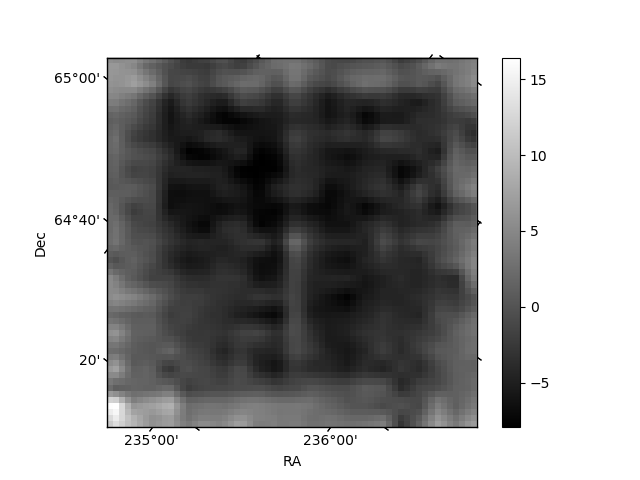
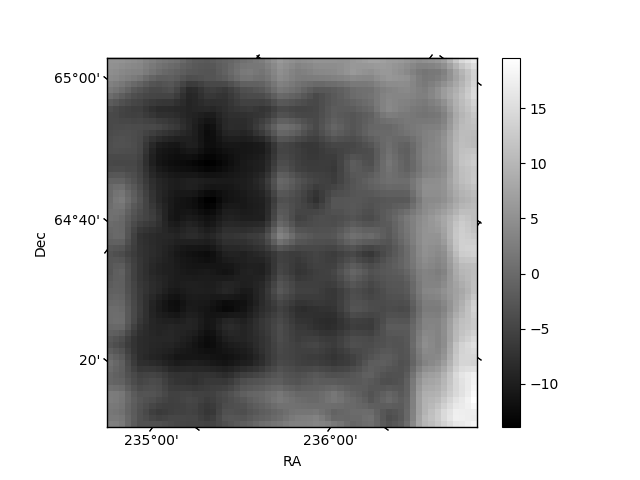
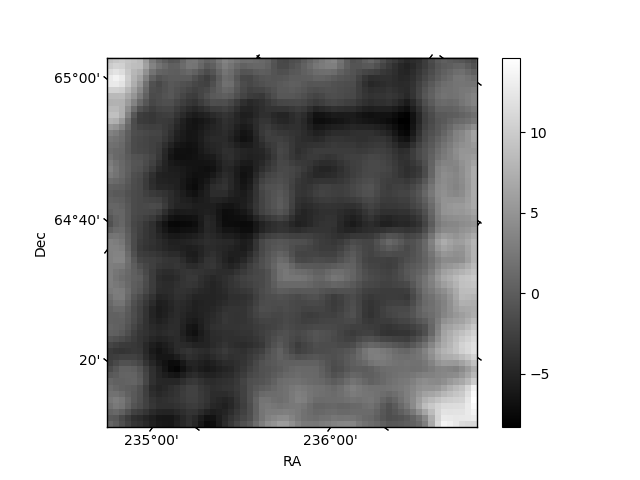
Histogram calculated using DETX and DETY for each event in the final _common_clean file
| Quadrant A | 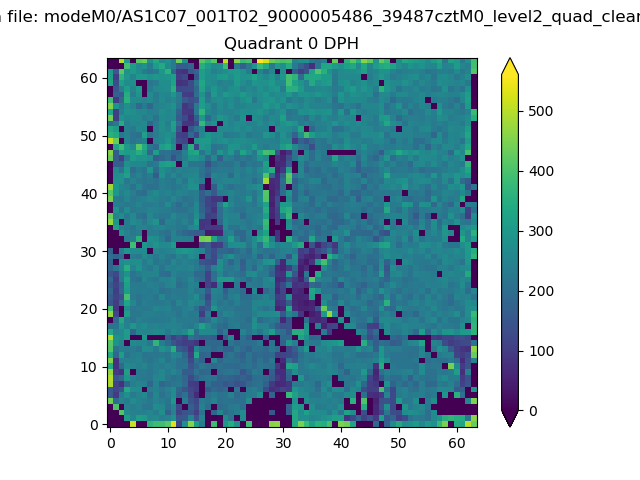 |
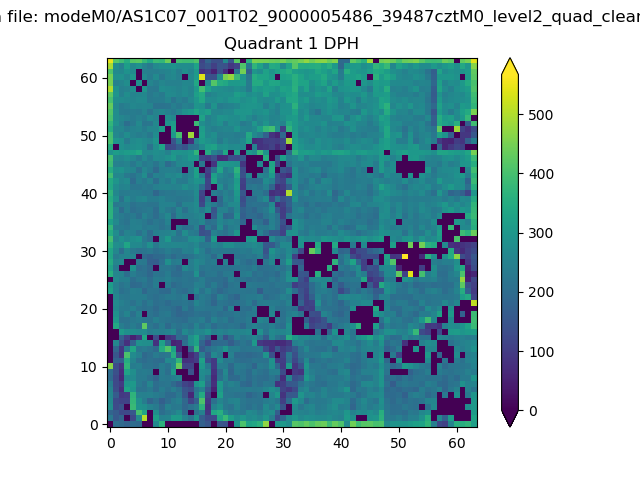 |
Quadrant B |
|---|---|---|---|
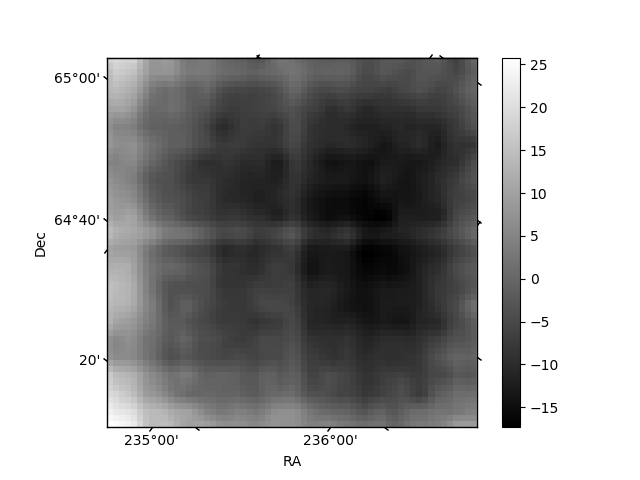
| Quadrant D | 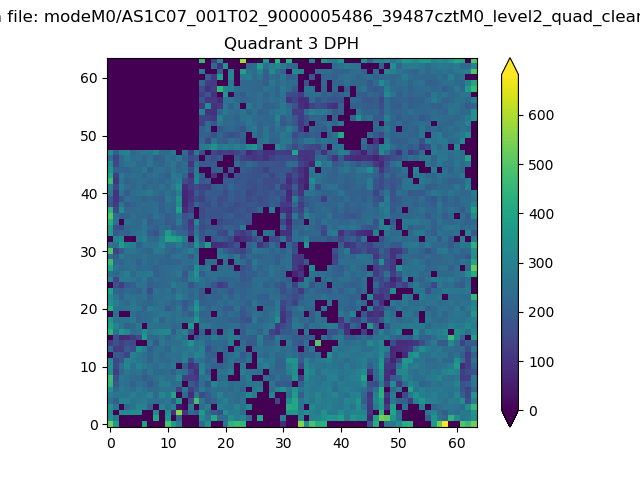 |
 |
Quadrant C |
| Plot type | Count rate plots | Images |
|---|---|---|
| Comparison with Poisson distribution Blue bars denote a histogram of data divided into 1 sec bins. Red curve is a Poisson curve with rate = median count rate of data. |
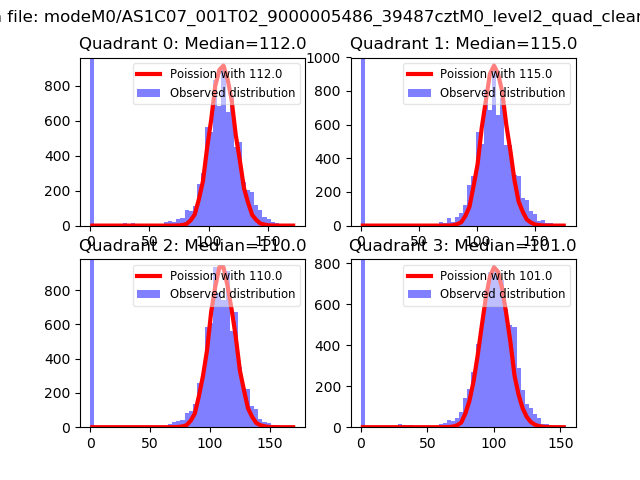 |
 |
| Quadrant-wise count rates Data is divided into 100 sec bins |
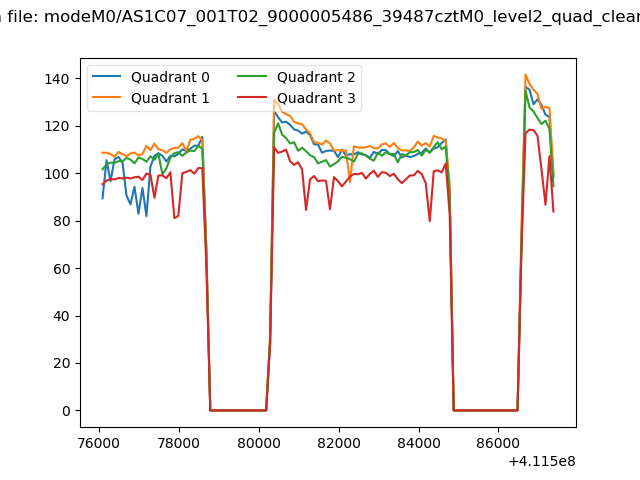 |
|
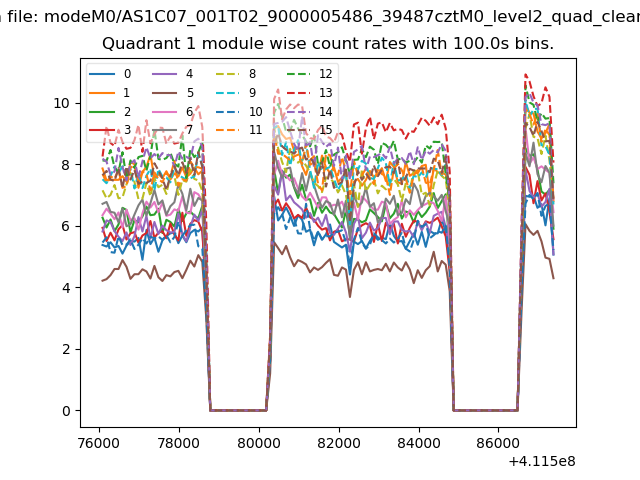
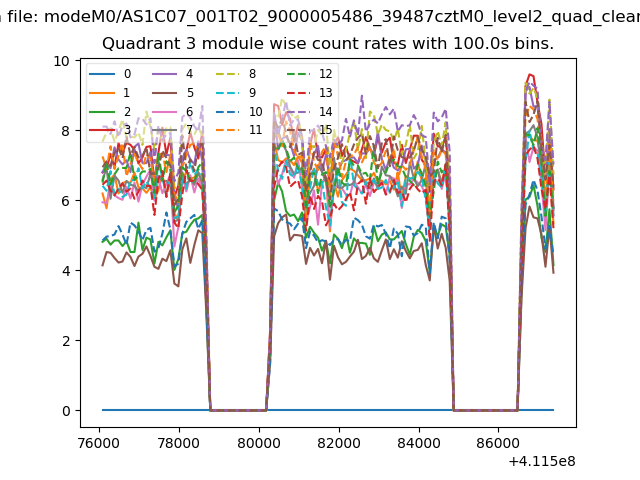
| Module-wise count rates for Quadrant A Data is divided into 100 sec bins |
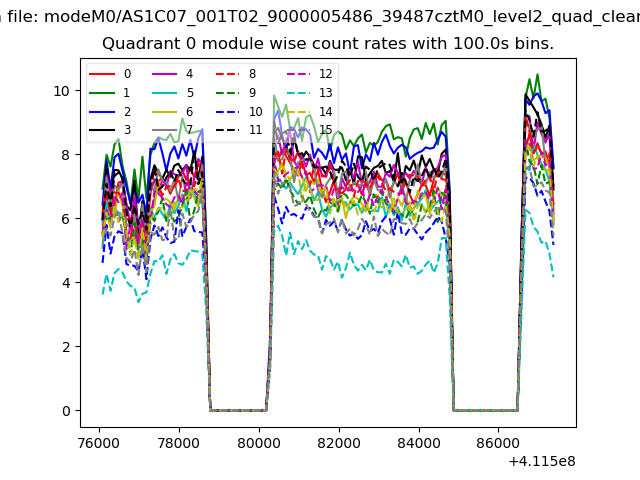 |
 |
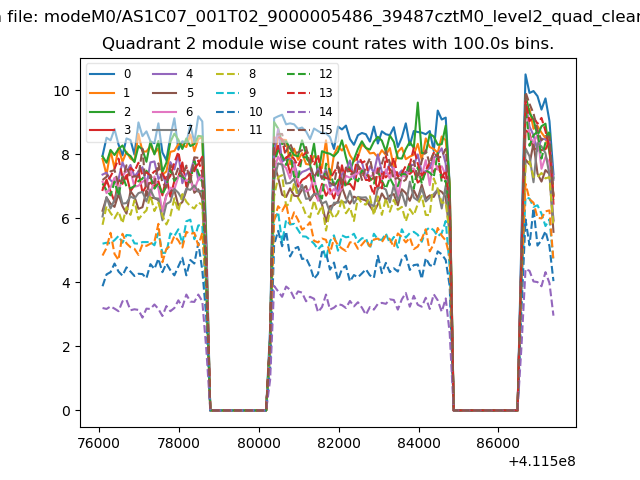
| Module-wise count rates for Quadrant B Data is divided into 100 sec bins |
 |
 |
| Module-wise count rates for Quadrant C Data is divided into 100 sec bins |
 |
 |
| Module-wise count rates for Quadrant D Data is divided into 100 sec bins |
 |
 |
| Parameter | Plot |
|---|---|
| CZT HV Monitor | 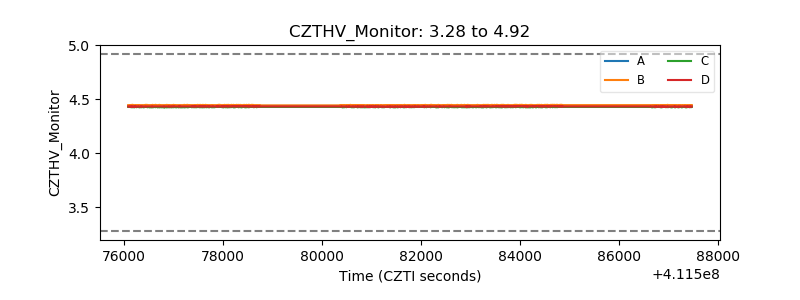 |
| D_VDD | 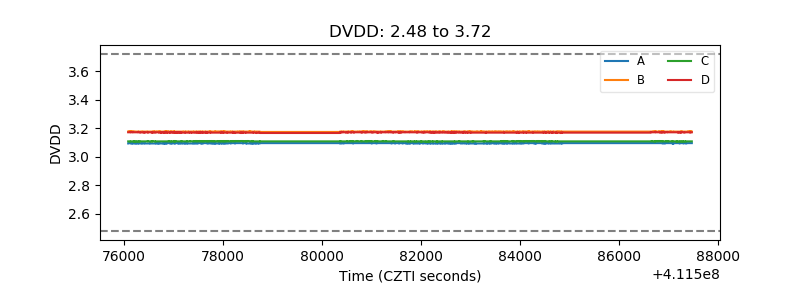 |
| Temperature 1 | 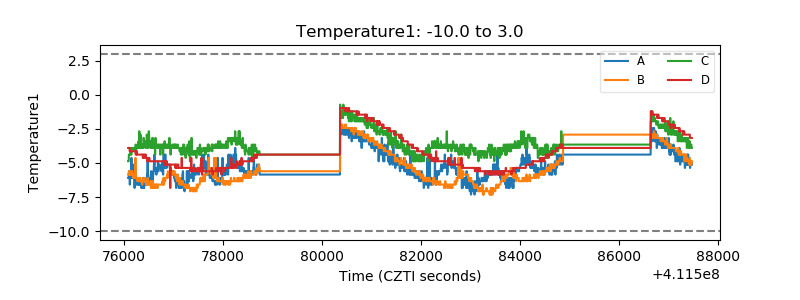 |
| Veto HV Monitor | 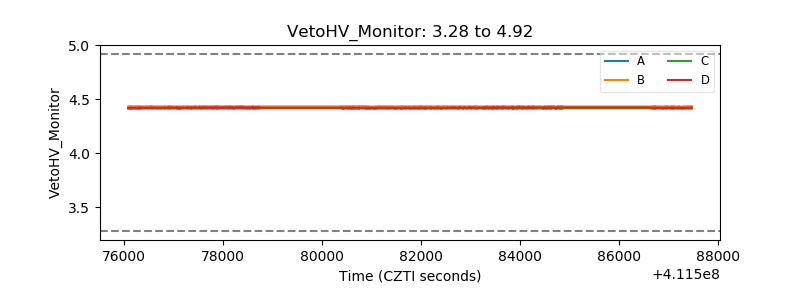 |
| Veto LLD | 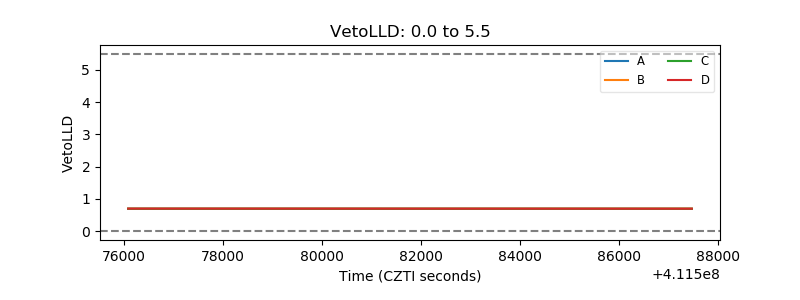 |
| Alpha Counter | 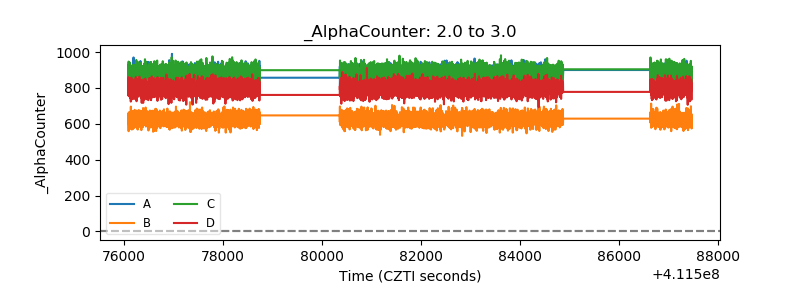 |
| _CPM_Rate | 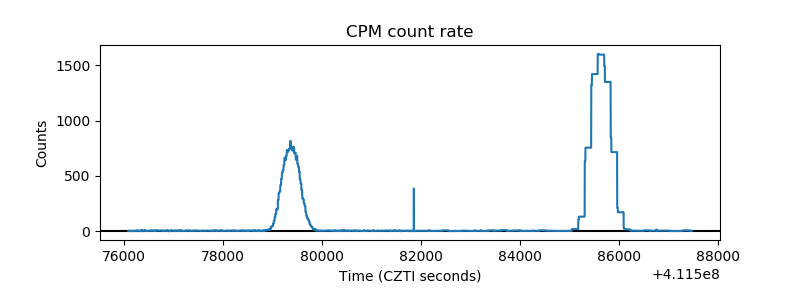 |
| CZT Counter | 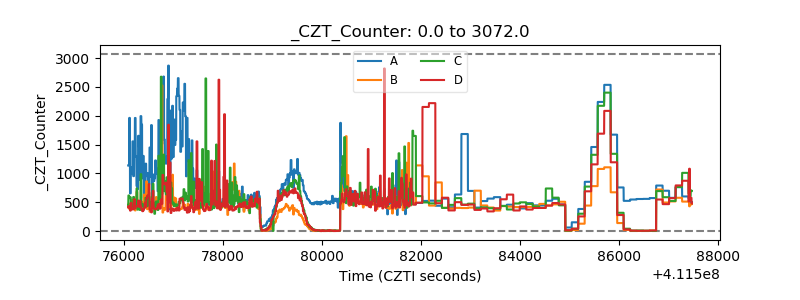 |
| +2.5 Volts monitor | 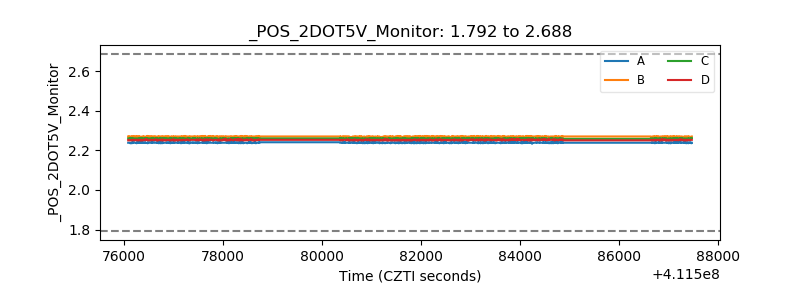 |
| +5 Volts monitor | 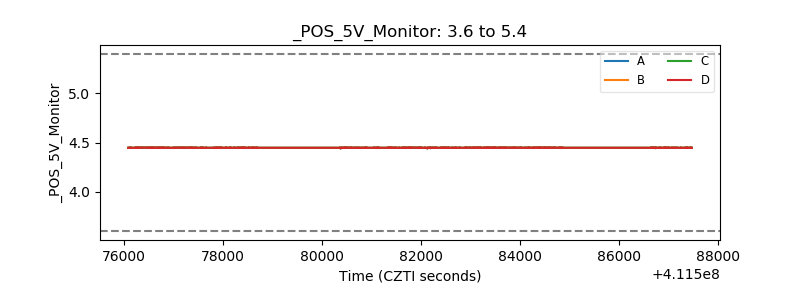 |
| _ROLL_ROT | 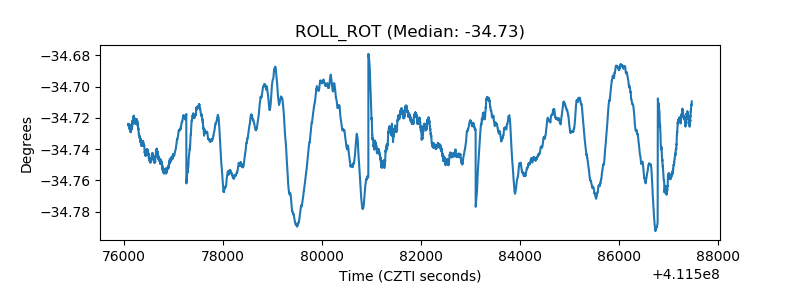 |
| _Roll_DEC | 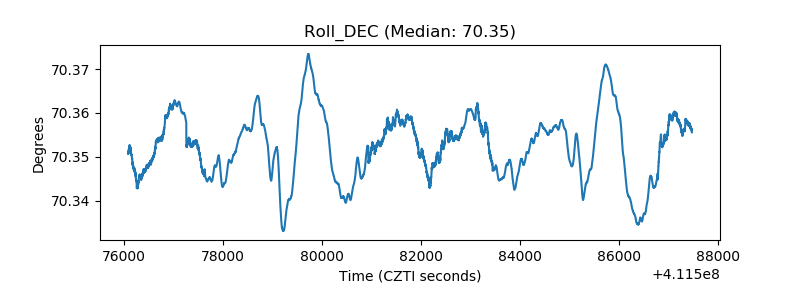 |
| _Roll_RA | 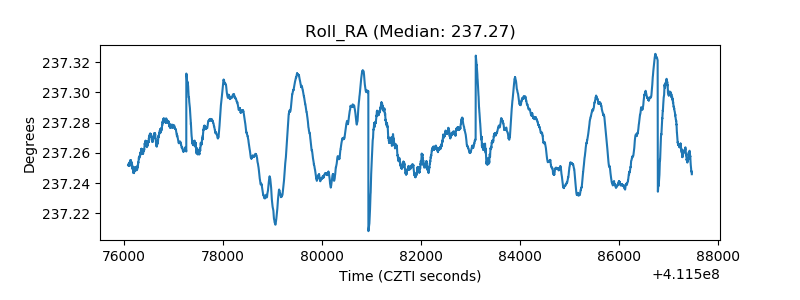 |
| Veto Counter | 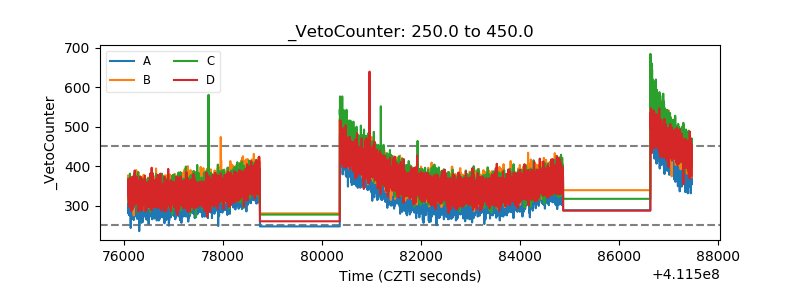 |