| Param | Original file | Final file |
|---|---|---|
| Filename | modeM0/AS1C07_001T02_9000005486_39489cztM0_level2.fits | modeM0/AS1C07_001T02_9000005486_39489cztM0_level2_quad_clean.evt |
| Size (bytes) | 364,210,560 | 88,116,480 |
| Size | 347.3 MB | 84.0 MB |
| Events in quadrant A | 3,824,129 | 589,532 |
| Events in quadrant B | 3,174,936 | 592,590 |
| Events in quadrant C | 2,907,597 | 599,849 |
| Events in quadrant D | 3,191,840 | 540,463 |
| Mode M0 | |||
|---|---|---|---|
| Quadrant | BADHDUFLAG | Total packets | Discarded packets |
| A | 0 | 14662 | 3 |
| B | 0 | 12806 | 2 |
| C | 0 | 11949 | 2 |
| D | 0 | 12916 | 2 |
| Mode M9 | |||
|---|---|---|---|
| Quadrant | BADHDUFLAG | Total packets | Discarded packets |
| A | 0 | 28 | 0 |
| B | 0 | 28 | 0 |
| C | 0 | 28 | 0 |
| D | 0 | 29 | 0 |
| Mode SS | |||
|---|---|---|---|
| Quadrant | BADHDUFLAG | Total packets | Discarded packets |
| A | 0 | 102 | 0 |
| B | 0 | 102 | 0 |
| C | 0 | 102 | 0 |
| D | 0 | 102 | 0 |
| Quadrant | Total seconds | Saturated seconds | Saturation percentage |
|---|---|---|---|
| A | 4927 | 163 | 3.308301% |
| B | 4927 | 290 | 5.885935% |
| C | 4927 | 42 | 0.852446% |
| D | 4927 | 140 | 2.841486% |
Noise dominated data is calculated using 1-second bins in cleaned event files. If a bin has >2000 counts, and if more than 50% of those come from <1% of pixels, then it is considered to be noise-dominated and hence unusable.
| Quadrant | # 1 sec bins | Bins with >0 counts | Bins with >2000 counts | High rate bins dominated by noise | Noise dominated (total time) | Noise dominated (detector-on time) | Marked lightcurve |
|---|---|---|---|---|---|---|---|
| A | 6930 | 4928 | 132 | 132 | 1.90% | 2.68% | 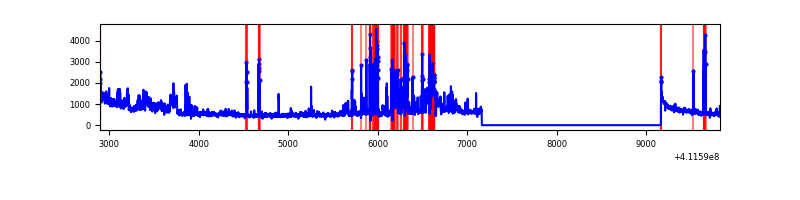 |
| B | 6930 | 4928 | 212 | 212 | 3.06% | 4.30% | 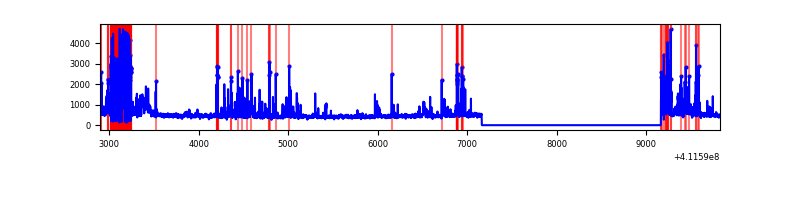 |
| C | 6930 | 4928 | 28 | 28 | 0.40% | 0.57% | 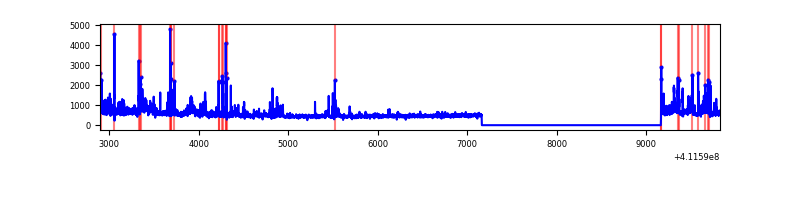 |
| D | 6930 | 4928 | 116 | 116 | 1.67% | 2.35% | 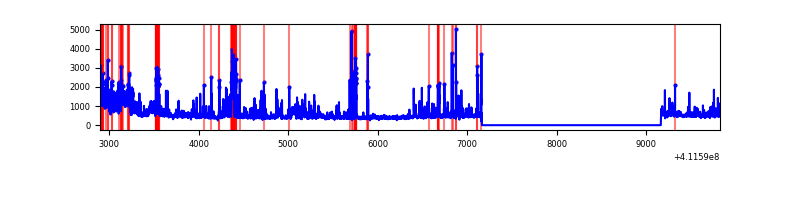 |
Top three noisy pixels from each quadrant. If the there are fewer than three noisy pixels in the level2.evt file, extra rows are filled as -1
| Pixel properties | Quadrant properties | ||||||
|---|---|---|---|---|---|---|---|
| Quadrant | DetID | PixID | Counts | Sigma | Mean | Median | Sigma |
| A | 15 | 174 | 583915 | 5298.92 | 548 | 539 | 110.1 |
| A | 6 | 10 | 446823 | 4053.69 | 548 | 539 | 110.1 |
| A | 10 | 83 | 405423 | 3677.64 | 548 | 539 | 110.1 |
| B | 5 | 172 | 754559 | 7317.27 | 539 | 526 | 103.0 |
| B | 5 | 255 | 288783 | 2797.3 | 539 | 526 | 103.0 |
| B | 12 | 111 | 12254 | 113.81 | 539 | 526 | 103.0 |
| C | 15 | 208 | 367509 | 2907.56 | 549 | 554 | 126.2 |
| C | 15 | 214 | 209321 | 1654.16 | 549 | 554 | 126.2 |
| C | 9 | 187 | 165009 | 1303.05 | 549 | 554 | 126.2 |
| D | 12 | 0 | 470988 | 3604.3 | 541 | 527 | 130.5 |
| D | 2 | 249 | 238391 | 1822.32 | 541 | 527 | 130.5 |
| D | 12 | 227 | 183675 | 1403.13 | 541 | 527 | 130.5 |
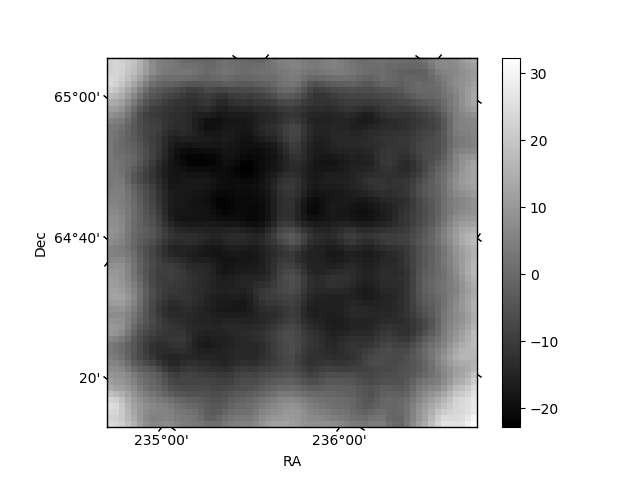
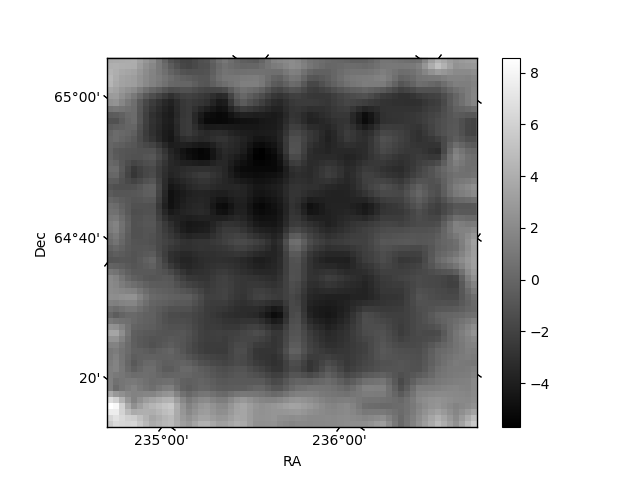
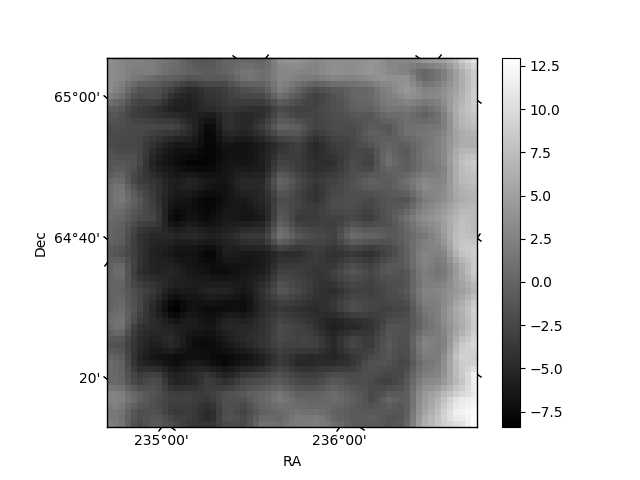
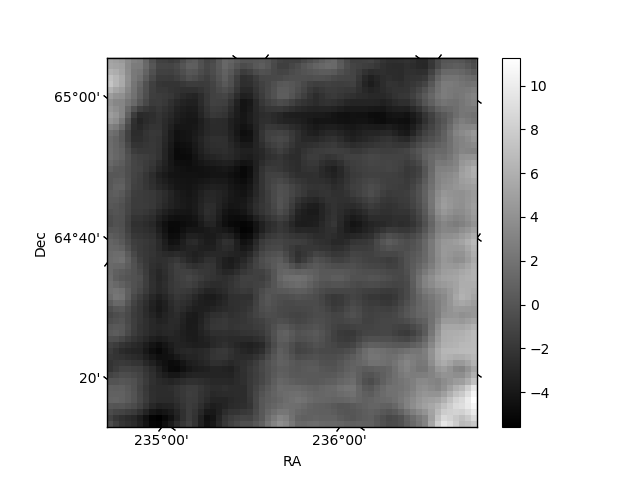
Histogram calculated using DETX and DETY for each event in the final _common_clean file
| Quadrant A | 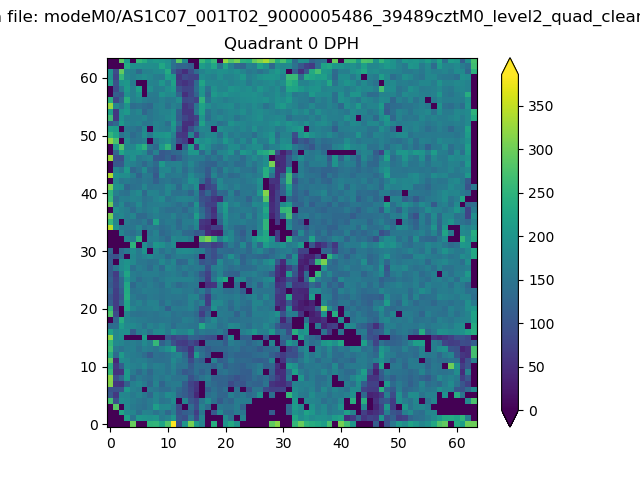 |
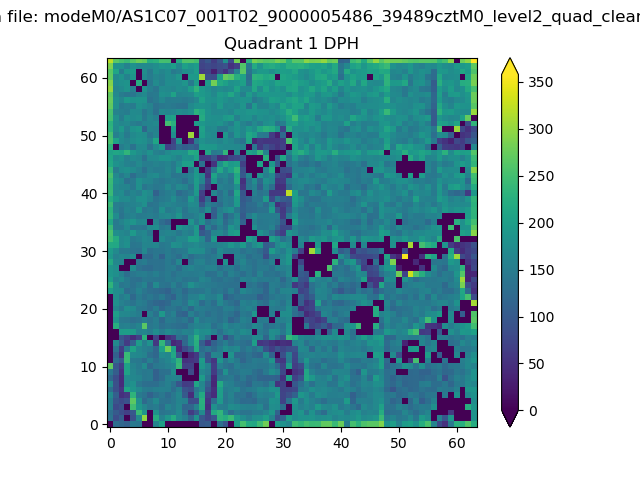 |
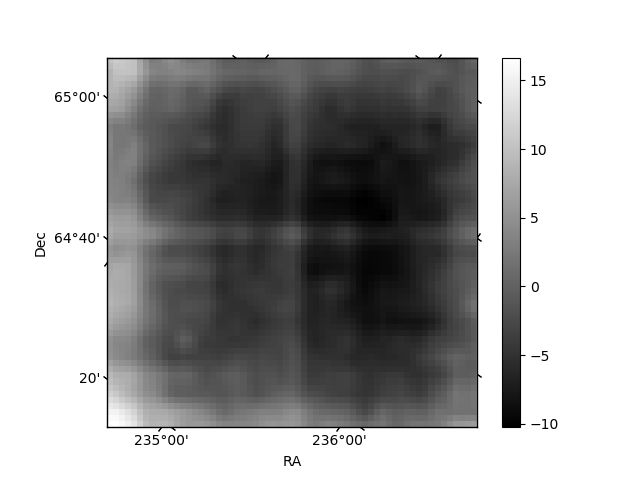
Quadrant B |
|---|---|---|---|
| Quadrant D | 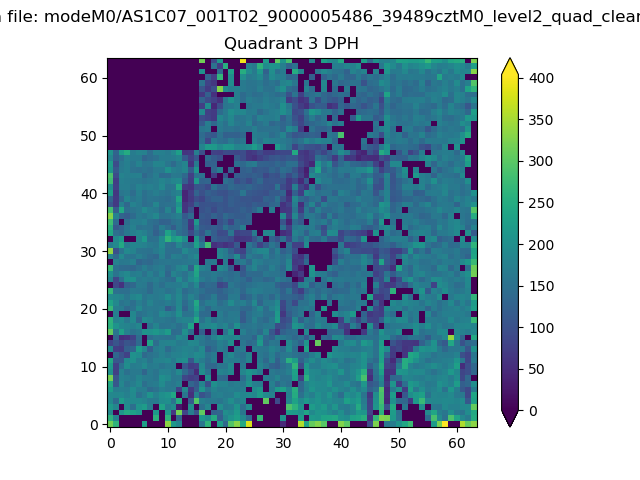 |
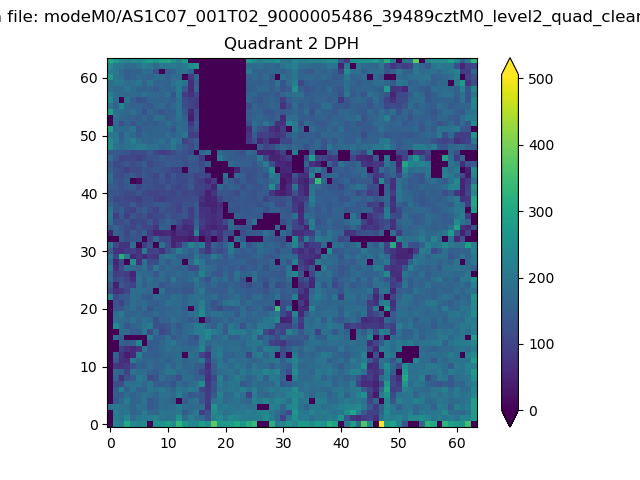 |
Quadrant C |
| Plot type | Count rate plots | Images |
|---|---|---|
| Comparison with Poisson distribution Blue bars denote a histogram of data divided into 1 sec bins. Red curve is a Poisson curve with rate = median count rate of data. |
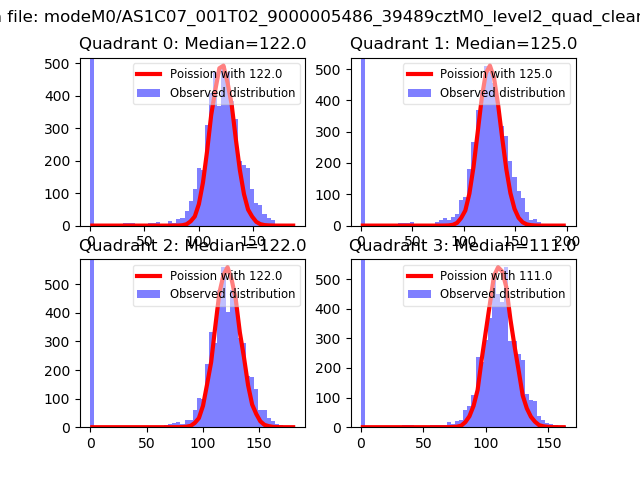 |
 |
| Quadrant-wise count rates Data is divided into 100 sec bins |
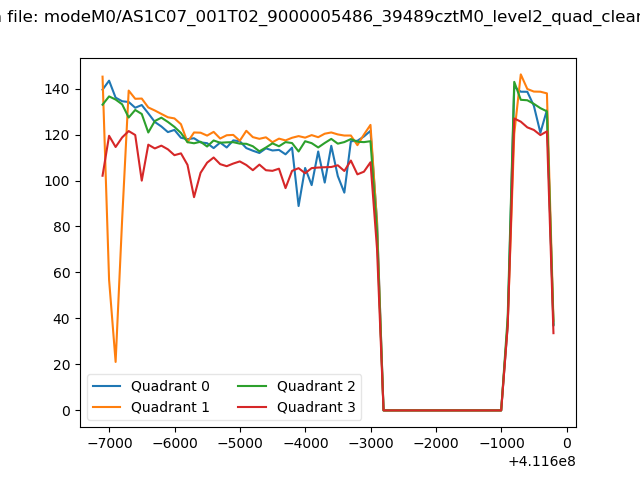 |
|
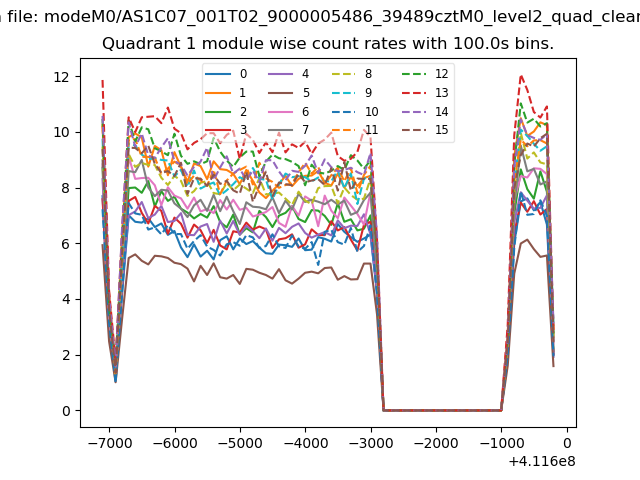
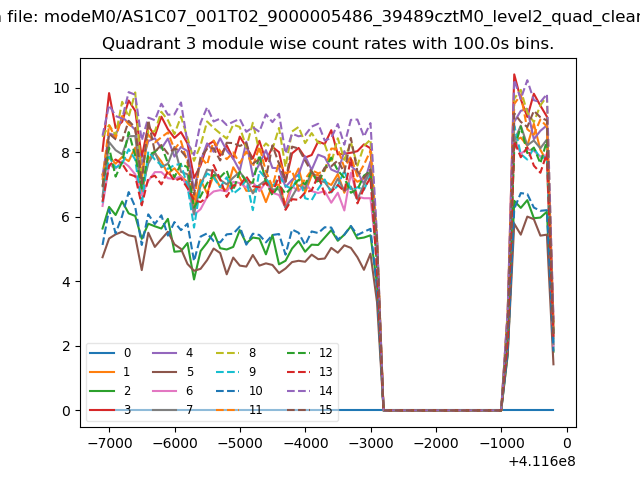
| Module-wise count rates for Quadrant A Data is divided into 100 sec bins |
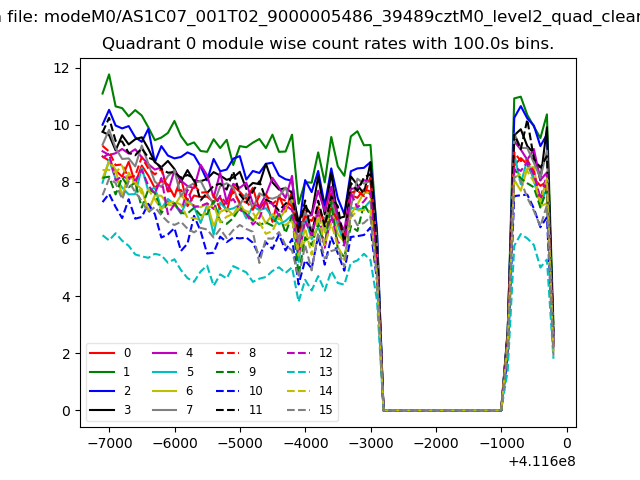 |
 |
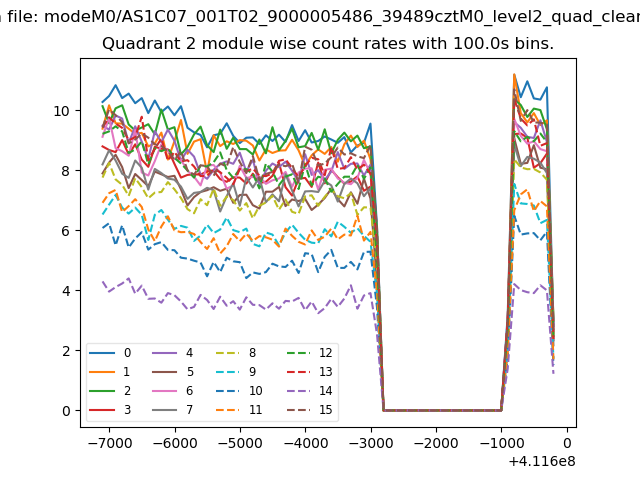
| Module-wise count rates for Quadrant B Data is divided into 100 sec bins |
 |
 |
| Module-wise count rates for Quadrant C Data is divided into 100 sec bins |
 |
 |
| Module-wise count rates for Quadrant D Data is divided into 100 sec bins |
 |
 |
| Parameter | Plot |
|---|---|
| CZT HV Monitor | 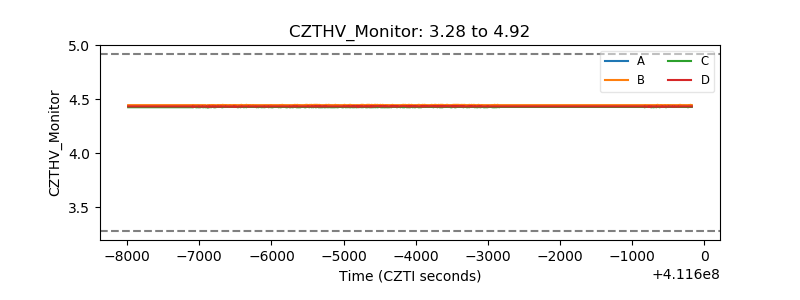 |
| D_VDD | 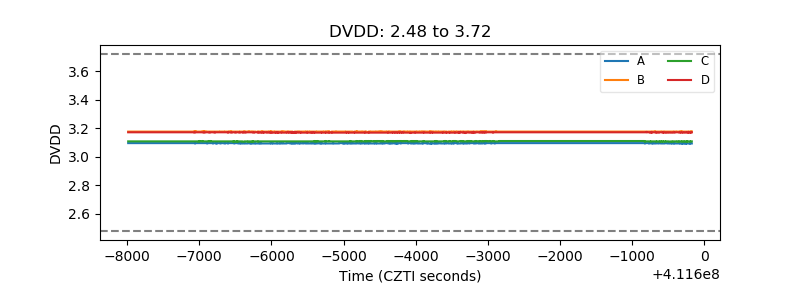 |
| Temperature 1 | 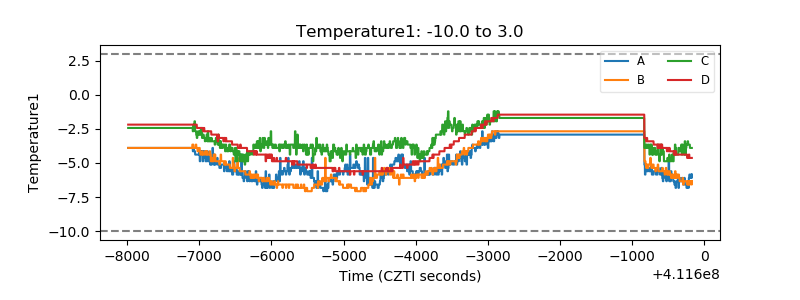 |
| Veto HV Monitor | 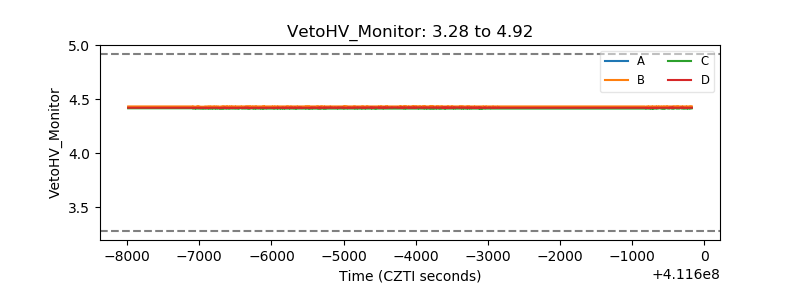 |
| Veto LLD | 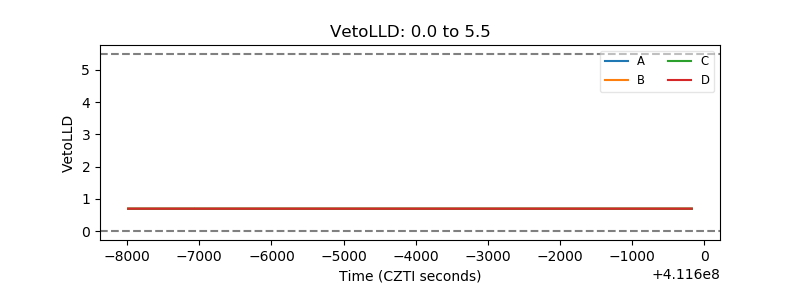 |
| Alpha Counter | 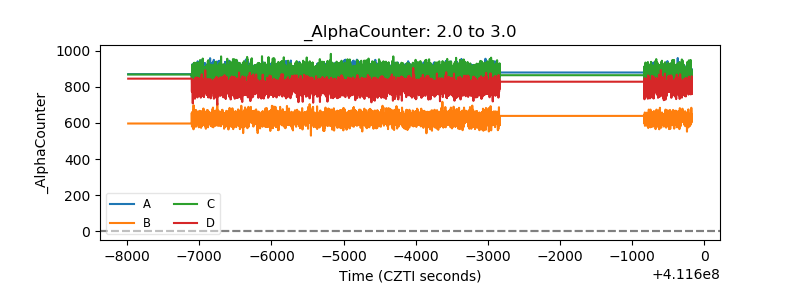 |
| _CPM_Rate | 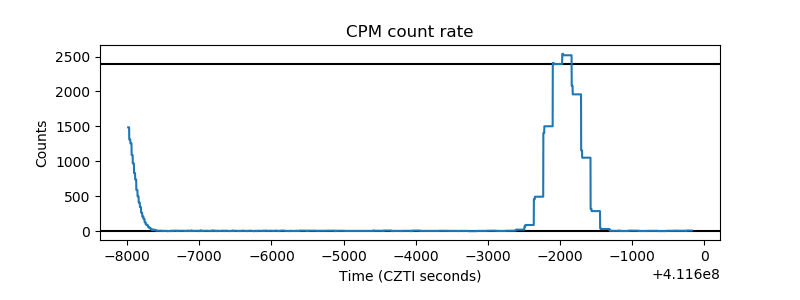 |
| CZT Counter | 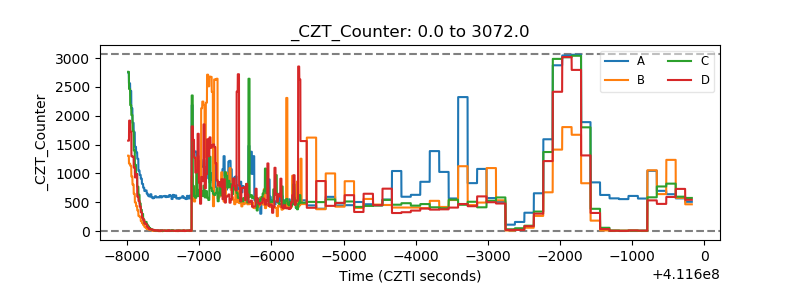 |
| +2.5 Volts monitor | 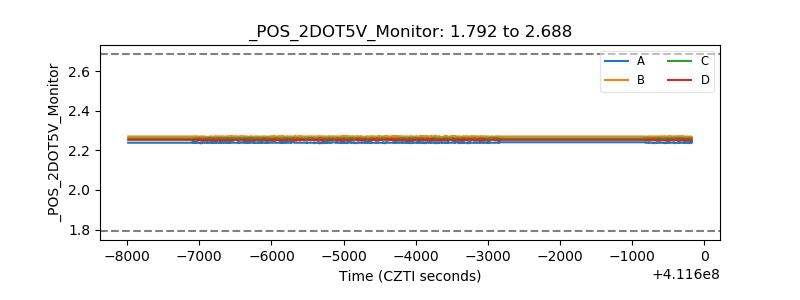 |
| +5 Volts monitor | 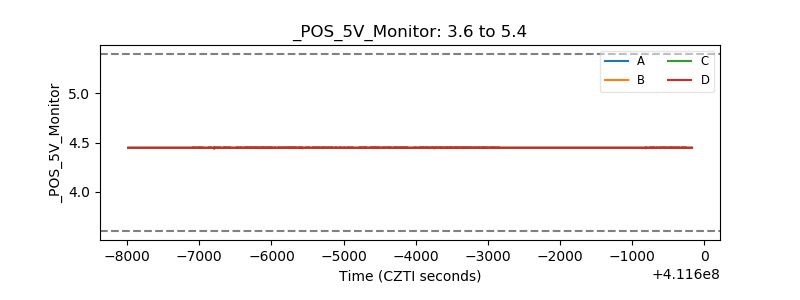 |
| _ROLL_ROT | 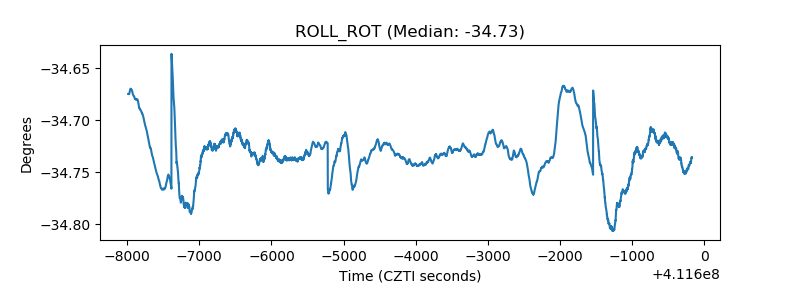 |
| _Roll_DEC | 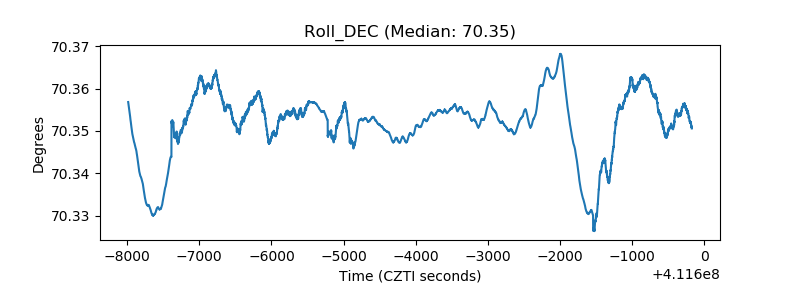 |
| _Roll_RA | 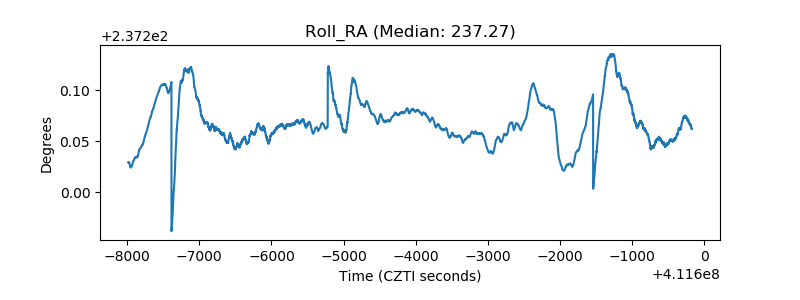 |
| Veto Counter | 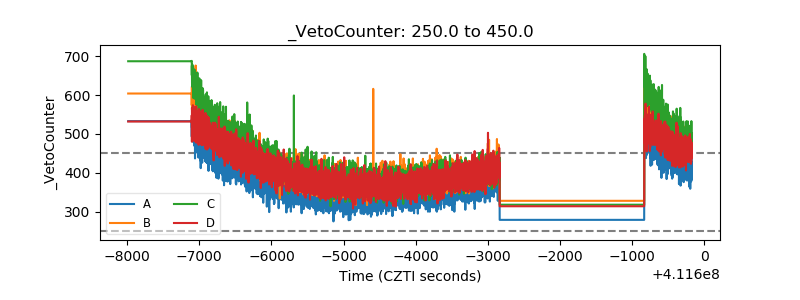 |