| Param | Original file | Final file |
|---|---|---|
| Filename | modeM0/AS1C07_001T02_9000005486_39490cztM0_level2.fits | modeM0/AS1C07_001T02_9000005486_39490cztM0_level2_quad_clean.evt |
| Size (bytes) | 315,452,160 | 88,274,880 |
| Size | 300.8 MB | 84.2 MB |
| Events in quadrant A | 2,986,800 | 589,679 |
| Events in quadrant B | 2,496,338 | 619,431 |
| Events in quadrant C | 2,901,103 | 583,652 |
| Events in quadrant D | 2,911,632 | 537,472 |
| Mode M0 | |||
|---|---|---|---|
| Quadrant | BADHDUFLAG | Total packets | Discarded packets |
| A | 0 | 11876 | 3 |
| B | 0 | 10759 | 2 |
| C | 0 | 11772 | 2 |
| D | 0 | 11967 | 2 |
| Mode M9 | |||
|---|---|---|---|
| Quadrant | BADHDUFLAG | Total packets | Discarded packets |
| A | 0 | 34 | 0 |
| B | 0 | 34 | 0 |
| C | 0 | 34 | 0 |
| D | 0 | 35 | 0 |
| Mode SS | |||
|---|---|---|---|
| Quadrant | BADHDUFLAG | Total packets | Discarded packets |
| A | 0 | 100 | 0 |
| B | 0 | 100 | 0 |
| C | 0 | 100 | 0 |
| D | 0 | 100 | 0 |
| Quadrant | Total seconds | Saturated seconds | Saturation percentage |
|---|---|---|---|
| A | 4889 | 99 | 2.024954% |
| B | 4889 | 60 | 1.227245% |
| C | 4889 | 141 | 2.884025% |
| D | 4889 | 110 | 2.249949% |
Noise dominated data is calculated using 1-second bins in cleaned event files. If a bin has >2000 counts, and if more than 50% of those come from <1% of pixels, then it is considered to be noise-dominated and hence unusable.
| Quadrant | # 1 sec bins | Bins with >0 counts | Bins with >2000 counts | High rate bins dominated by noise | Noise dominated (total time) | Noise dominated (detector-on time) | Marked lightcurve |
|---|---|---|---|---|---|---|---|
| A | 6982 | 4890 | 58 | 58 | 0.83% | 1.19% | 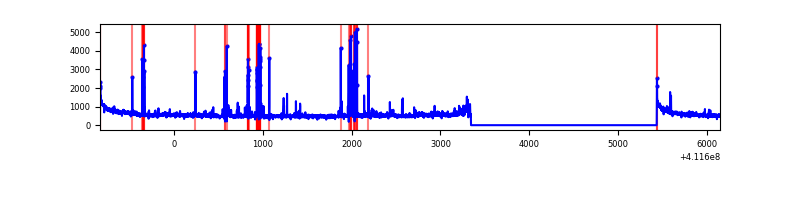 |
| B | 6982 | 4890 | 35 | 35 | 0.50% | 0.72% | 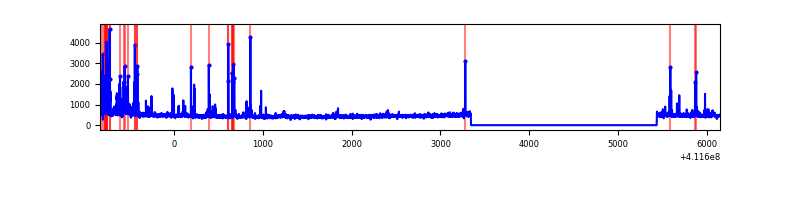 |
| C | 6982 | 4890 | 119 | 119 | 1.70% | 2.43% | 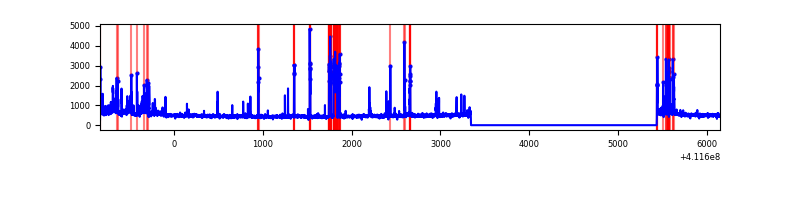 |
| D | 6982 | 4890 | 100 | 100 | 1.43% | 2.04% | 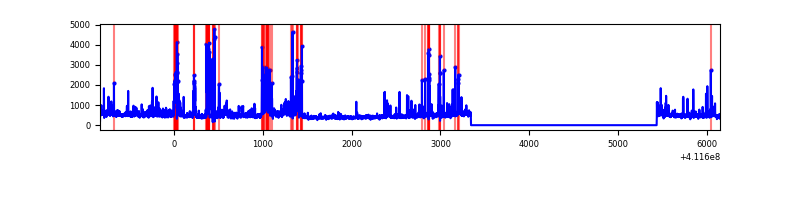 |
Top three noisy pixels from each quadrant. If the there are fewer than three noisy pixels in the level2.evt file, extra rows are filled as -1
| Pixel properties | Quadrant properties | ||||||
|---|---|---|---|---|---|---|---|
| Quadrant | DetID | PixID | Counts | Sigma | Mean | Median | Sigma |
| A | 10 | 83 | 398556 | 3661.09 | 539 | 529 | 108.7 |
| A | 9 | 143 | 239742 | 2200.3 | 539 | 529 | 108.7 |
| A | 15 | 222 | 151073 | 1384.72 | 539 | 529 | 108.7 |
| B | 5 | 255 | 195396 | 1880.92 | 547 | 532 | 103.6 |
| B | 5 | 172 | 135966 | 1307.27 | 547 | 532 | 103.6 |
| B | 12 | 111 | 12723 | 117.67 | 547 | 532 | 103.6 |
| C | 15 | 208 | 463505 | 3760.29 | 536 | 541 | 123.1 |
| C | 15 | 214 | 205279 | 1662.92 | 536 | 541 | 123.1 |
| C | 9 | 187 | 101689 | 821.55 | 536 | 541 | 123.1 |
| D | 2 | 249 | 283702 | 2200.11 | 529 | 514 | 128.7 |
| D | 13 | 249 | 253344 | 1964.26 | 529 | 514 | 128.7 |
| D | 12 | 227 | 236463 | 1833.11 | 529 | 514 | 128.7 |
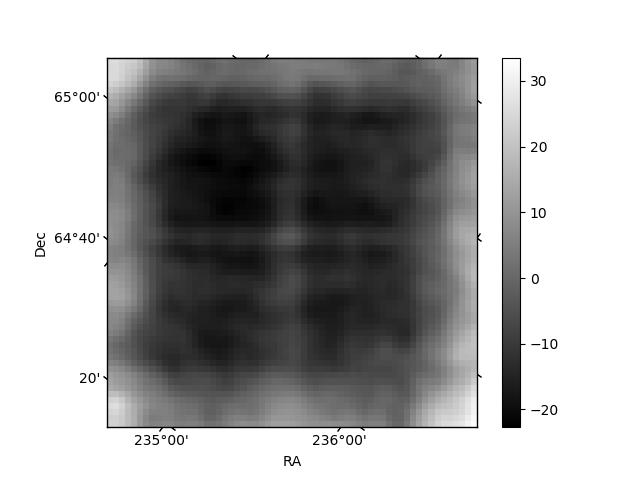
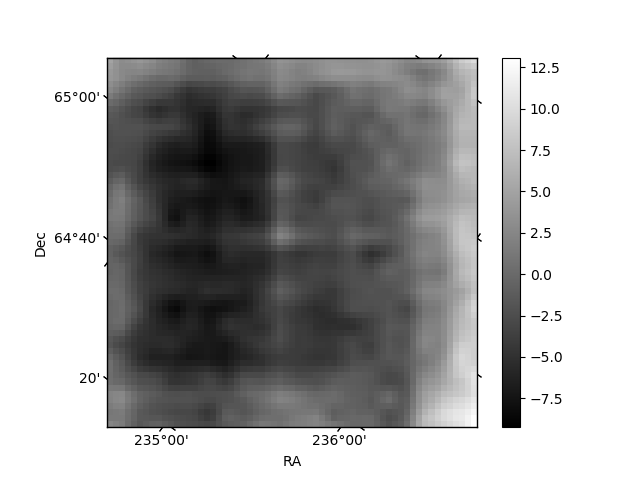
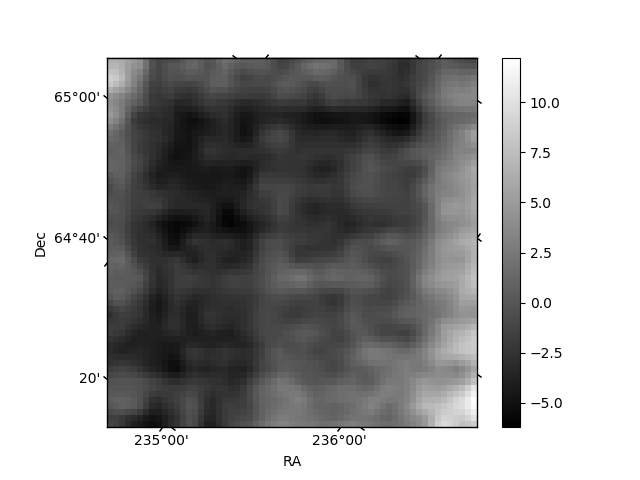
Histogram calculated using DETX and DETY for each event in the final _common_clean file
| Quadrant A | 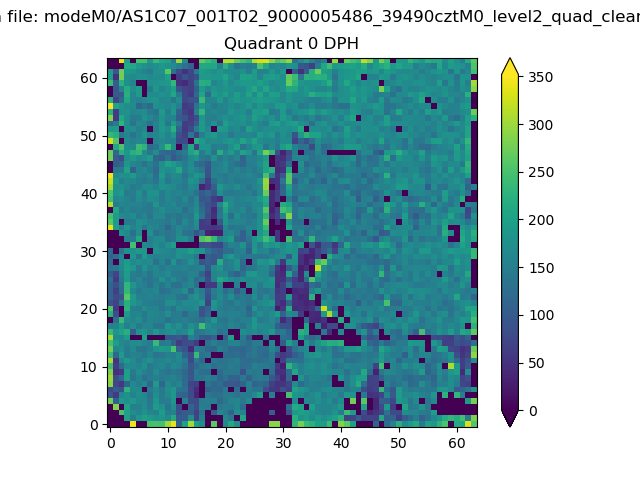 |
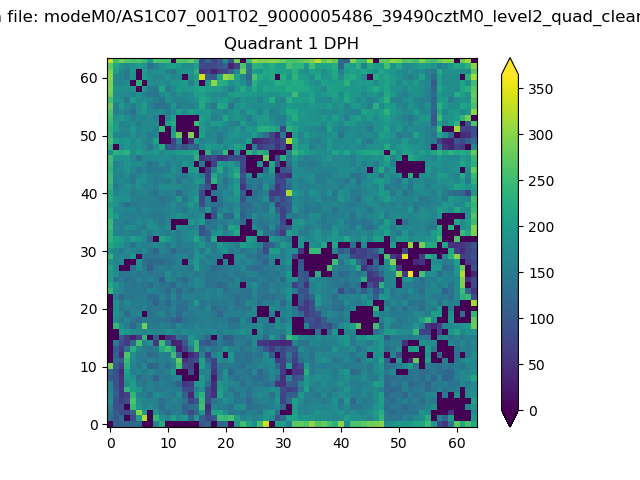 |
Quadrant B |
|---|---|---|---|
| Quadrant D | 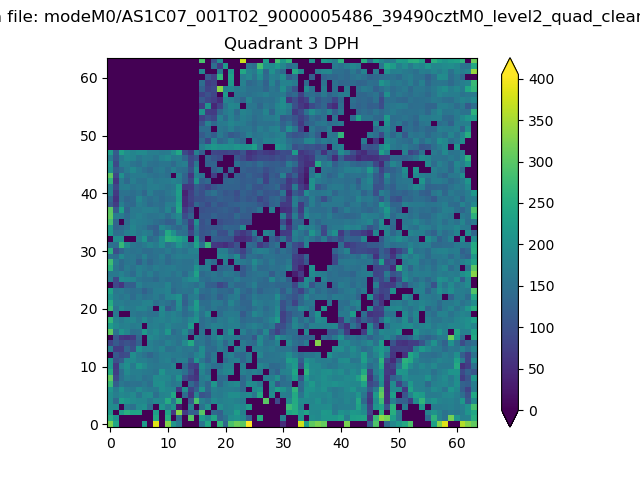 |
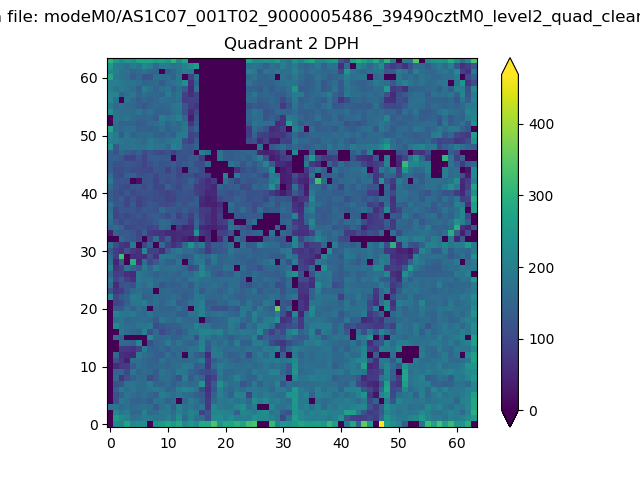 |
Quadrant C |
| Plot type | Count rate plots | Images |
|---|---|---|
| Comparison with Poisson distribution Blue bars denote a histogram of data divided into 1 sec bins. Red curve is a Poisson curve with rate = median count rate of data. |
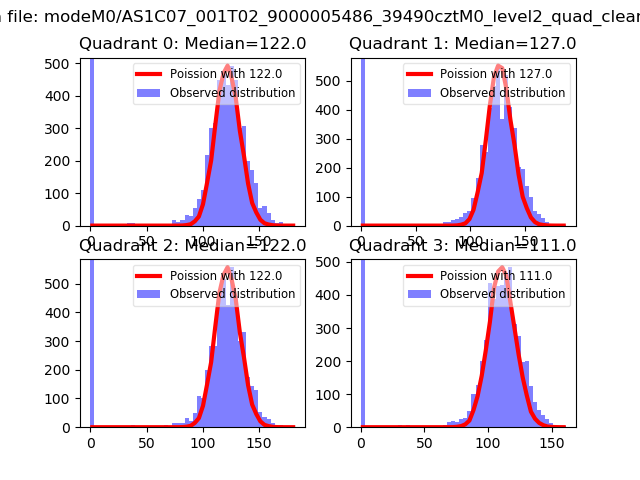 |
 |
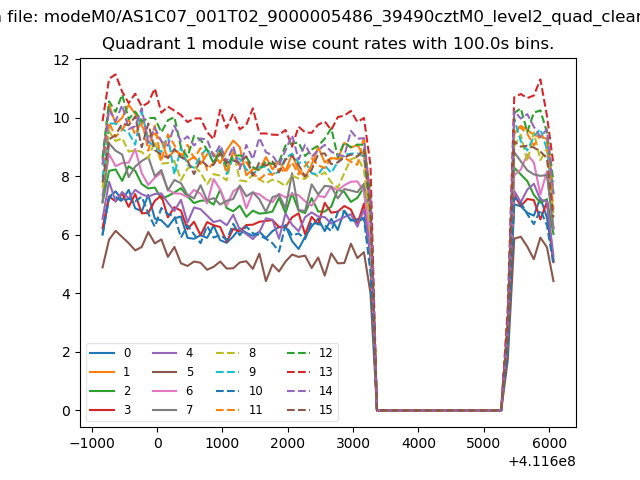
| Quadrant-wise count rates Data is divided into 100 sec bins |
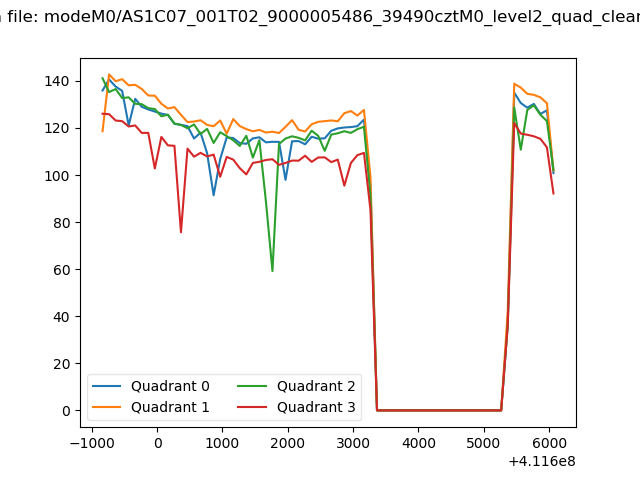 |
|
| Module-wise count rates for Quadrant A Data is divided into 100 sec bins |
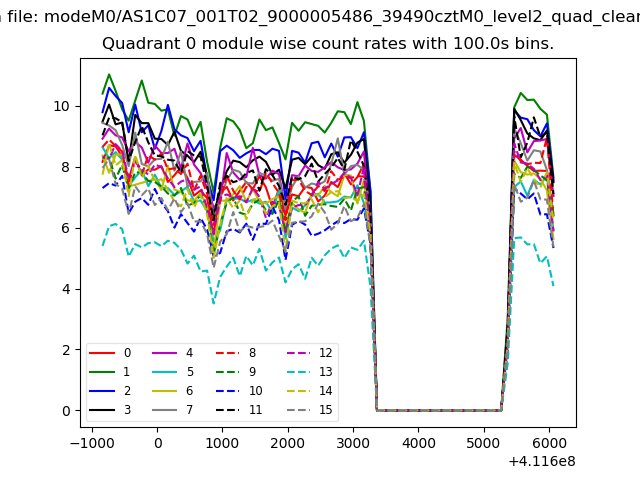 |
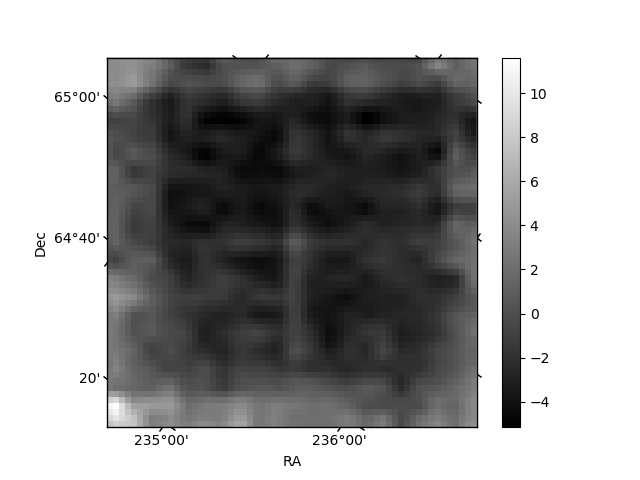 |
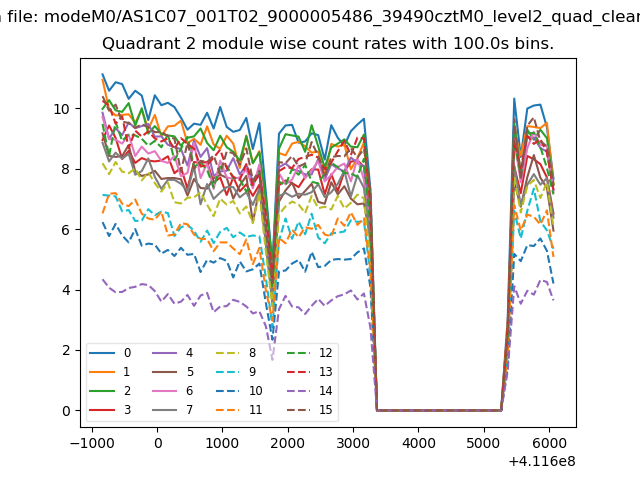
| Module-wise count rates for Quadrant B Data is divided into 100 sec bins |
 |
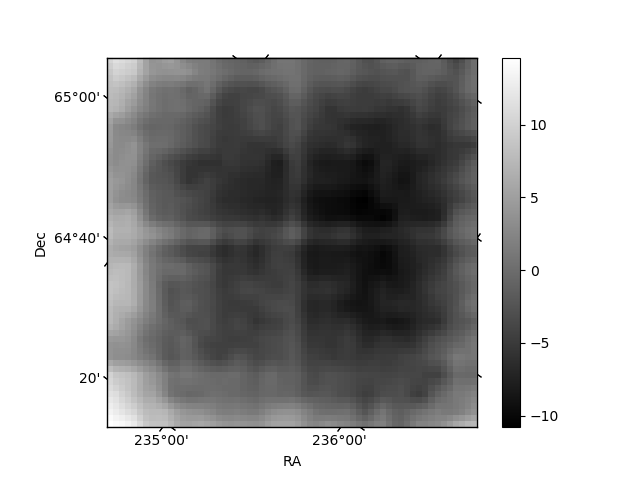 |
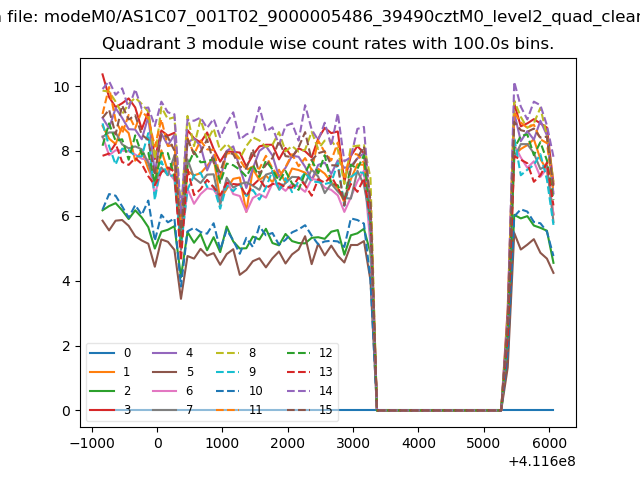
| Module-wise count rates for Quadrant C Data is divided into 100 sec bins |
 |
 |
| Module-wise count rates for Quadrant D Data is divided into 100 sec bins |
 |
 |
| Parameter | Plot |
|---|---|
| CZT HV Monitor | 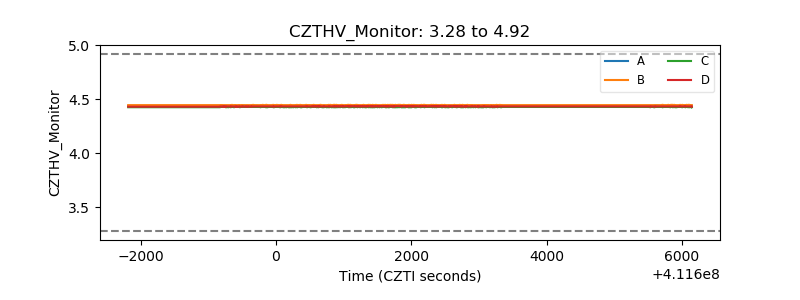 |
| D_VDD | 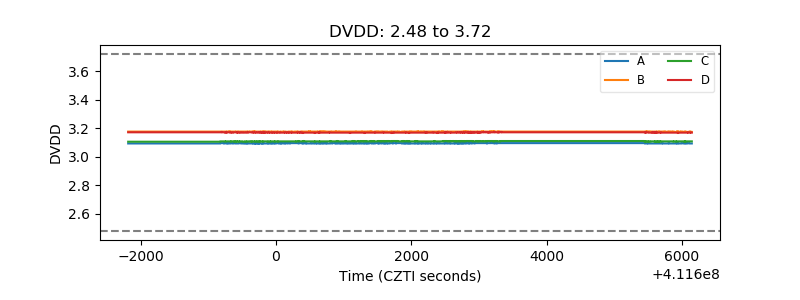 |
| Temperature 1 | 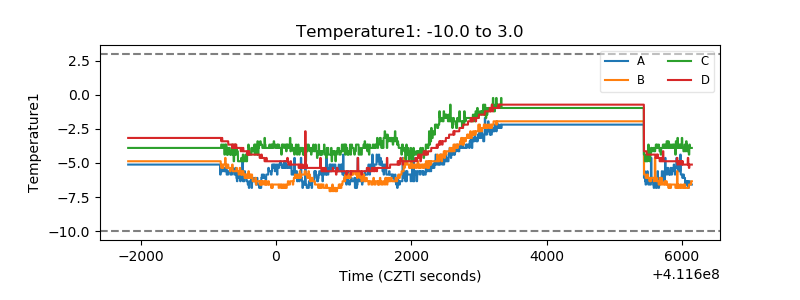 |
| Veto HV Monitor | 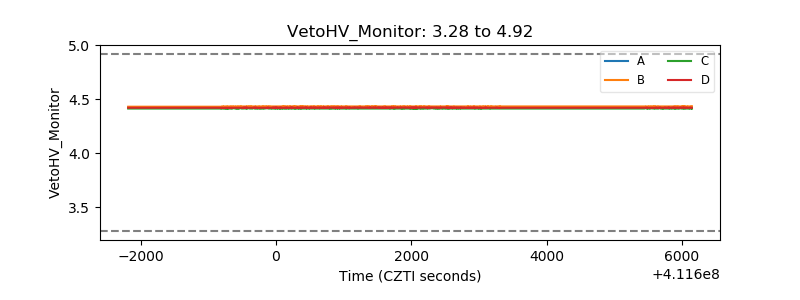 |
| Veto LLD | 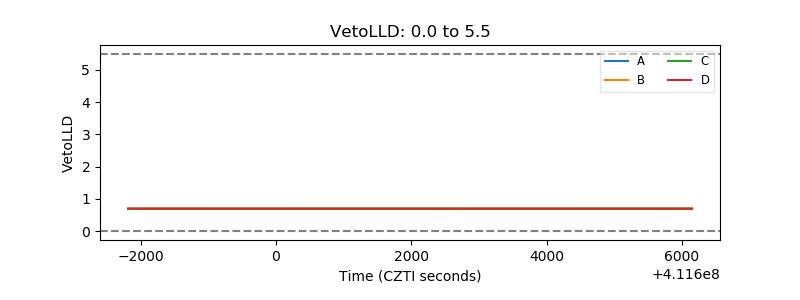 |
| Alpha Counter | 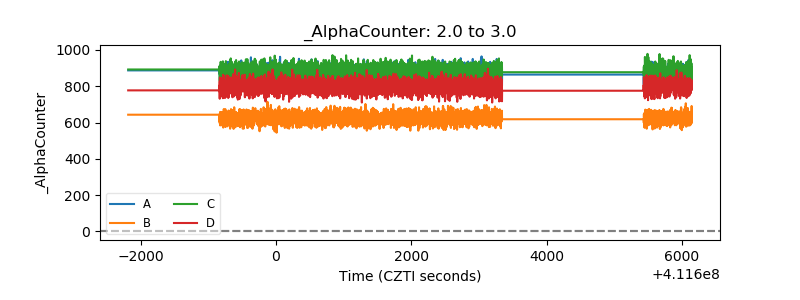 |
| _CPM_Rate | 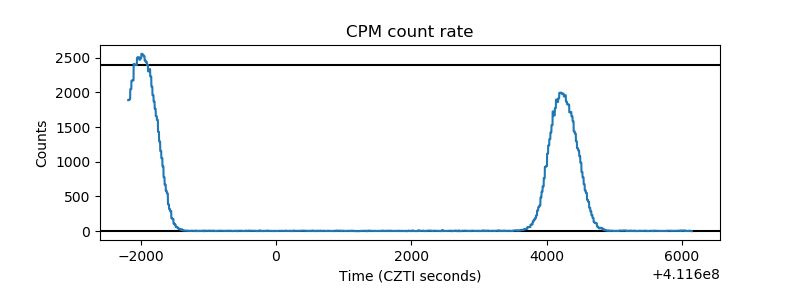 |
| CZT Counter | 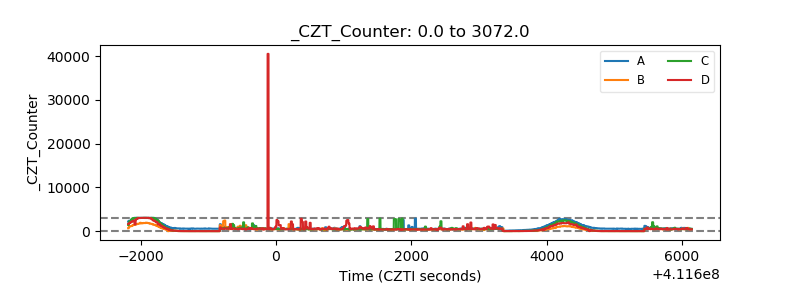 |
| +2.5 Volts monitor | 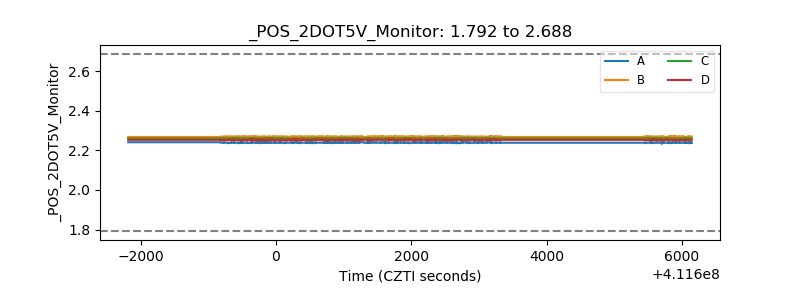 |
| +5 Volts monitor | 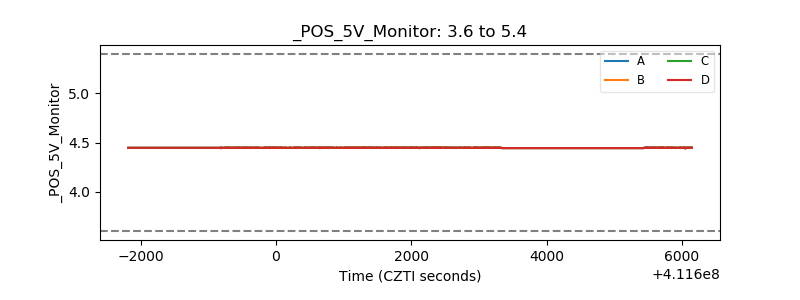 |
| _ROLL_ROT | 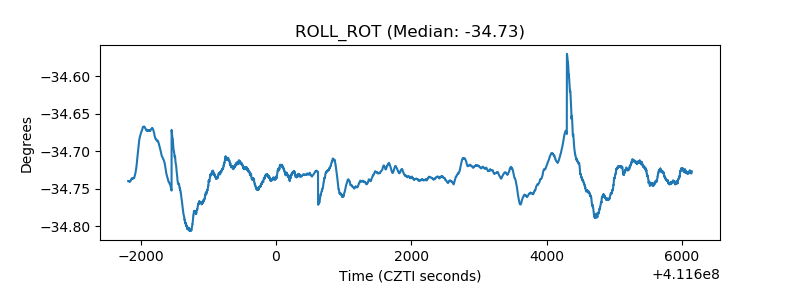 |
| _Roll_DEC | 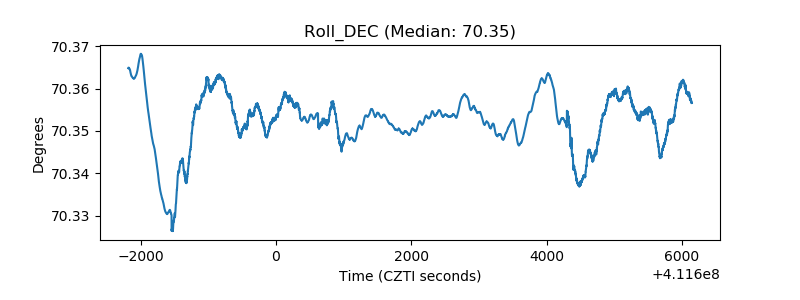 |
| _Roll_RA | 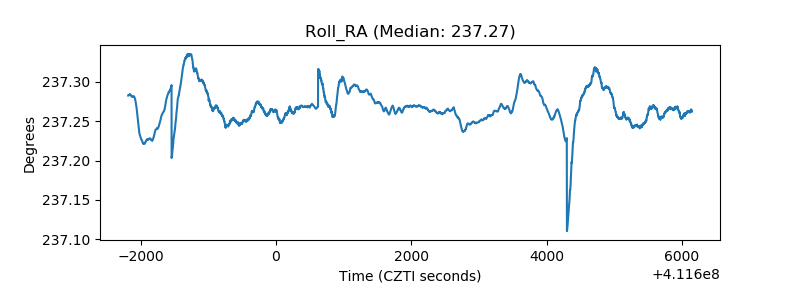 |
| Veto Counter | 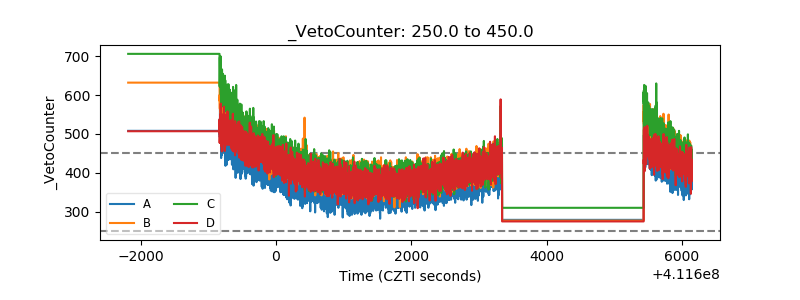 |