| Param | Original file | Final file |
|---|---|---|
| Filename | modeM0/AS1C07_001T02_9000005486_39491cztM0_level2.fits | modeM0/AS1C07_001T02_9000005486_39491cztM0_level2_quad_clean.evt |
| Size (bytes) | 1,134,993,600 | 302,042,880 |
| Size | 1.1 GB | 288.1 MB |
| Events in quadrant A | 10,700,926 | 2,026,609 |
| Events in quadrant B | 9,173,388 | 2,087,437 |
| Events in quadrant C | 9,721,991 | 2,022,777 |
| Events in quadrant D | 11,074,839 | 1,813,246 |
| Mode M0 | |||
|---|---|---|---|
| Quadrant | BADHDUFLAG | Total packets | Discarded packets |
| A | 0 | 42767 | 5 |
| B | 0 | 39459 | 4 |
| C | 0 | 40311 | 4 |
| D | 0 | 45267 | 4 |
| Mode M9 | |||
|---|---|---|---|
| Quadrant | BADHDUFLAG | Total packets | Discarded packets |
| A | 0 | 81 | 0 |
| B | 0 | 81 | 0 |
| C | 0 | 81 | 0 |
| D | 0 | 81 | 0 |
| Mode SS | |||
|---|---|---|---|
| Quadrant | BADHDUFLAG | Total packets | Discarded packets |
| A | 0 | 356 | 0 |
| B | 0 | 356 | 0 |
| C | 0 | 356 | 0 |
| D | 0 | 356 | 0 |
| Quadrant | Total seconds | Saturated seconds | Saturation percentage |
|---|---|---|---|
| A | 17347 | 281 | 1.619877% |
| B | 17347 | 420 | 2.421168% |
| C | 17347 | 213 | 1.227878% |
| D | 17347 | 608 | 3.504929% |
Noise dominated data is calculated using 1-second bins in cleaned event files. If a bin has >2000 counts, and if more than 50% of those come from <1% of pixels, then it is considered to be noise-dominated and hence unusable.
| Quadrant | # 1 sec bins | Bins with >0 counts | Bins with >2000 counts | High rate bins dominated by noise | Noise dominated (total time) | Noise dominated (detector-on time) | Marked lightcurve |
|---|---|---|---|---|---|---|---|
| A | 25478 | 17351 | 207 | 207 | 0.81% | 1.19% | 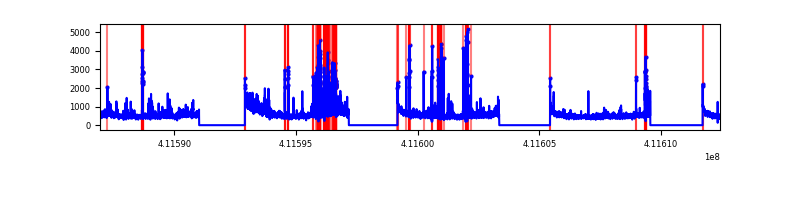 |
| B | 25478 | 17351 | 300 | 300 | 1.18% | 1.73% | 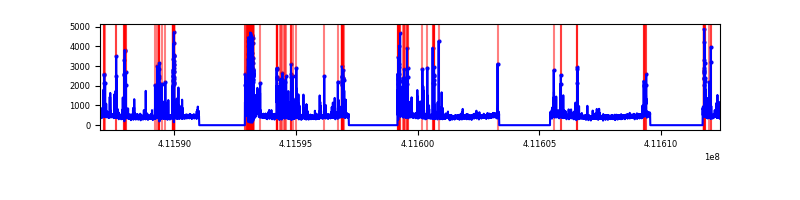 |
| C | 25478 | 17351 | 175 | 175 | 0.69% | 1.01% | 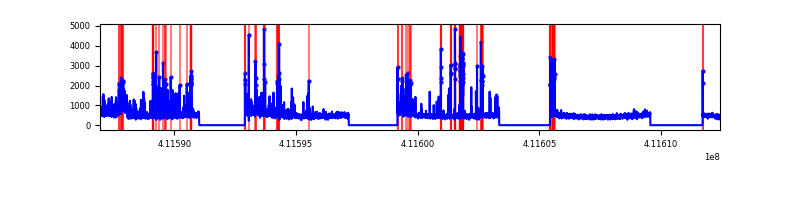 |
| D | 25478 | 17351 | 547 | 547 | 2.15% | 3.15% | 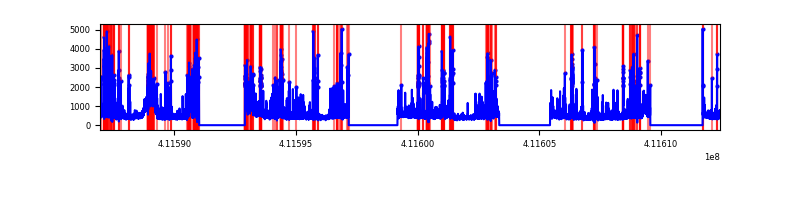 |
Top three noisy pixels from each quadrant. If the there are fewer than three noisy pixels in the level2.evt file, extra rows are filled as -1
| Pixel properties | Quadrant properties | ||||||
|---|---|---|---|---|---|---|---|
| Quadrant | DetID | PixID | Counts | Sigma | Mean | Median | Sigma |
| A | 10 | 83 | 1178592 | 3129.72 | 1886 | 1854 | 376.0 |
| A | 15 | 174 | 789244 | 2094.19 | 1886 | 1854 | 376.0 |
| A | 15 | 222 | 544199 | 1442.45 | 1886 | 1854 | 376.0 |
| B | 5 | 172 | 1346646 | 3812.57 | 1886 | 1832 | 352.7 |
| B | 5 | 255 | 393933 | 1111.61 | 1886 | 1832 | 352.7 |
| B | 12 | 111 | 44119 | 119.88 | 1886 | 1832 | 352.7 |
| C | 15 | 208 | 1118604 | 2629.88 | 1866 | 1884 | 424.6 |
| C | 15 | 214 | 715668 | 1680.96 | 1866 | 1884 | 424.6 |
| C | 9 | 187 | 537010 | 1260.22 | 1866 | 1884 | 424.6 |
| D | 12 | 0 | 1642128 | 3760.15 | 1826 | 1780 | 436.2 |
| D | 13 | 249 | 874466 | 2000.45 | 1826 | 1780 | 436.2 |
| D | 2 | 249 | 779090 | 1781.82 | 1826 | 1780 | 436.2 |
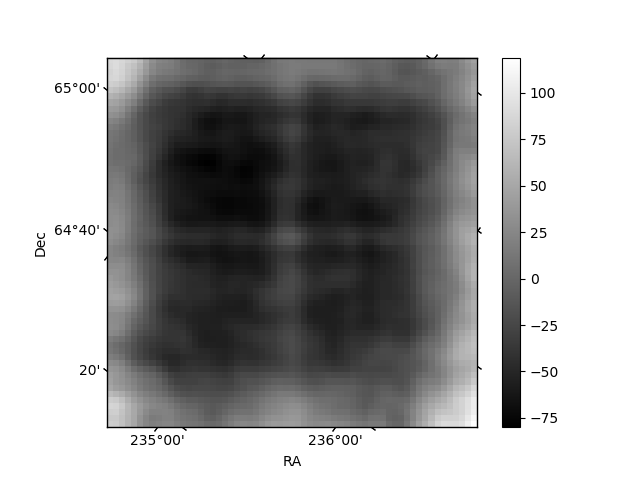
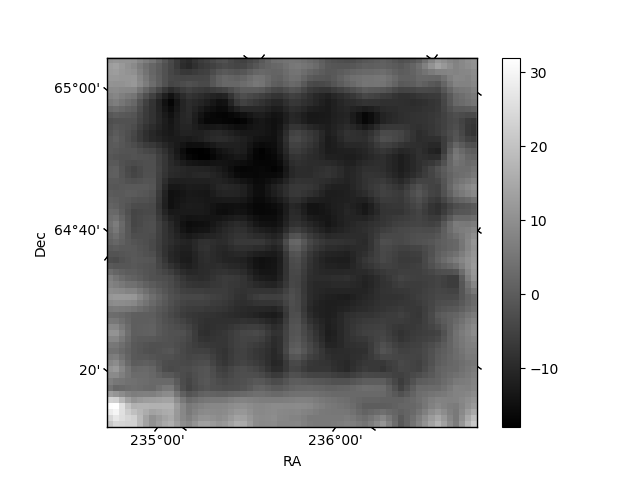
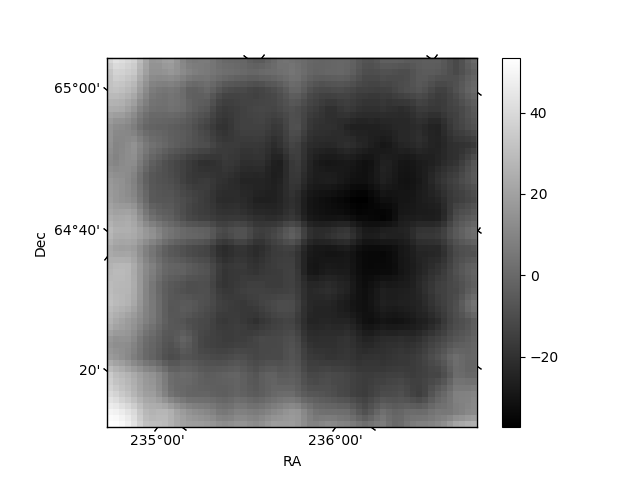
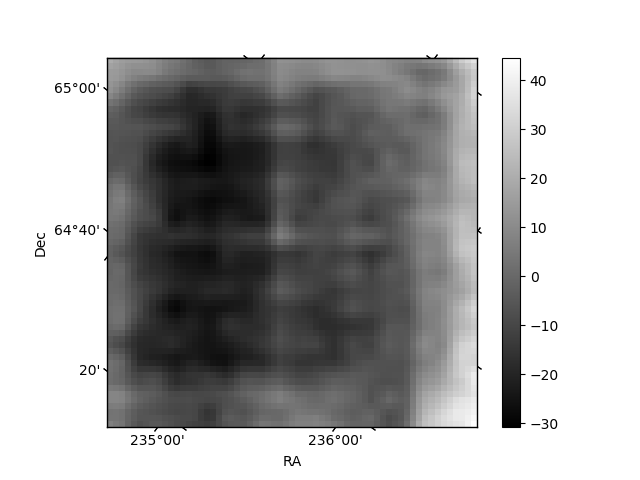
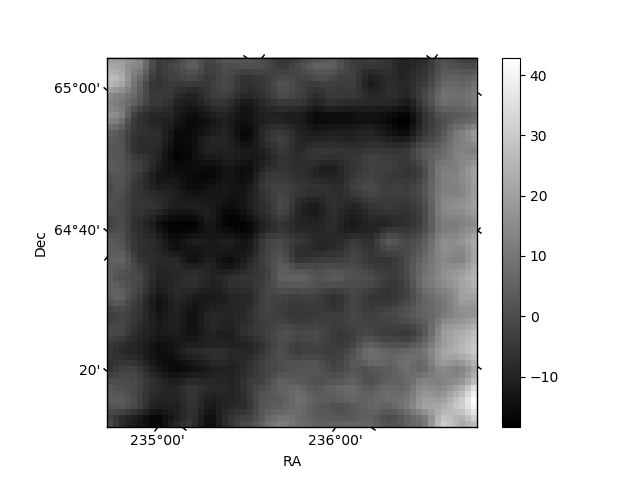
Histogram calculated using DETX and DETY for each event in the final _common_clean file
| Quadrant A | 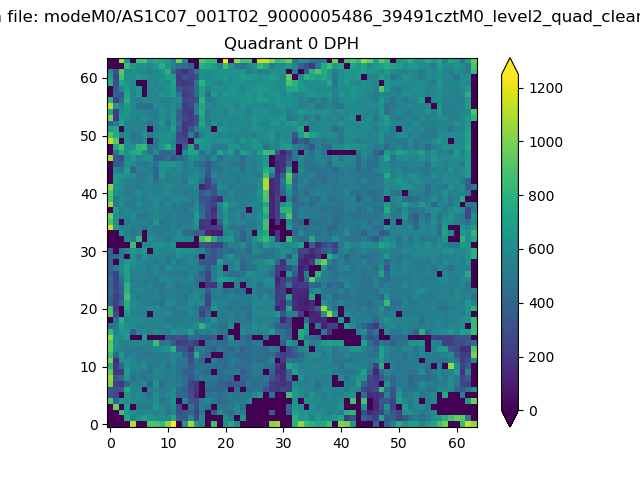 |
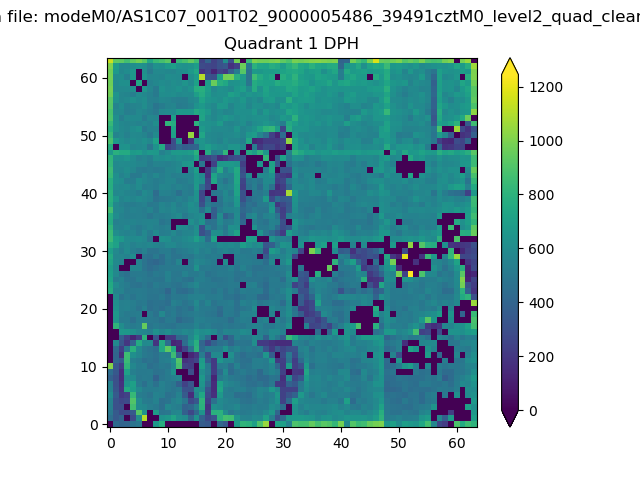 |
Quadrant B |
|---|---|---|---|
| Quadrant D | 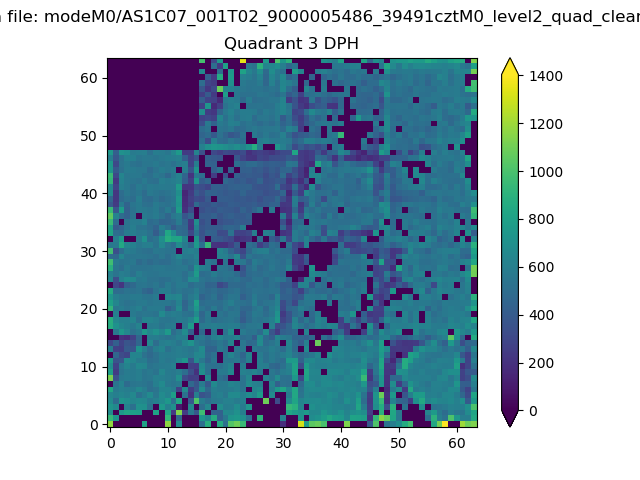 |
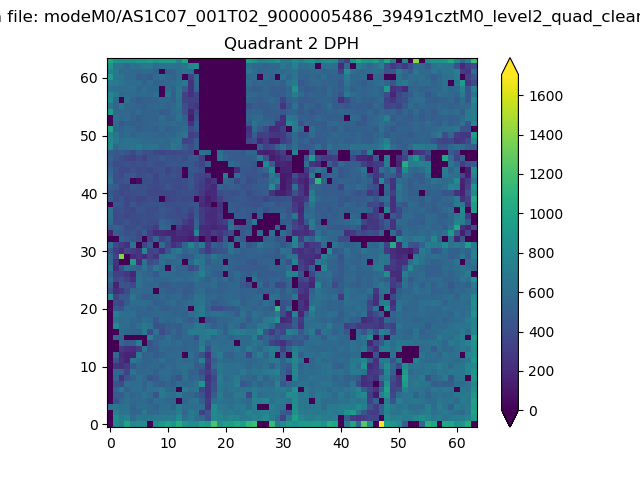 |
Quadrant C |
| Plot type | Count rate plots | Images |
|---|---|---|
| Comparison with Poisson distribution Blue bars denote a histogram of data divided into 1 sec bins. Red curve is a Poisson curve with rate = median count rate of data. |
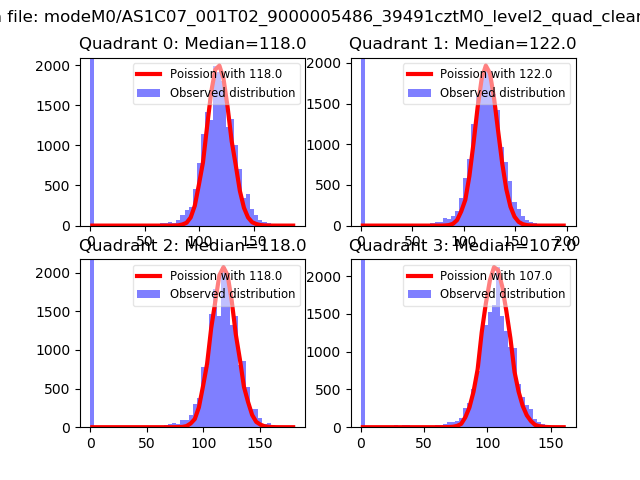 |
 |
| Quadrant-wise count rates Data is divided into 100 sec bins |
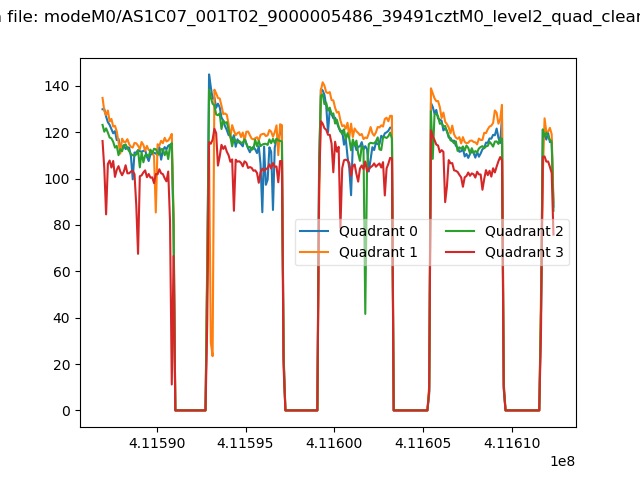 |
|
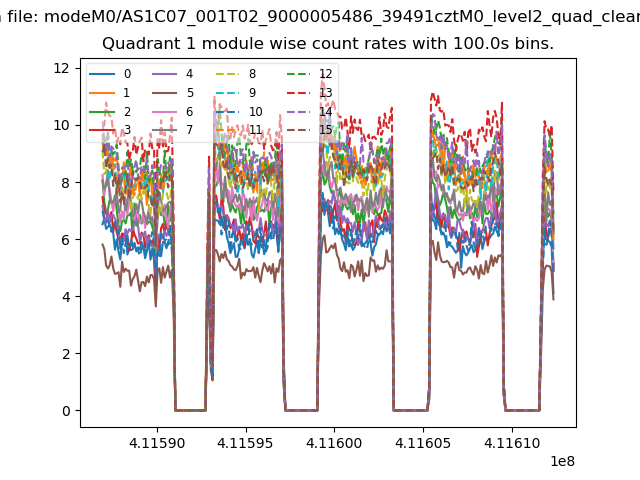
| Module-wise count rates for Quadrant A Data is divided into 100 sec bins |
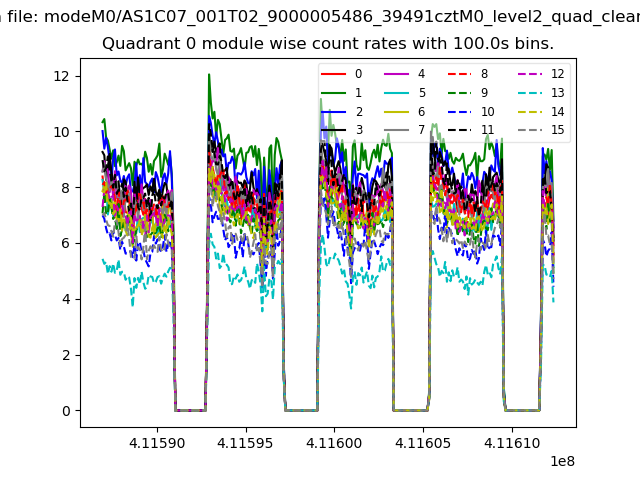 |
 |
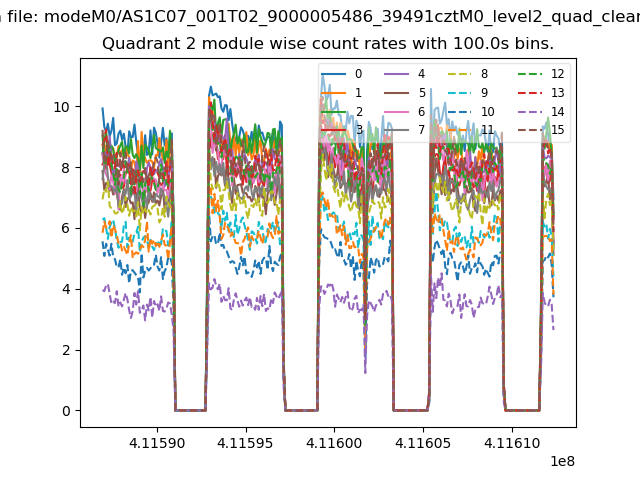
| Module-wise count rates for Quadrant B Data is divided into 100 sec bins |
 |
 |
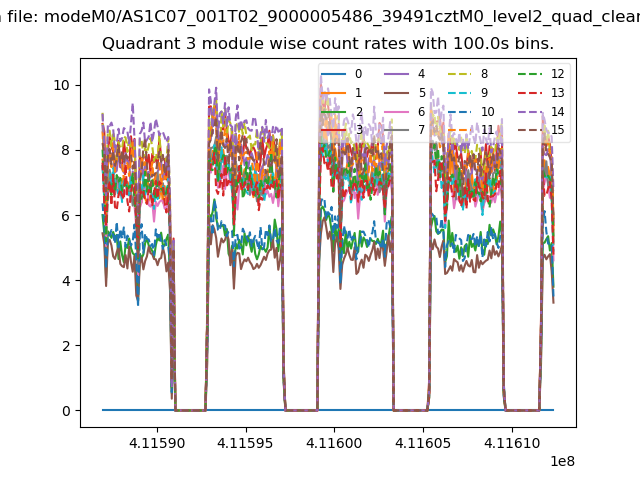
| Module-wise count rates for Quadrant C Data is divided into 100 sec bins |
 |
 |
| Module-wise count rates for Quadrant D Data is divided into 100 sec bins |
 |
 |
| Parameter | Plot |
|---|---|
| CZT HV Monitor | 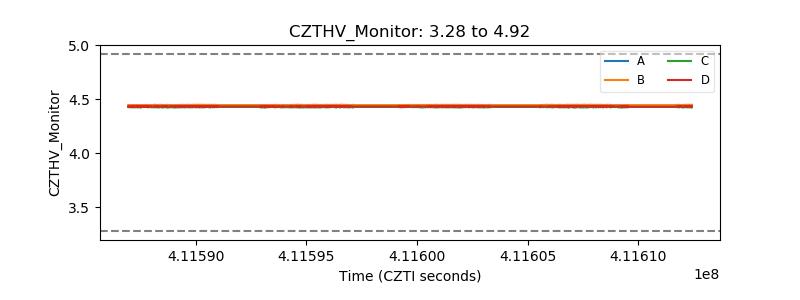 |
| D_VDD | 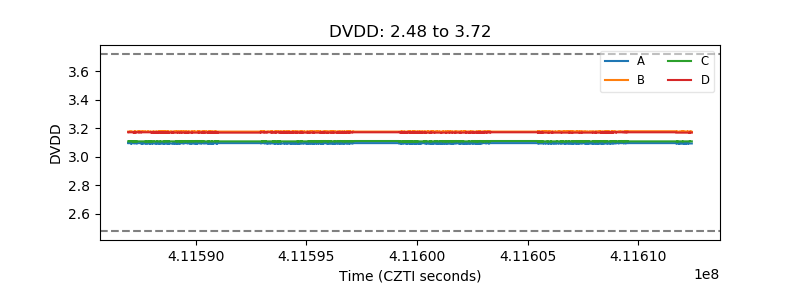 |
| Temperature 1 | 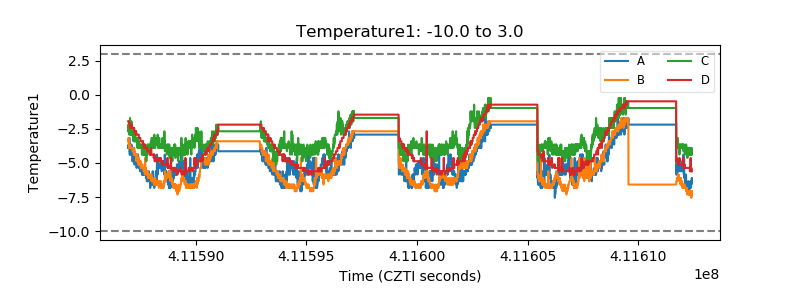 |
| Veto HV Monitor | 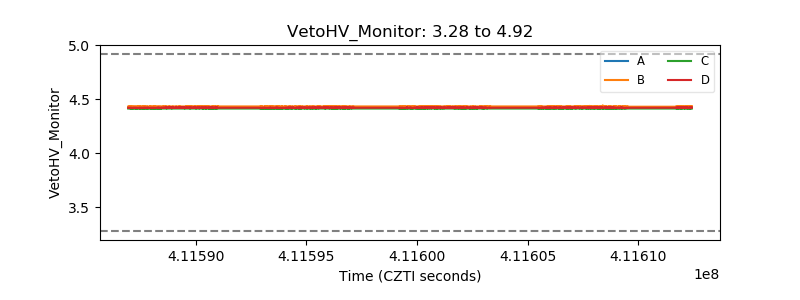 |
| Veto LLD | 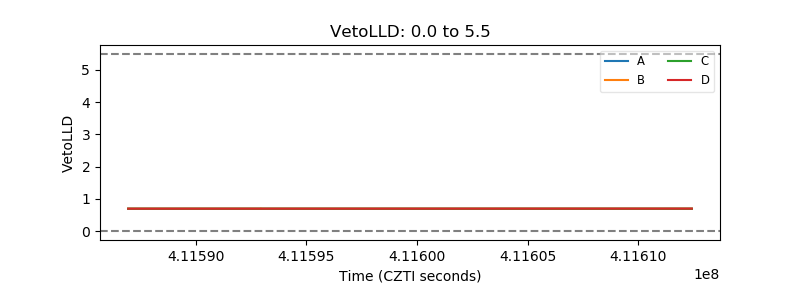 |
| Alpha Counter | 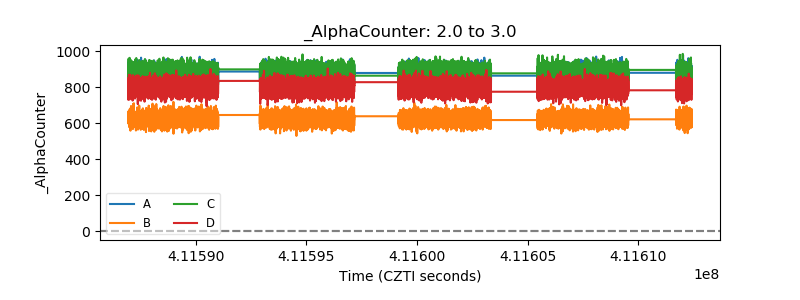 |
| _CPM_Rate | 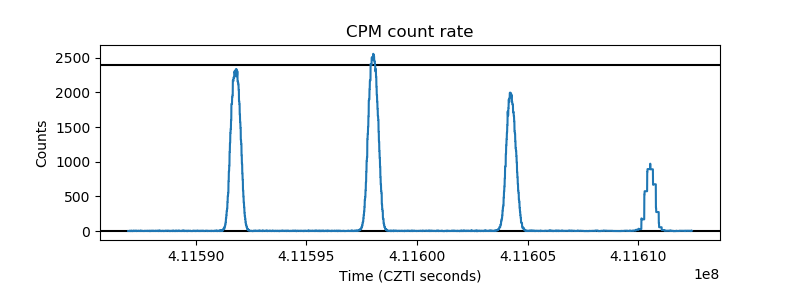 |
| CZT Counter | 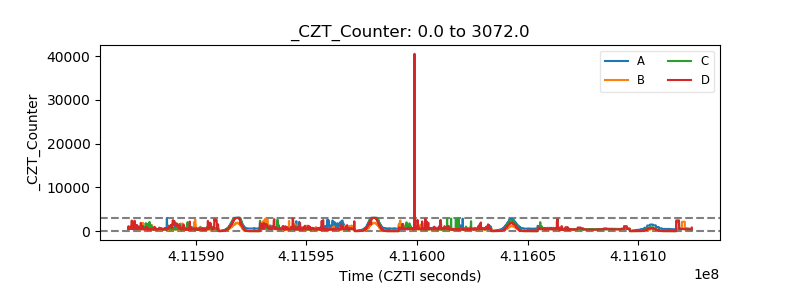 |
| +2.5 Volts monitor |  |
| +5 Volts monitor | 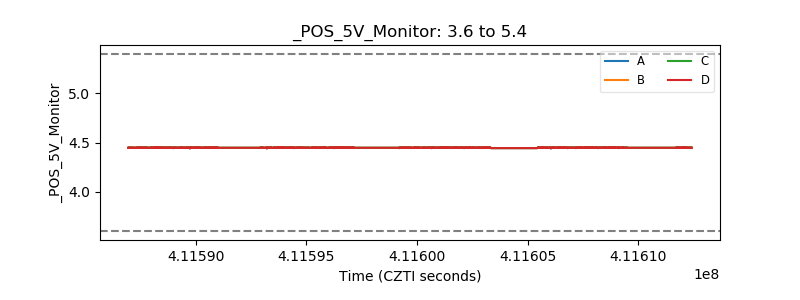 |
| _ROLL_ROT | 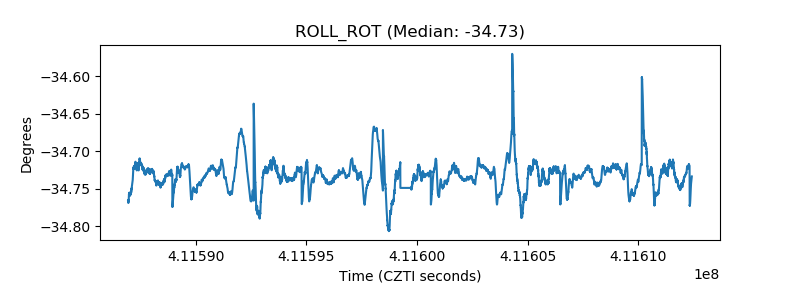 |
| _Roll_DEC | 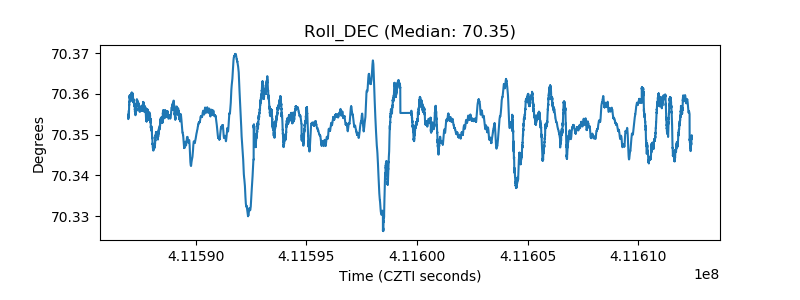 |
| _Roll_RA | 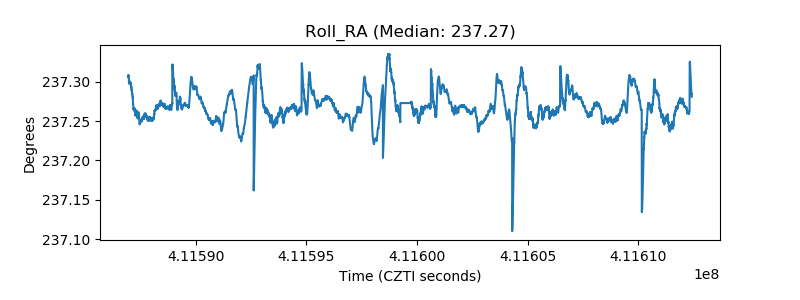 |
| Veto Counter | 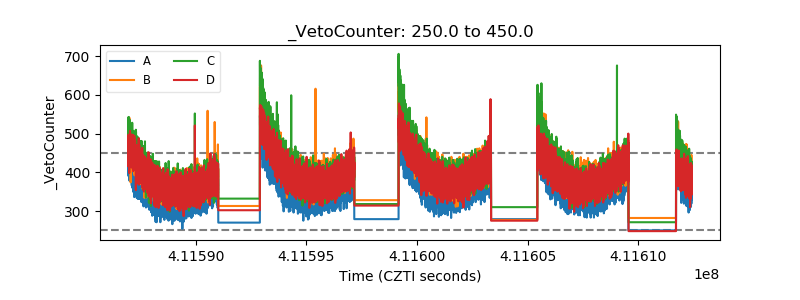 |