| Param | Original file | Final file |
|---|---|---|
| Filename | modeM0/AS1C07_001T02_9000005486_39492cztM0_level2.fits | modeM0/AS1C07_001T02_9000005486_39492cztM0_level2_quad_clean.evt |
| Size (bytes) | 368,925,120 | 86,394,240 |
| Size | 351.8 MB | 82.4 MB |
| Events in quadrant A | 2,654,054 | 586,667 |
| Events in quadrant B | 3,323,057 | 598,800 |
| Events in quadrant C | 2,399,002 | 581,213 |
| Events in quadrant D | 4,874,740 | 484,522 |
| Mode M0 | |||
|---|---|---|---|
| Quadrant | BADHDUFLAG | Total packets | Discarded packets |
| A | 0 | 11227 | 3 |
| B | 0 | 13678 | 2 |
| C | 0 | 10602 | 2 |
| D | 0 | 18263 | 2 |
| Mode M9 | |||
|---|---|---|---|
| Quadrant | BADHDUFLAG | Total packets | Discarded packets |
| A | 0 | 37 | 0 |
| B | 0 | 37 | 0 |
| C | 0 | 37 | 0 |
| D | 0 | 38 | 0 |
| Mode SS | |||
|---|---|---|---|
| Quadrant | BADHDUFLAG | Total packets | Discarded packets |
| A | 0 | 106 | 0 |
| B | 0 | 106 | 0 |
| C | 0 | 106 | 0 |
| D | 0 | 106 | 0 |
| Quadrant | Total seconds | Saturated seconds | Saturation percentage |
|---|---|---|---|
| A | 5209 | 6 | 0.115185% |
| B | 5209 | 160 | 3.071607% |
| C | 5209 | 5 | 0.095988% |
| D | 5209 | 592 | 11.364945% |
Noise dominated data is calculated using 1-second bins in cleaned event files. If a bin has >2000 counts, and if more than 50% of those come from <1% of pixels, then it is considered to be noise-dominated and hence unusable.
| Quadrant | # 1 sec bins | Bins with >0 counts | Bins with >2000 counts | High rate bins dominated by noise | Noise dominated (total time) | Noise dominated (detector-on time) | Marked lightcurve |
|---|---|---|---|---|---|---|---|
| A | 7303 | 5210 | 3 | 3 | 0.04% | 0.06% | 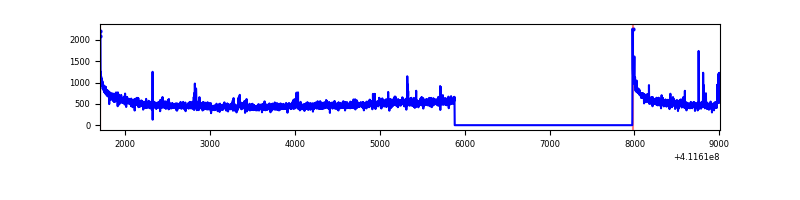 |
| B | 7303 | 5210 | 79 | 79 | 1.08% | 1.52% | 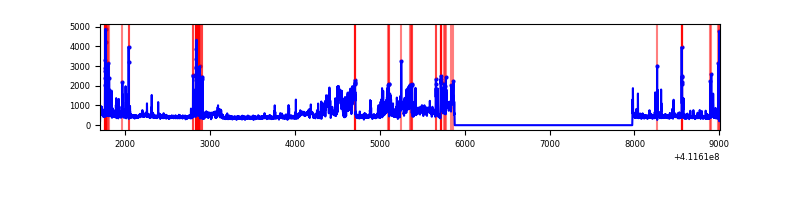 |
| C | 7303 | 5210 | 2 | 2 | 0.03% | 0.04% | 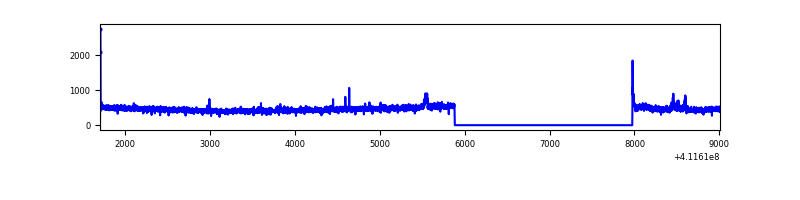 |
| D | 7303 | 5210 | 421 | 421 | 5.76% | 8.08% | 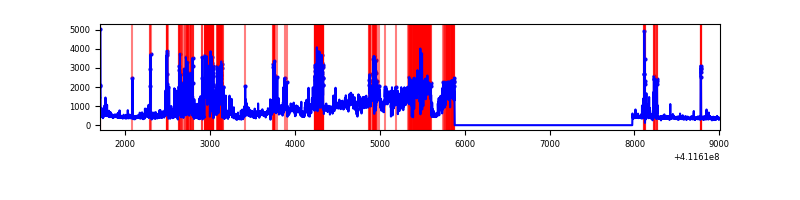 |
Top three noisy pixels from each quadrant. If the there are fewer than three noisy pixels in the level2.evt file, extra rows are filled as -1
| Pixel properties | Quadrant properties | ||||||
|---|---|---|---|---|---|---|---|
| Quadrant | DetID | PixID | Counts | Sigma | Mean | Median | Sigma |
| A | 10 | 83 | 421107 | 3782.52 | 551 | 542 | 111.2 |
| A | 15 | 222 | 64688 | 576.92 | 551 | 542 | 111.2 |
| A | 6 | 10 | 18897 | 165.08 | 551 | 542 | 111.2 |
| B | 5 | 172 | 1074910 | 10252.4 | 547 | 534 | 104.8 |
| B | 5 | 255 | 91543 | 868.47 | 547 | 534 | 104.8 |
| B | 12 | 111 | 12908 | 118.08 | 547 | 534 | 104.8 |
| C | 15 | 214 | 221366 | 1777.9 | 536 | 539 | 124.2 |
| C | 3 | 233 | 61584 | 491.48 | 536 | 539 | 124.2 |
| C | 0 | 10 | 13866 | 107.3 | 536 | 539 | 124.2 |
| D | 7 | 38 | 1695675 | 13515.03 | 512 | 497 | 125.4 |
| D | 2 | 249 | 688618 | 5486.14 | 512 | 497 | 125.4 |
| D | 13 | 249 | 212655 | 1691.46 | 512 | 497 | 125.4 |
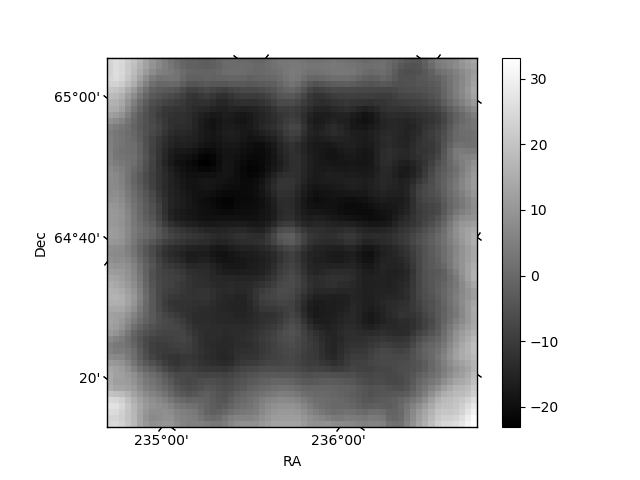
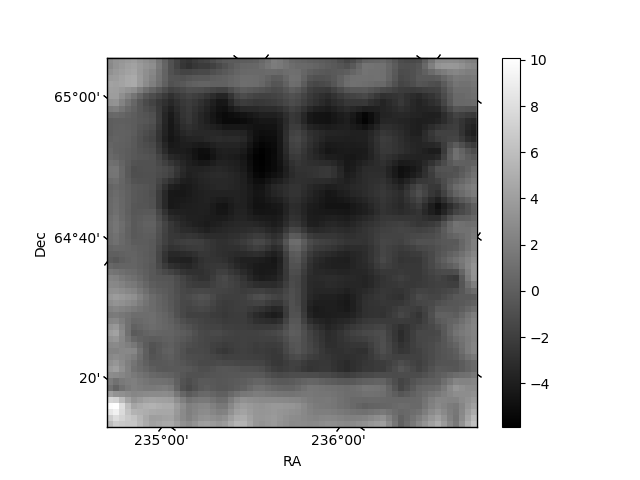
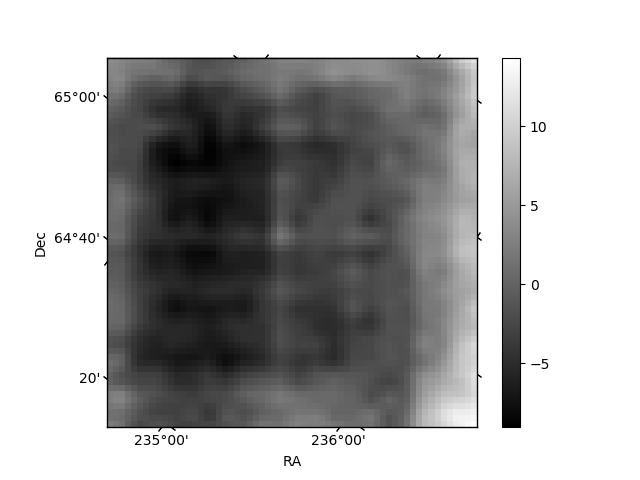
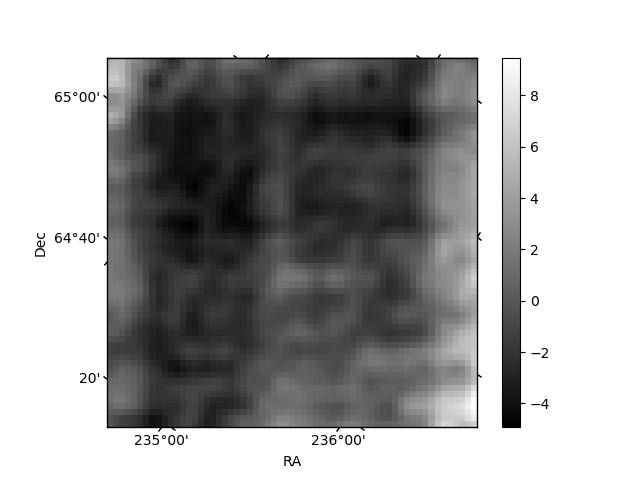
Histogram calculated using DETX and DETY for each event in the final _common_clean file
| Quadrant A | 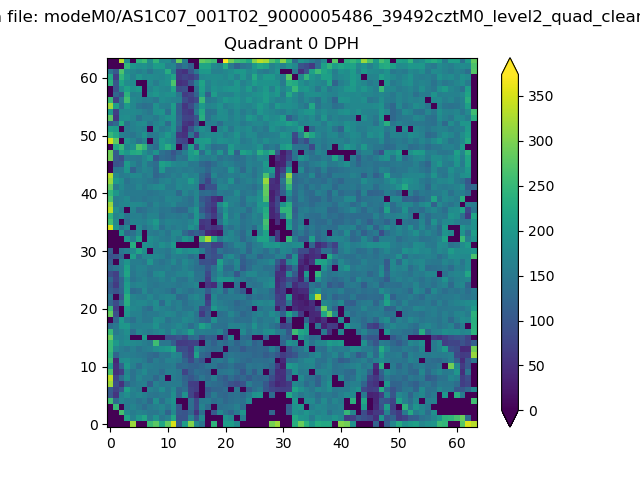 |
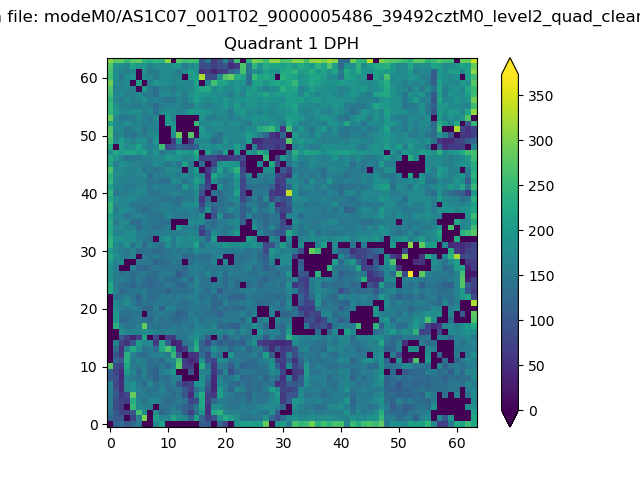 |
Quadrant B |
|---|---|---|---|
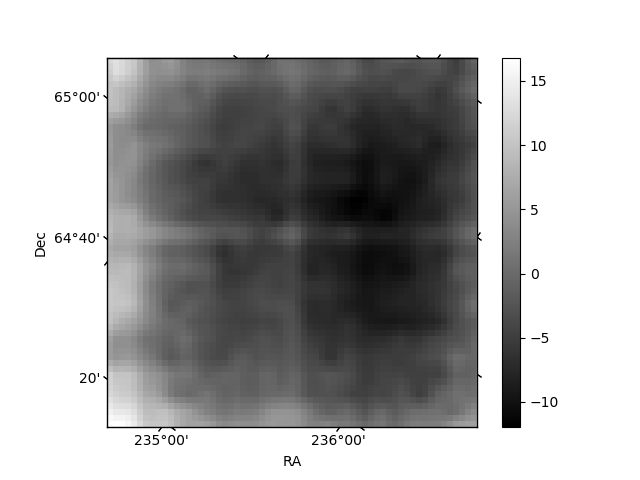
| Quadrant D | 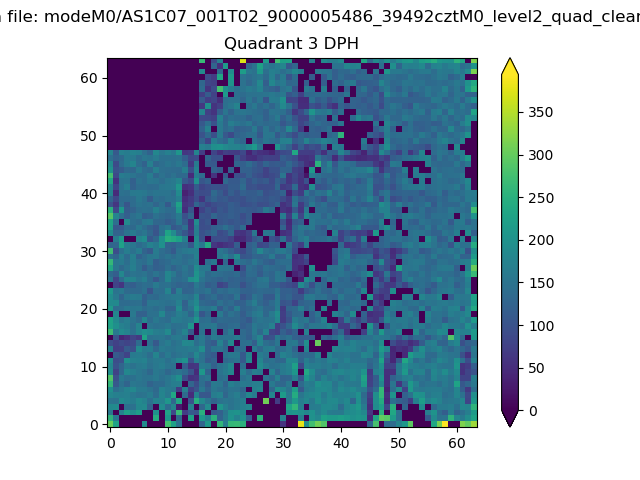 |
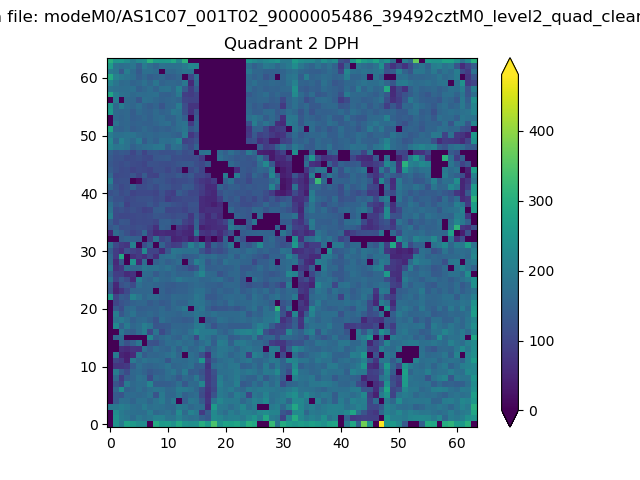 |
Quadrant C |
| Plot type | Count rate plots | Images |
|---|---|---|
| Comparison with Poisson distribution Blue bars denote a histogram of data divided into 1 sec bins. Red curve is a Poisson curve with rate = median count rate of data. |
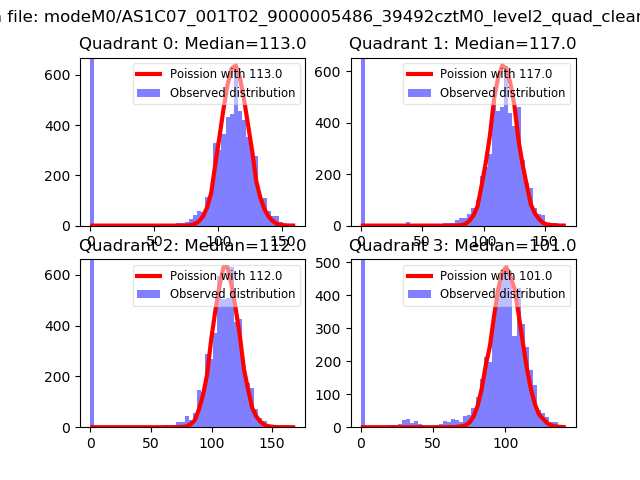 |
 |
| Quadrant-wise count rates Data is divided into 100 sec bins |
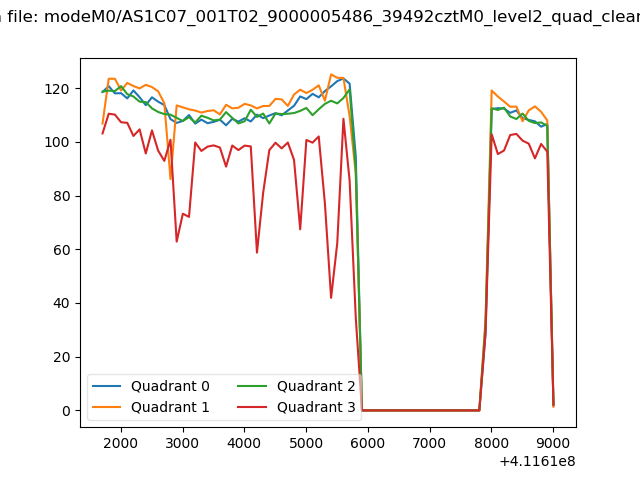 |
|
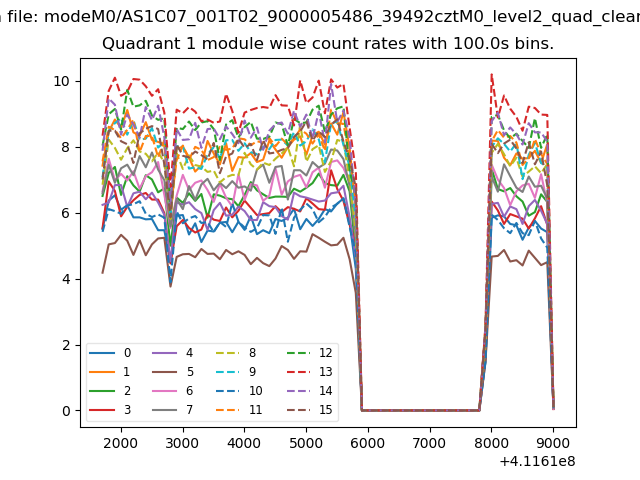
| Module-wise count rates for Quadrant A Data is divided into 100 sec bins |
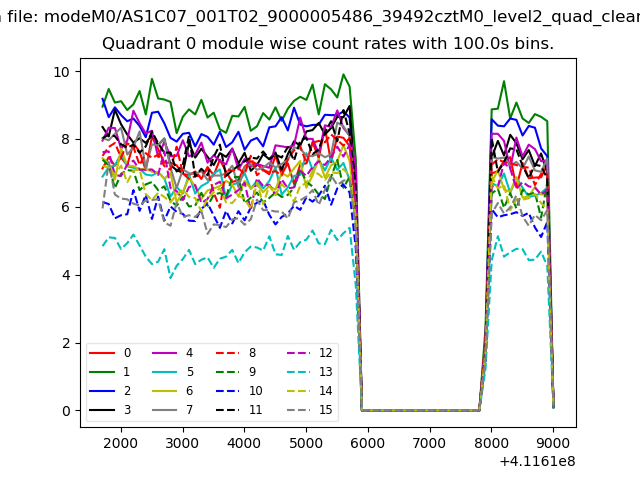 |
 |
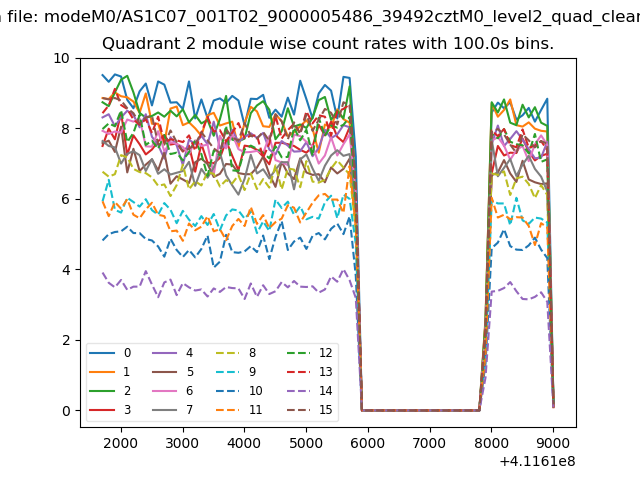
| Module-wise count rates for Quadrant B Data is divided into 100 sec bins |
 |
 |
| Module-wise count rates for Quadrant C Data is divided into 100 sec bins |
 |
 |
| Module-wise count rates for Quadrant D Data is divided into 100 sec bins |
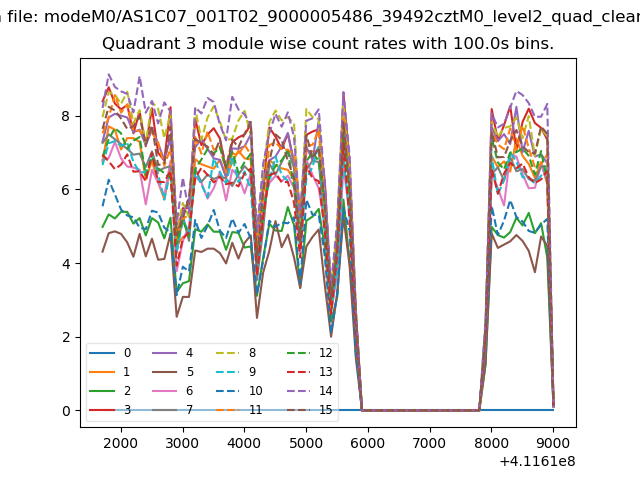 |
 |
| Parameter | Plot |
|---|---|
| CZT HV Monitor | 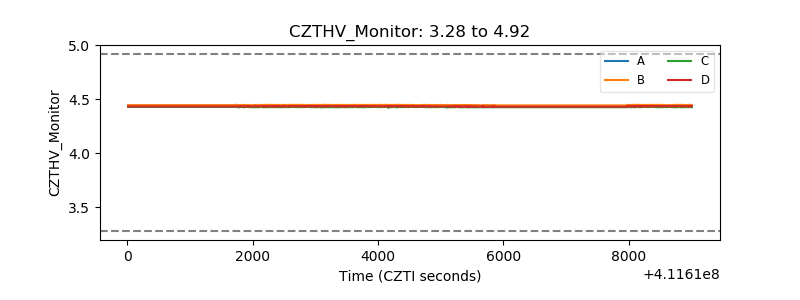 |
| D_VDD | 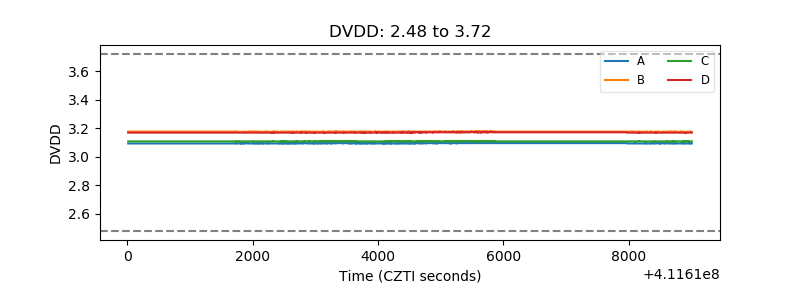 |
| Temperature 1 | 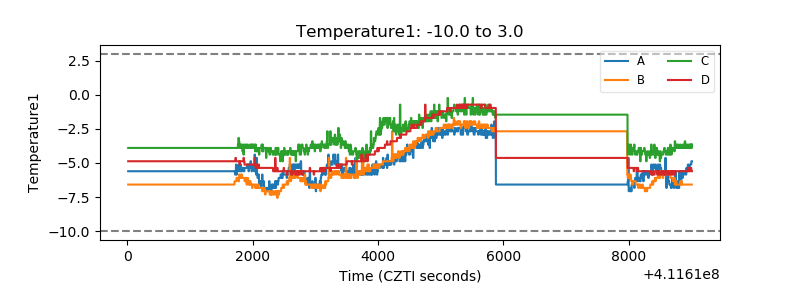 |
| Veto HV Monitor | 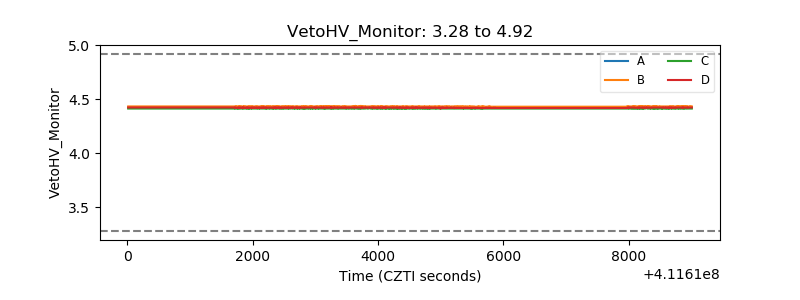 |
| Veto LLD | 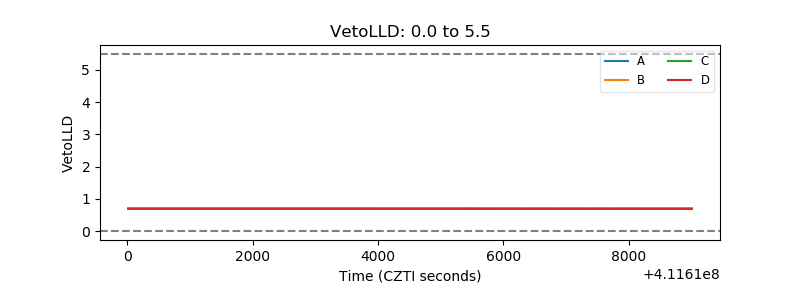 |
| Alpha Counter | 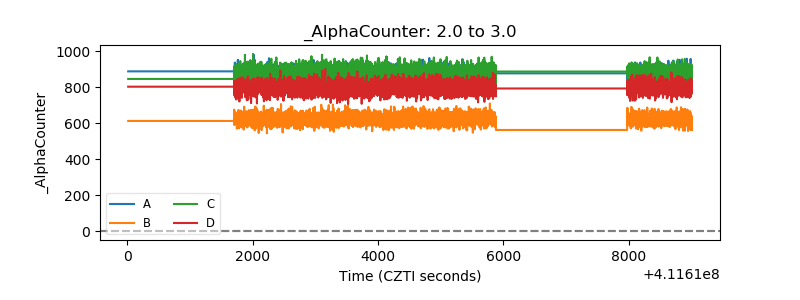 |
| _CPM_Rate | 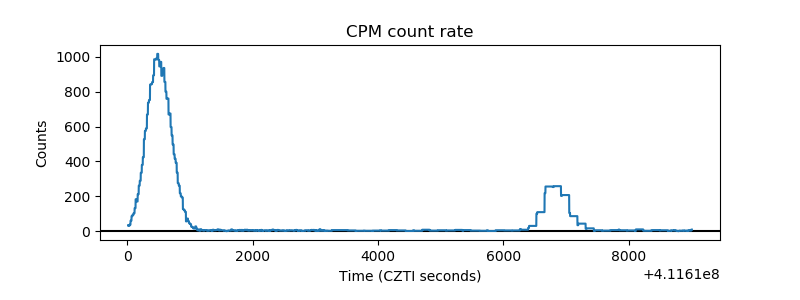 |
| CZT Counter | 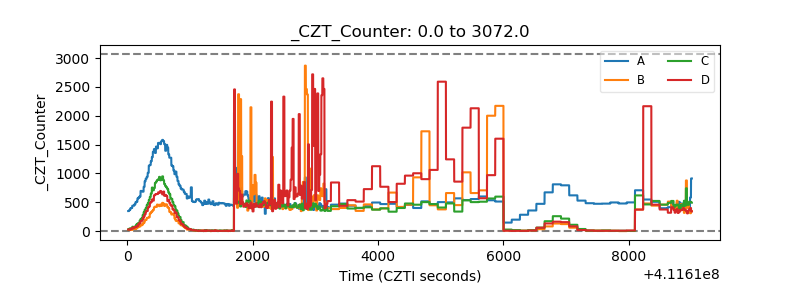 |
| +2.5 Volts monitor | 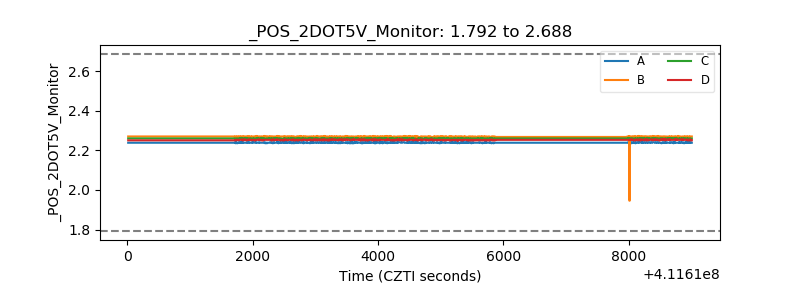 |
| +5 Volts monitor | 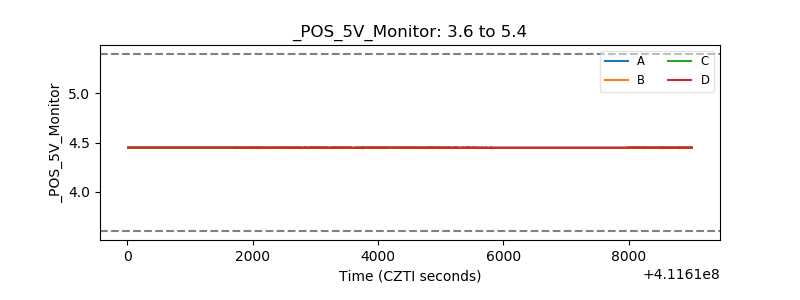 |
| _ROLL_ROT | 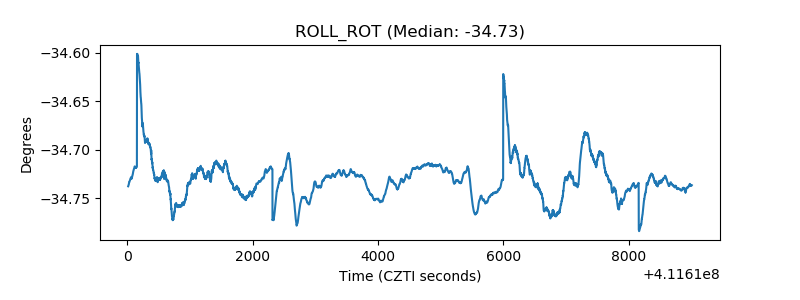 |
| _Roll_DEC | 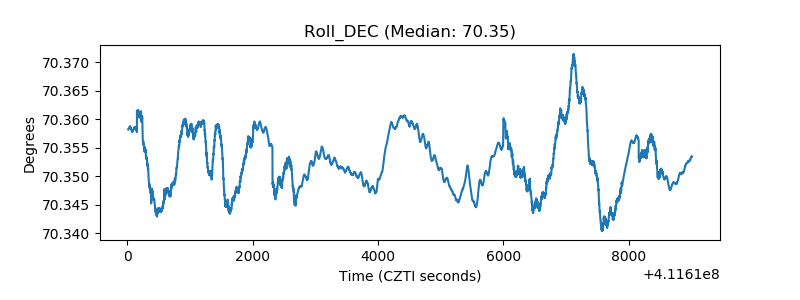 |
| _Roll_RA | 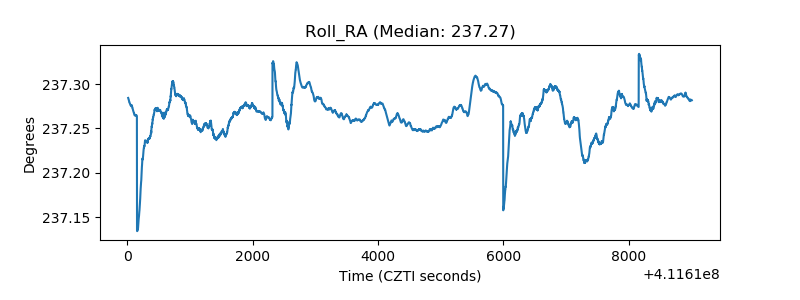 |
| Veto Counter | 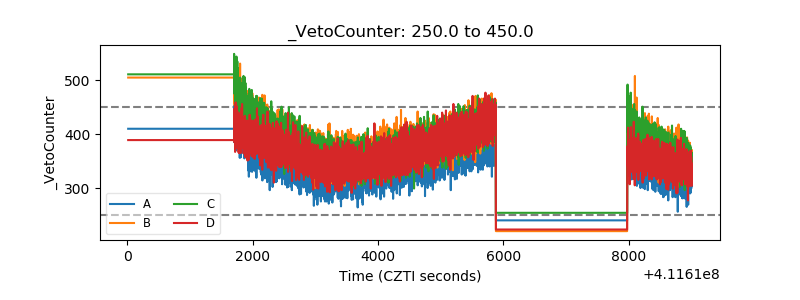 |