| Param | Original file | Final file |
|---|---|---|
| Filename | modeM0/AS1C07_001T02_9000005486_39494cztM0_level2.fits | modeM0/AS1C07_001T02_9000005486_39494cztM0_level2_quad_clean.evt |
| Size (bytes) | 395,965,440 | 89,256,960 |
| Size | 377.6 MB | 85.1 MB |
| Events in quadrant A | 4,648,108 | 576,972 |
| Events in quadrant B | 2,971,884 | 622,354 |
| Events in quadrant C | 3,334,546 | 582,957 |
| Events in quadrant D | 3,271,232 | 532,122 |
| Mode M0 | |||
|---|---|---|---|
| Quadrant | BADHDUFLAG | Total packets | Discarded packets |
| A | 0 | 17516 | 34 |
| B | 0 | 12980 | 9 |
| C | 0 | 13612 | 12 |
| D | 0 | 13844 | 3 |
| Mode M9 | |||
|---|---|---|---|
| Quadrant | BADHDUFLAG | Total packets | Discarded packets |
| A | 0 | 24 | 0 |
| B | 0 | 24 | 0 |
| C | 0 | 24 | 0 |
| D | 0 | 25 | 0 |
| Mode SS | |||
|---|---|---|---|
| Quadrant | BADHDUFLAG | Total packets | Discarded packets |
| A | 0 | 112 | 0 |
| B | 0 | 112 | 0 |
| C | 0 | 112 | 0 |
| D | 0 | 112 | 0 |
| Quadrant | Total seconds | Saturated seconds | Saturation percentage |
|---|---|---|---|
| A | 5546 | 364 | 6.563289% |
| B | 5550 | 41 | 0.738739% |
| C | 5549 | 85 | 1.531808% |
| D | 5554 | 157 | 2.826792% |
Noise dominated data is calculated using 1-second bins in cleaned event files. If a bin has >2000 counts, and if more than 50% of those come from <1% of pixels, then it is considered to be noise-dominated and hence unusable.
| Quadrant | # 1 sec bins | Bins with >0 counts | Bins with >2000 counts | High rate bins dominated by noise | Noise dominated (total time) | Noise dominated (detector-on time) | Marked lightcurve |
|---|---|---|---|---|---|---|---|
| A | 7046 | 5552 | 302 | 302 | 4.29% | 5.44% | 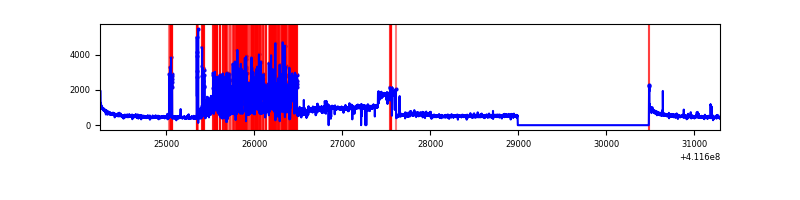 |
| B | 7046 | 5554 | 14 | 14 | 0.20% | 0.25% | 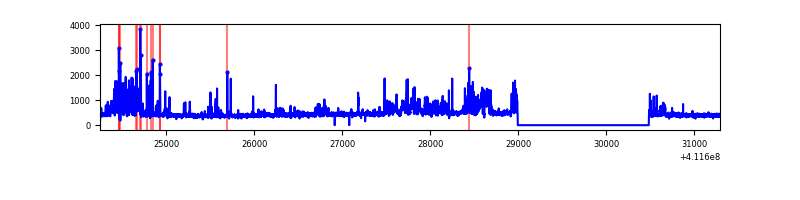 |
| C | 7046 | 5554 | 77 | 77 | 1.09% | 1.39% | 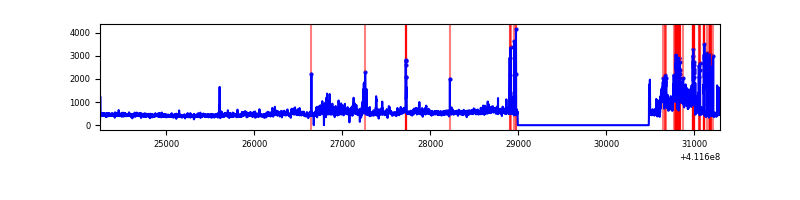 |
| D | 7046 | 5556 | 126 | 126 | 1.79% | 2.27% | 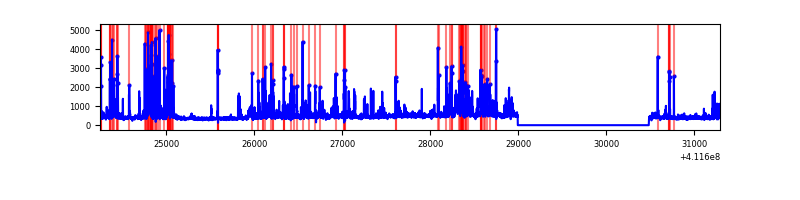 |
Top three noisy pixels from each quadrant. If the there are fewer than three noisy pixels in the level2.evt file, extra rows are filled as -1
| Pixel properties | Quadrant properties | ||||||
|---|---|---|---|---|---|---|---|
| Quadrant | DetID | PixID | Counts | Sigma | Mean | Median | Sigma |
| A | 6 | 10 | 989514 | 8378.21 | 575 | 562 | 118.0 |
| A | 7 | 192 | 955393 | 8089.14 | 575 | 562 | 118.0 |
| A | 10 | 83 | 440673 | 3728.53 | 575 | 562 | 118.0 |
| B | 5 | 172 | 642054 | 5684.63 | 584 | 567 | 112.8 |
| B | 5 | 255 | 17156 | 147.01 | 584 | 567 | 112.8 |
| B | 12 | 111 | 14126 | 120.15 | 584 | 567 | 112.8 |
| C | 15 | 208 | 526964 | 4044.01 | 566 | 570 | 130.2 |
| C | 15 | 214 | 234017 | 1793.45 | 566 | 570 | 130.2 |
| C | 3 | 233 | 231738 | 1775.94 | 566 | 570 | 130.2 |
| D | 13 | 249 | 503669 | 3617.75 | 565 | 549 | 139.1 |
| D | 12 | 227 | 260293 | 1867.72 | 565 | 549 | 139.1 |
| D | 2 | 120 | 140490 | 1006.26 | 565 | 549 | 139.1 |
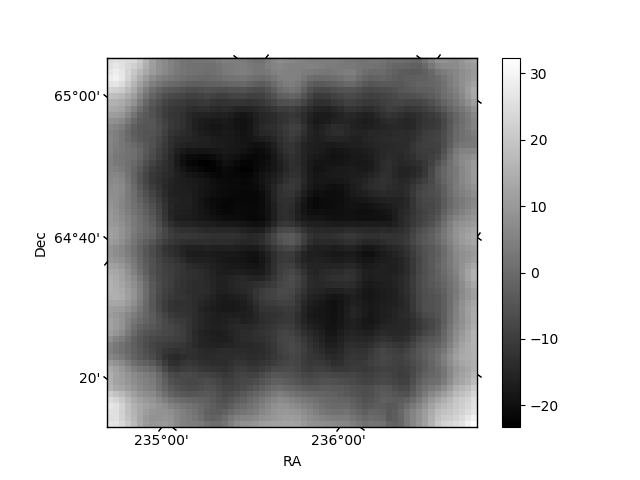
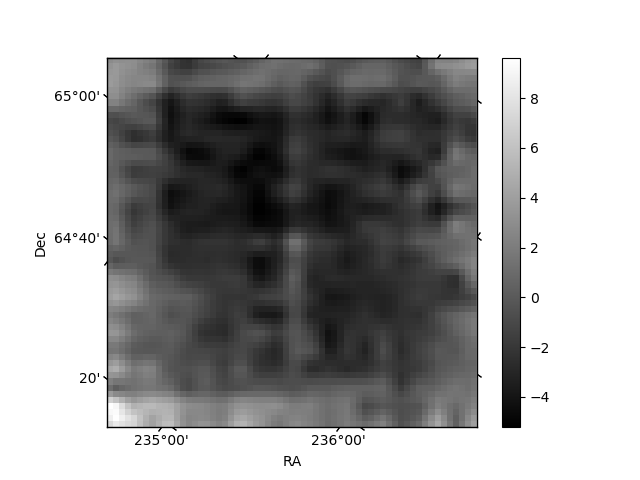
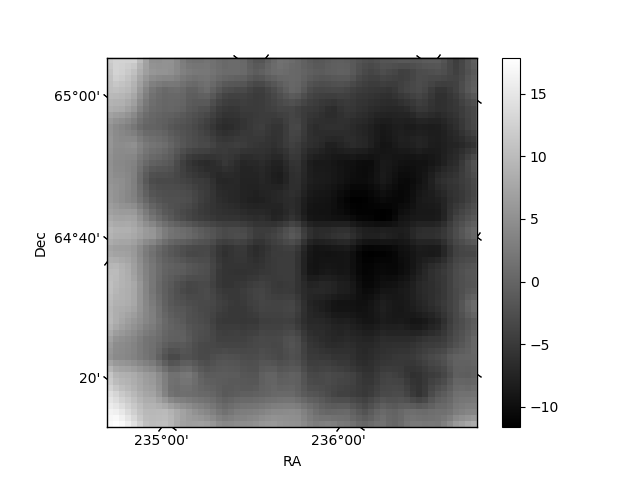
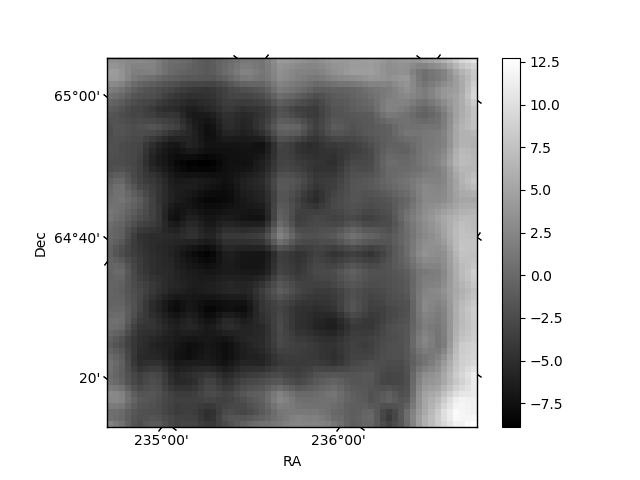
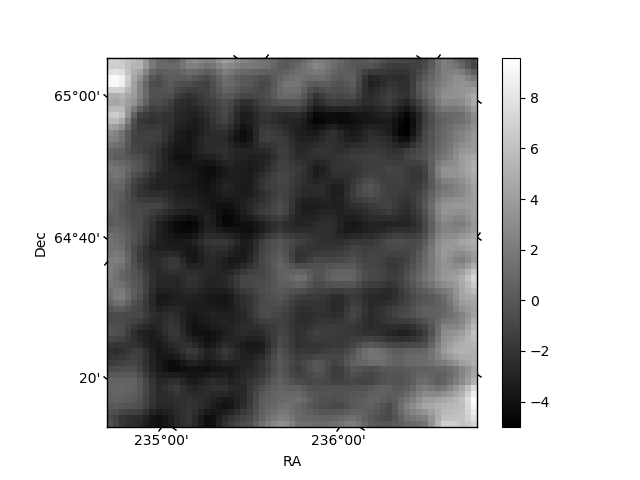
Histogram calculated using DETX and DETY for each event in the final _common_clean file
| Quadrant A | 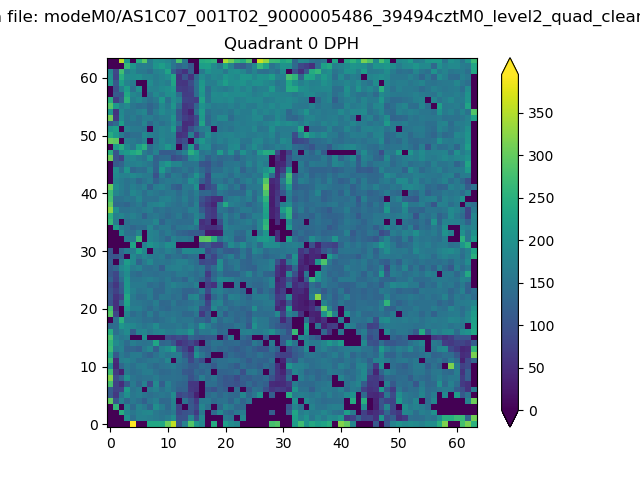 |
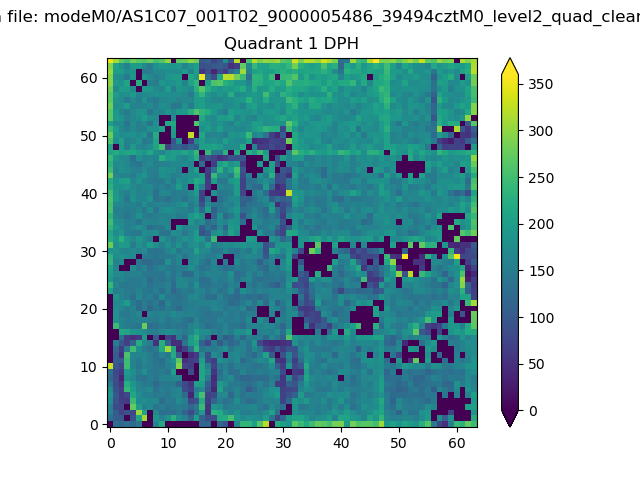 |
Quadrant B |
|---|---|---|---|
| Quadrant D | 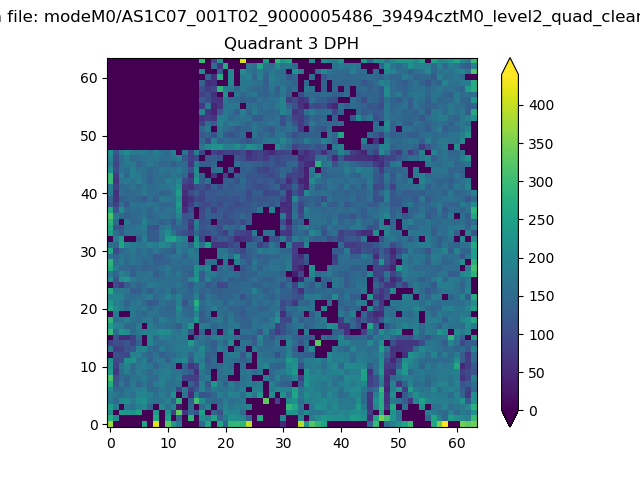 |
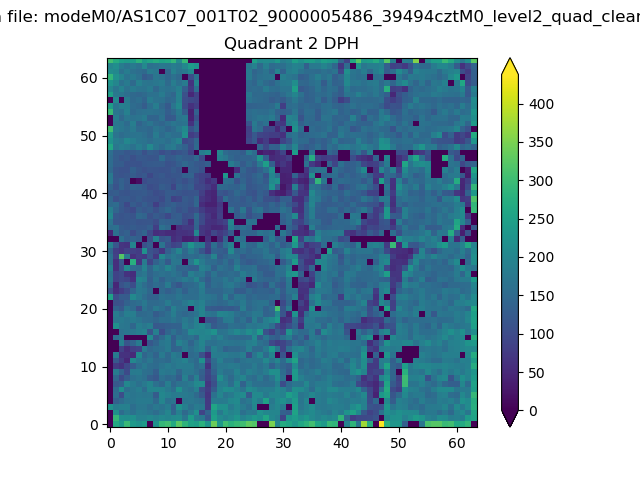 |
Quadrant C |
| Plot type | Count rate plots | Images |
|---|---|---|
| Comparison with Poisson distribution Blue bars denote a histogram of data divided into 1 sec bins. Red curve is a Poisson curve with rate = median count rate of data. |
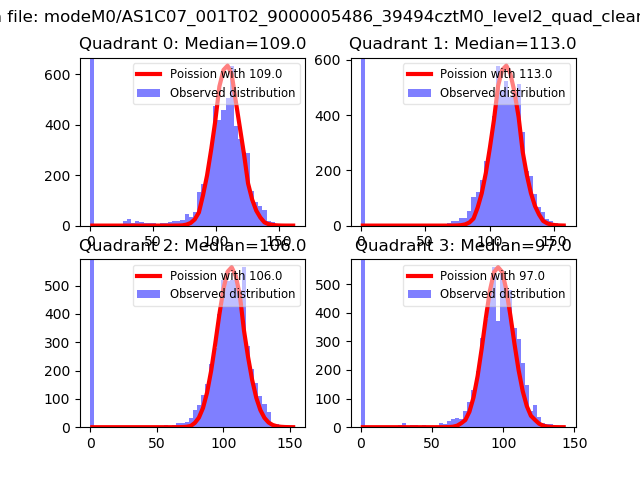 |
 |
| Quadrant-wise count rates Data is divided into 100 sec bins |
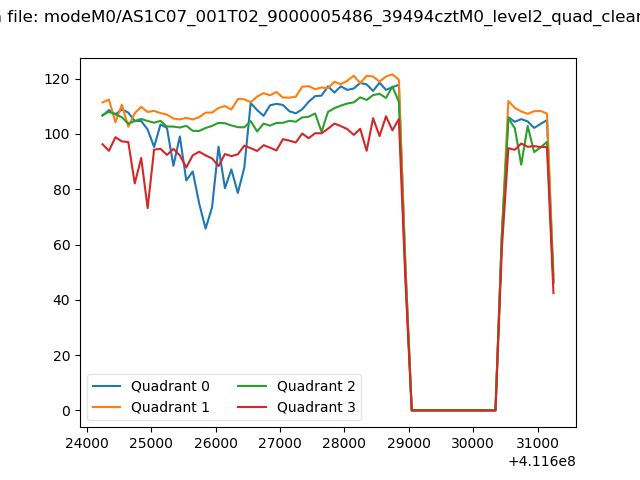 |
|
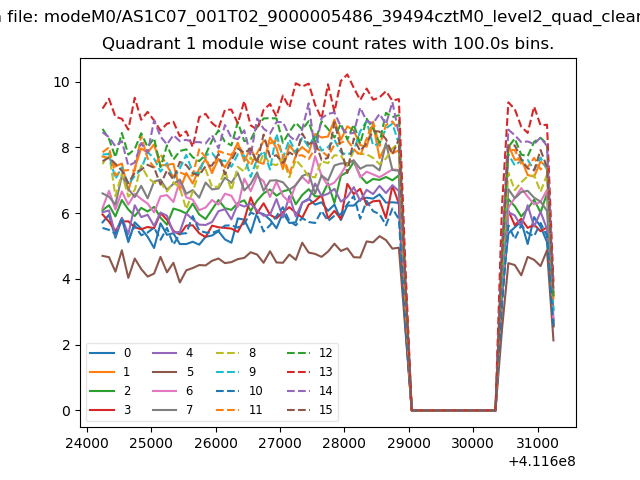
| Module-wise count rates for Quadrant A Data is divided into 100 sec bins |
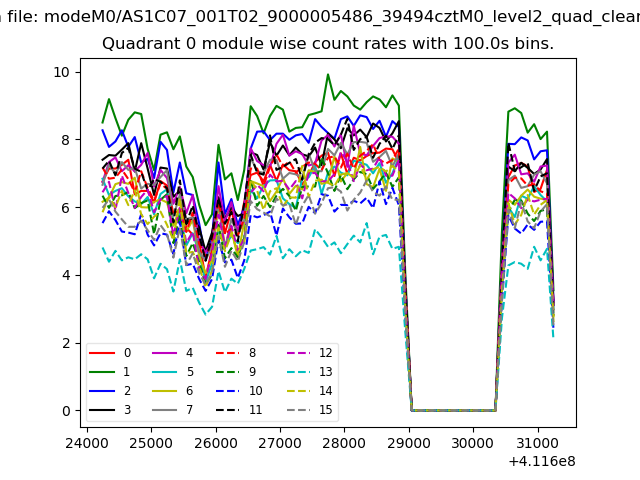 |
 |
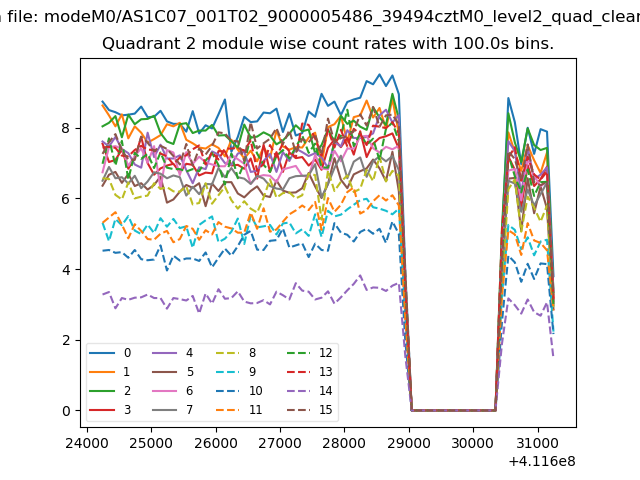
| Module-wise count rates for Quadrant B Data is divided into 100 sec bins |
 |
 |
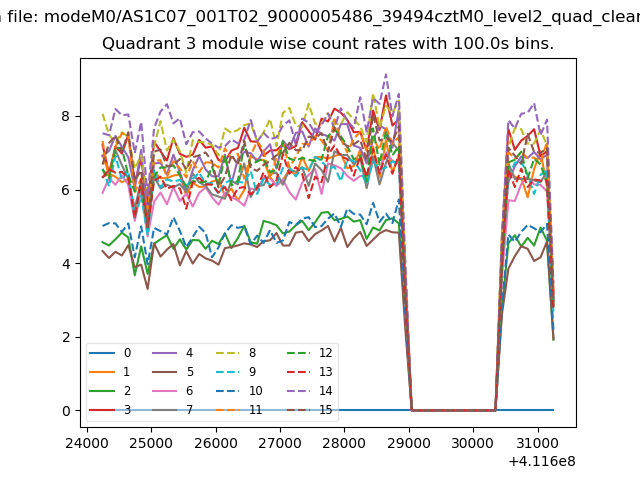
| Module-wise count rates for Quadrant C Data is divided into 100 sec bins |
 |
 |
| Module-wise count rates for Quadrant D Data is divided into 100 sec bins |
 |
 |
| Parameter | Plot |
|---|---|
| CZT HV Monitor | 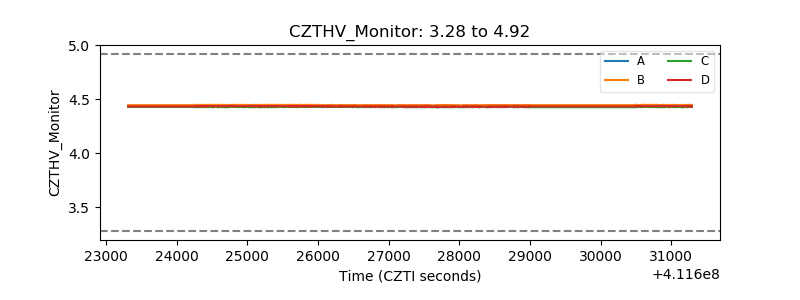 |
| D_VDD | 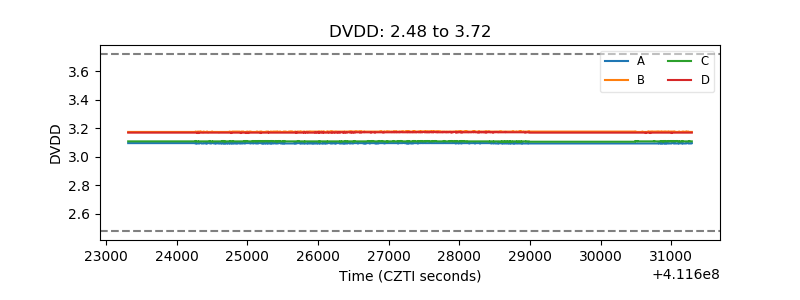 |
| Temperature 1 | 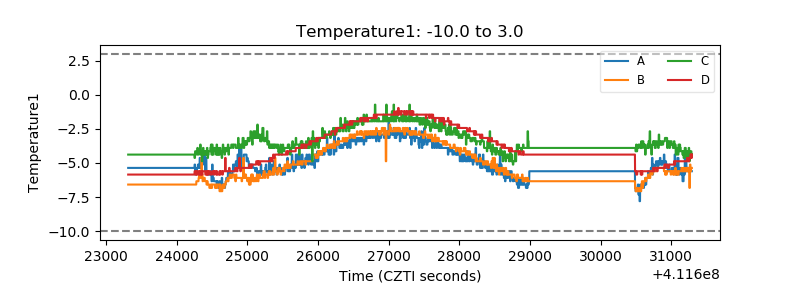 |
| Veto HV Monitor | 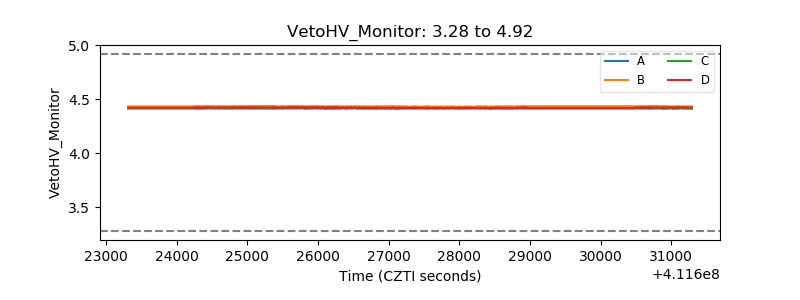 |
| Veto LLD | 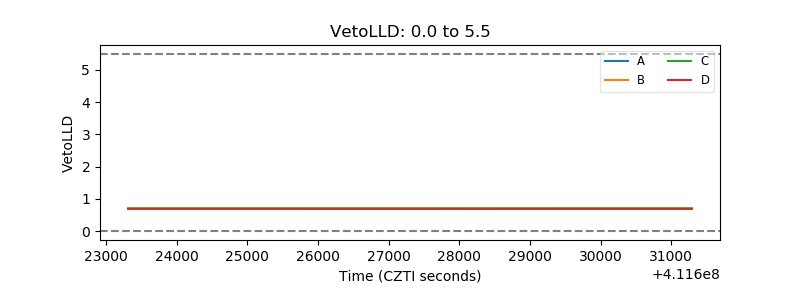 |
| Alpha Counter | 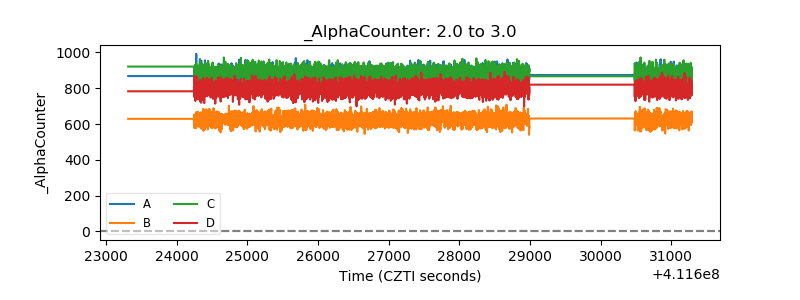 |
| _CPM_Rate | 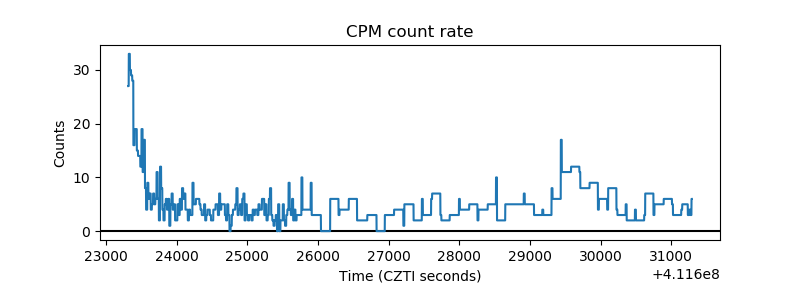 |
| CZT Counter | 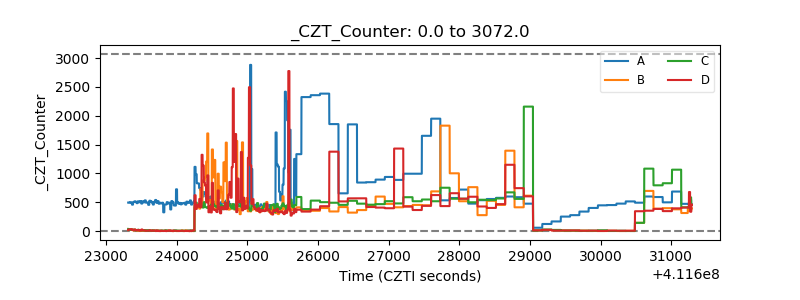 |
| +2.5 Volts monitor | 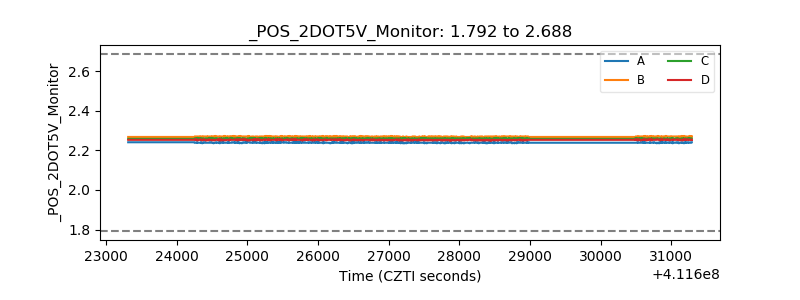 |
| +5 Volts monitor | 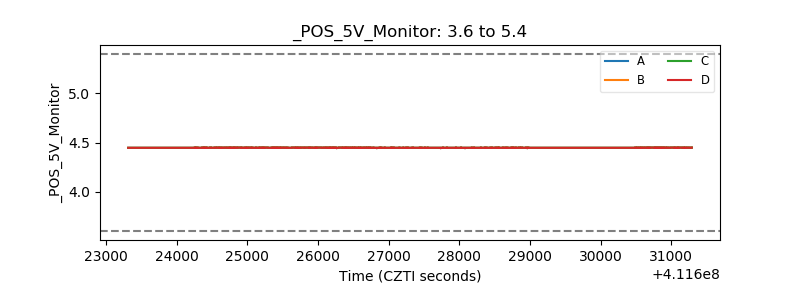 |
| _ROLL_ROT | 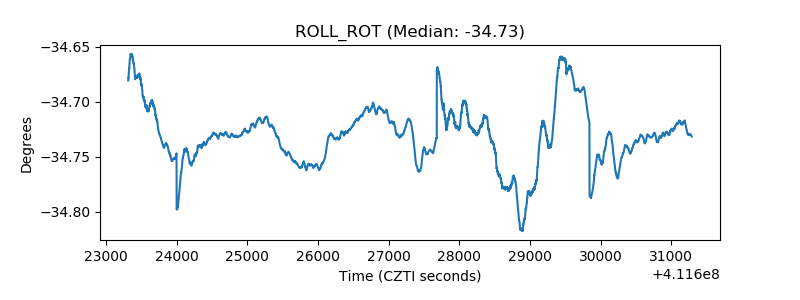 |
| _Roll_DEC | 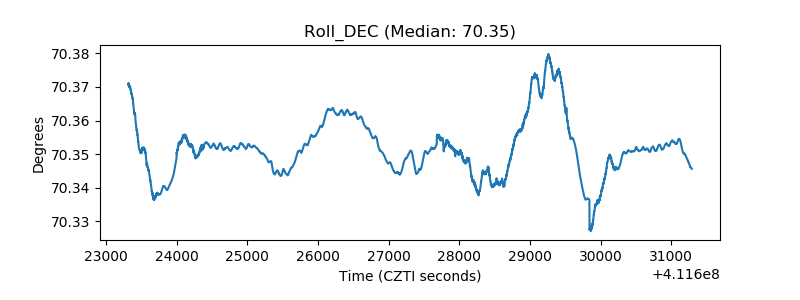 |
| _Roll_RA | 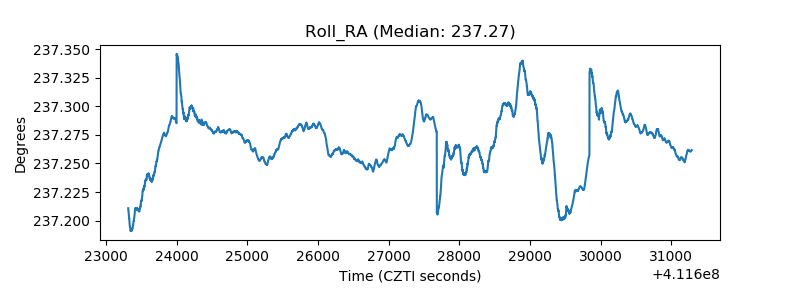 |
| Veto Counter | 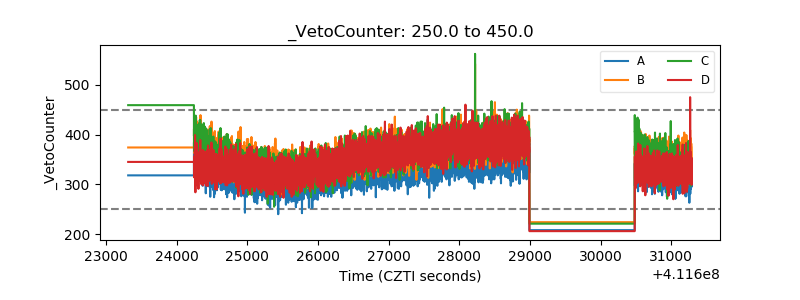 |