| Param | Original file | Final file |
|---|---|---|
| Filename | modeM0/AS1C07_001T02_9000005486_39495cztM0_level2.fits | modeM0/AS1C07_001T02_9000005486_39495cztM0_level2_quad_clean.evt |
| Size (bytes) | 351,074,880 | 95,984,640 |
| Size | 334.8 MB | 91.5 MB |
| Events in quadrant A | 3,126,569 | 640,015 |
| Events in quadrant B | 2,949,805 | 658,549 |
| Events in quadrant C | 3,444,983 | 620,404 |
| Events in quadrant D | 3,013,527 | 573,894 |
| Mode M0 | |||
|---|---|---|---|
| Quadrant | BADHDUFLAG | Total packets | Discarded packets |
| A | 0 | 12881 | 3 |
| B | 0 | 12972 | 2 |
| C | 0 | 13898 | 2 |
| D | 0 | 13343 | 2 |
| Mode M9 | |||
|---|---|---|---|
| Quadrant | BADHDUFLAG | Total packets | Discarded packets |
| A | 0 | 28 | 0 |
| B | 0 | 28 | 0 |
| C | 0 | 28 | 0 |
| D | 0 | 28 | 0 |
| Mode SS | |||
|---|---|---|---|
| Quadrant | BADHDUFLAG | Total packets | Discarded packets |
| A | 0 | 122 | 0 |
| B | 0 | 122 | 0 |
| C | 0 | 122 | 0 |
| D | 0 | 122 | 0 |
| Quadrant | Total seconds | Saturated seconds | Saturation percentage |
|---|---|---|---|
| A | 5919 | 31 | 0.523737% |
| B | 5919 | 47 | 0.794053% |
| C | 5919 | 75 | 1.267106% |
| D | 5919 | 53 | 0.895422% |
Noise dominated data is calculated using 1-second bins in cleaned event files. If a bin has >2000 counts, and if more than 50% of those come from <1% of pixels, then it is considered to be noise-dominated and hence unusable.
| Quadrant | # 1 sec bins | Bins with >0 counts | Bins with >2000 counts | High rate bins dominated by noise | Noise dominated (total time) | Noise dominated (detector-on time) | Marked lightcurve |
|---|---|---|---|---|---|---|---|
| A | 8722 | 5921 | 17 | 17 | 0.19% | 0.29% | 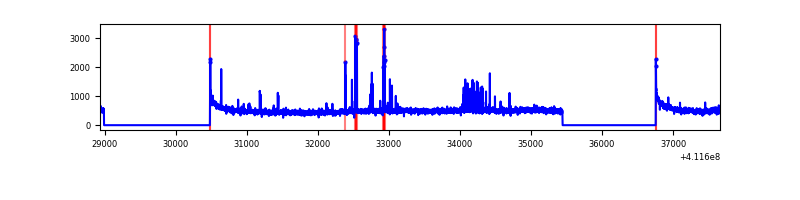 |
| B | 8722 | 5921 | 33 | 33 | 0.38% | 0.56% | 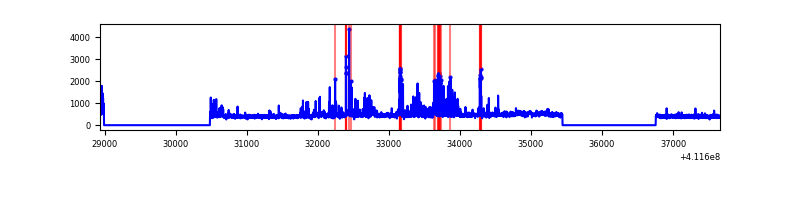 |
| C | 8722 | 5921 | 66 | 66 | 0.76% | 1.11% | 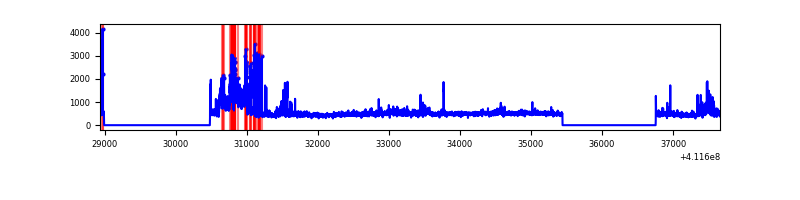 |
| D | 8722 | 5921 | 53 | 53 | 0.61% | 0.90% | 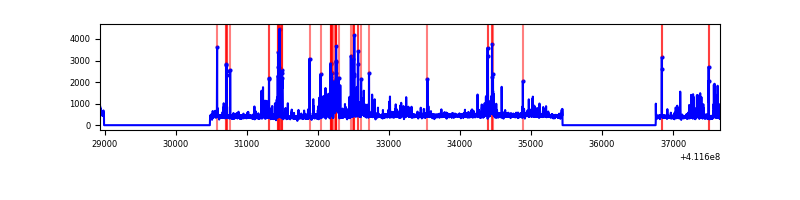 |
Top three noisy pixels from each quadrant. If the there are fewer than three noisy pixels in the level2.evt file, extra rows are filled as -1
| Pixel properties | Quadrant properties | ||||||
|---|---|---|---|---|---|---|---|
| Quadrant | DetID | PixID | Counts | Sigma | Mean | Median | Sigma |
| A | 10 | 83 | 461768 | 3592.99 | 630 | 616 | 128.3 |
| A | 6 | 10 | 134224 | 1040.99 | 630 | 616 | 128.3 |
| A | 2 | 79 | 77804 | 601.4 | 630 | 616 | 128.3 |
| B | 5 | 172 | 451257 | 3701.85 | 627 | 609 | 121.7 |
| B | 12 | 111 | 15509 | 122.4 | 627 | 609 | 121.7 |
| B | 11 | 111 | 14168 | 111.38 | 627 | 609 | 121.7 |
| C | 15 | 208 | 701337 | 4917.16 | 610 | 615 | 142.5 |
| C | 15 | 214 | 249542 | 1746.79 | 610 | 615 | 142.5 |
| C | 3 | 233 | 107655 | 751.13 | 610 | 615 | 142.5 |
| D | 12 | 227 | 353065 | 2346.65 | 611 | 593 | 150.2 |
| D | 13 | 249 | 127191 | 842.85 | 611 | 593 | 150.2 |
| D | 2 | 249 | 72411 | 478.14 | 611 | 593 | 150.2 |
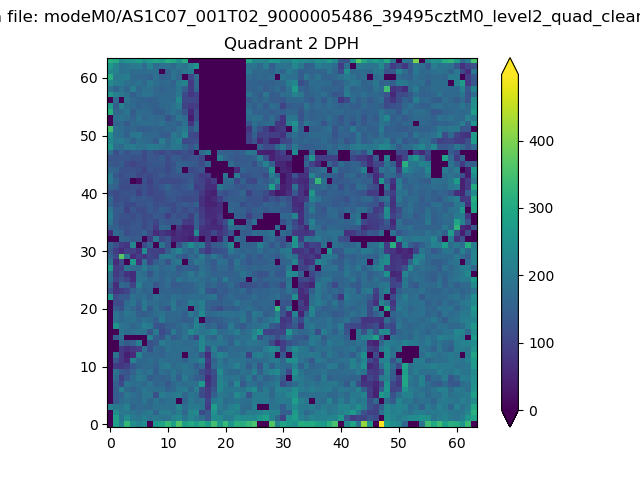
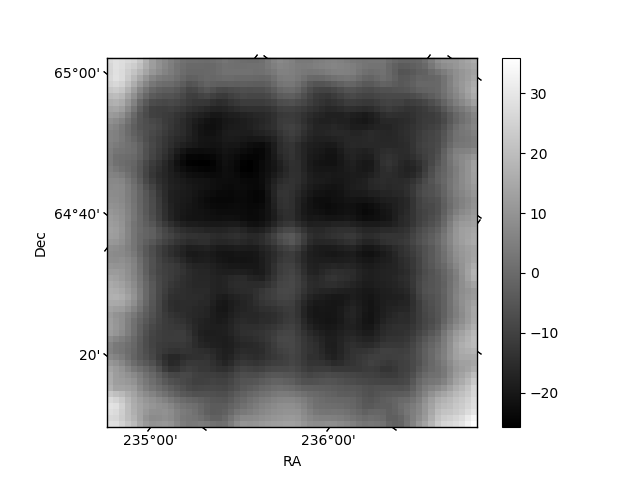
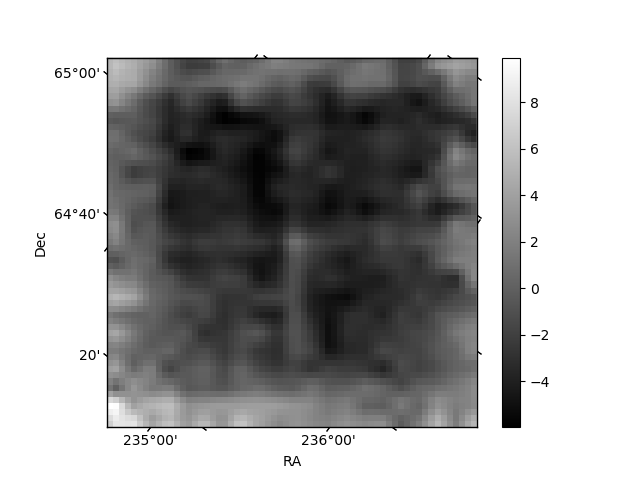
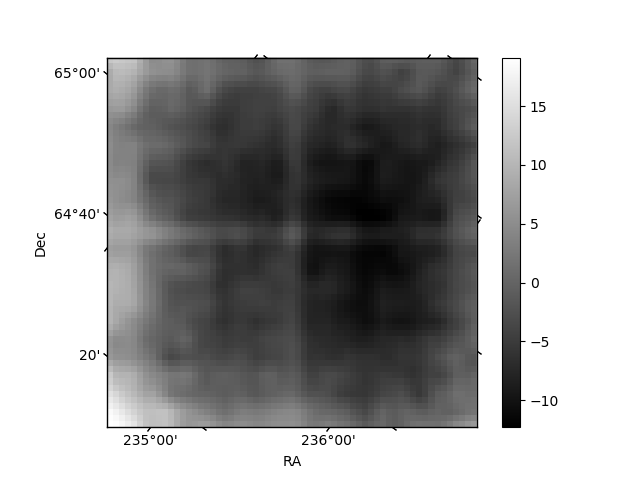
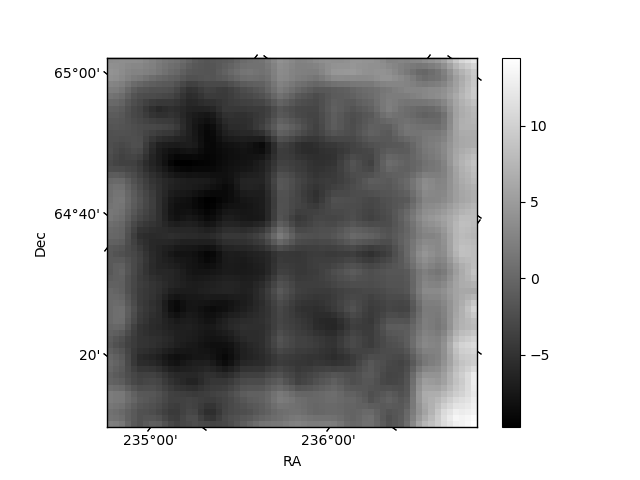
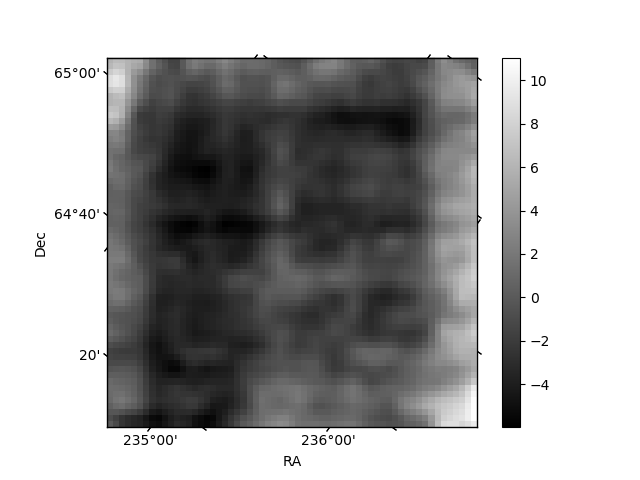
Histogram calculated using DETX and DETY for each event in the final _common_clean file
| Quadrant A | 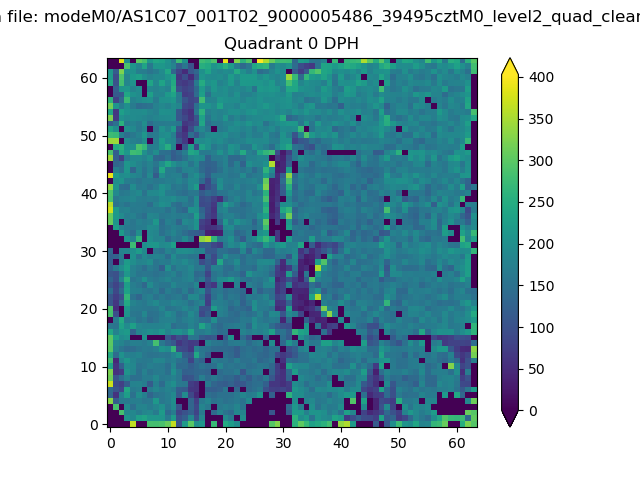 |
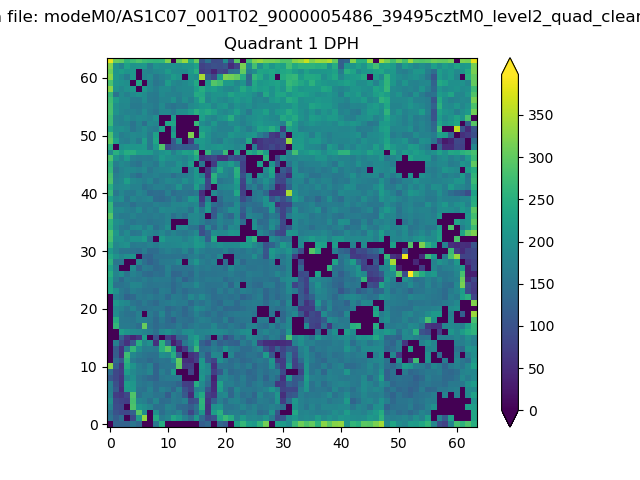 |
Quadrant B |
|---|---|---|---|
| Quadrant D | 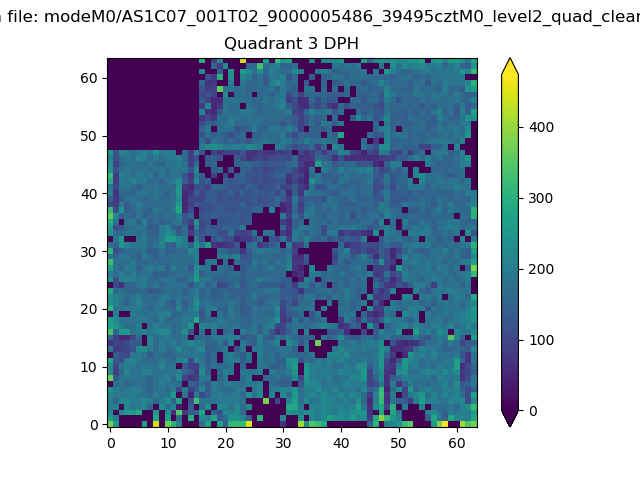 |
 |
Quadrant C |
| Plot type | Count rate plots | Images |
|---|---|---|
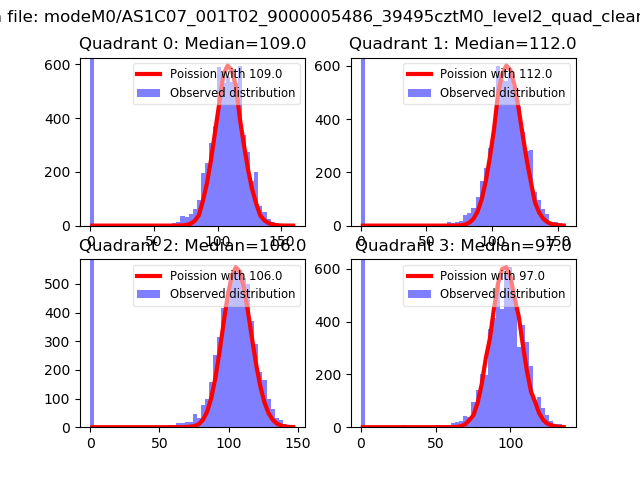
| Comparison with Poisson distribution Blue bars denote a histogram of data divided into 1 sec bins. Red curve is a Poisson curve with rate = median count rate of data. |
 |
 |
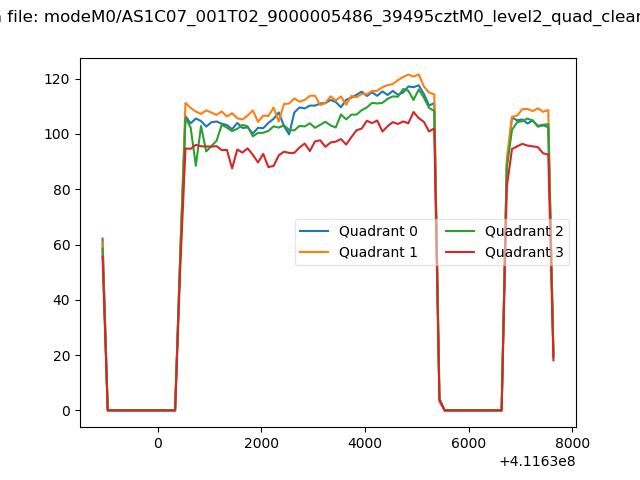
| Quadrant-wise count rates Data is divided into 100 sec bins |
 |
|
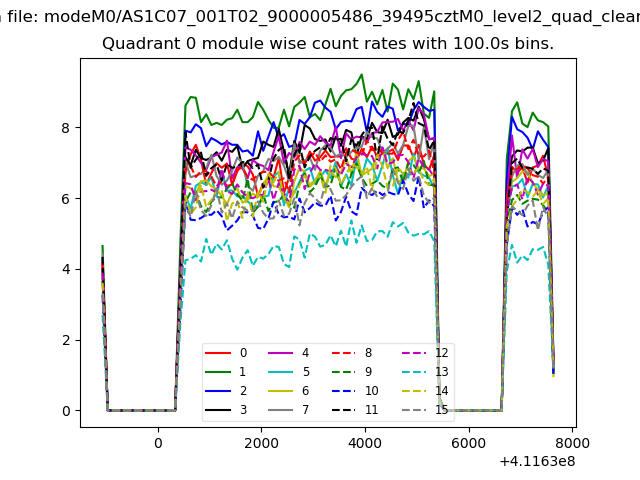
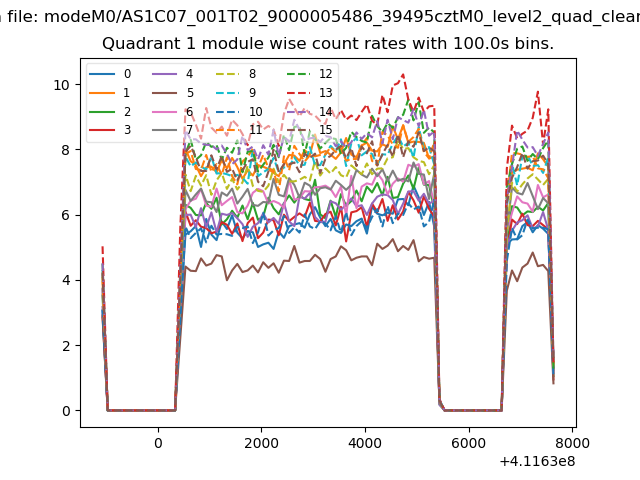
| Module-wise count rates for Quadrant A Data is divided into 100 sec bins |
 |
 |
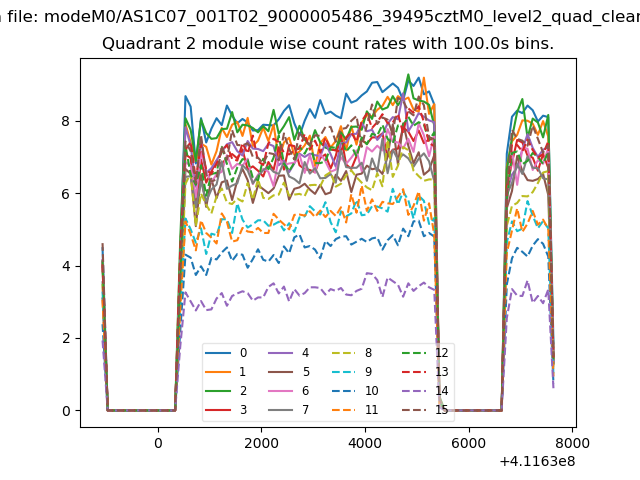
| Module-wise count rates for Quadrant B Data is divided into 100 sec bins |
 |
 |
| Module-wise count rates for Quadrant C Data is divided into 100 sec bins |
 |
 |
| Module-wise count rates for Quadrant D Data is divided into 100 sec bins |
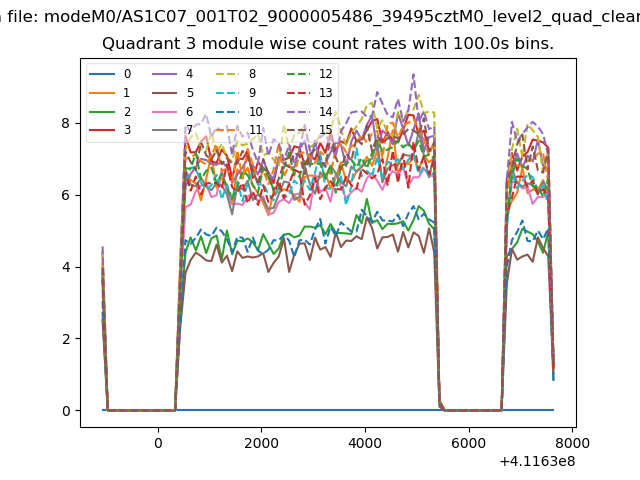 |
 |
| Parameter | Plot |
|---|---|
| CZT HV Monitor | 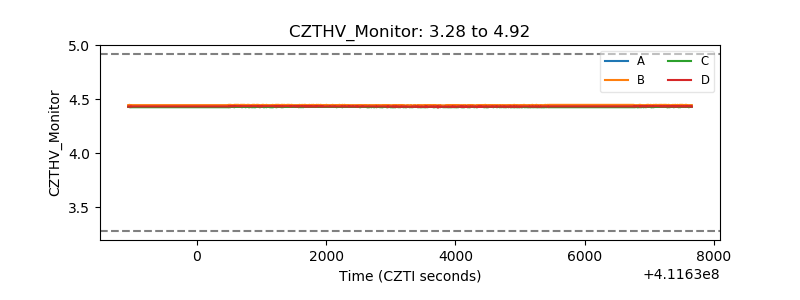 |
| D_VDD | 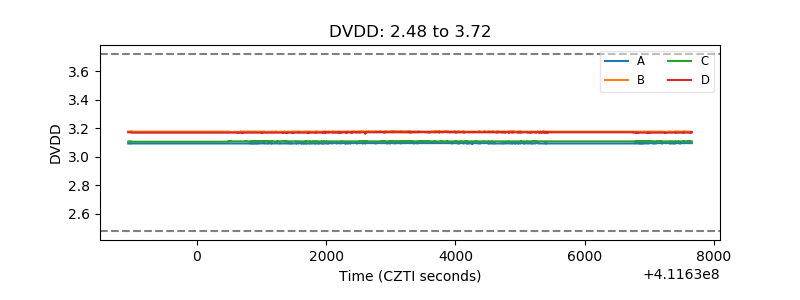 |
| Temperature 1 | 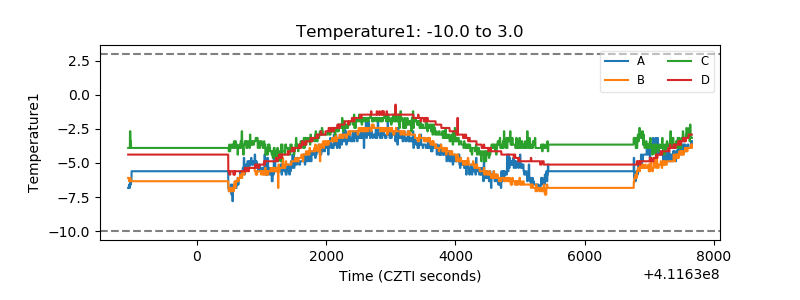 |
| Veto HV Monitor | 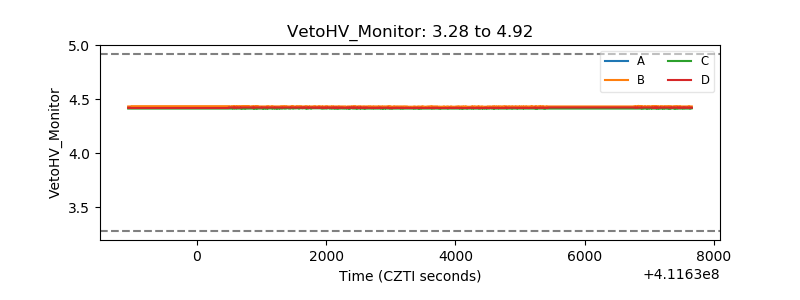 |
| Veto LLD | 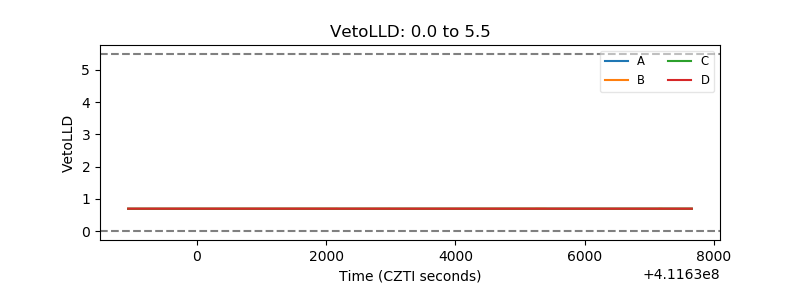 |
| Alpha Counter | 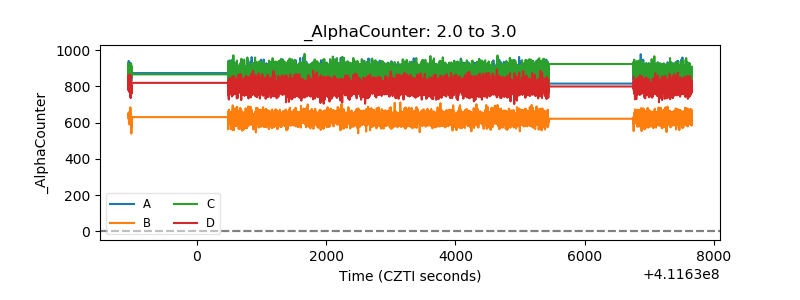 |
| _CPM_Rate | 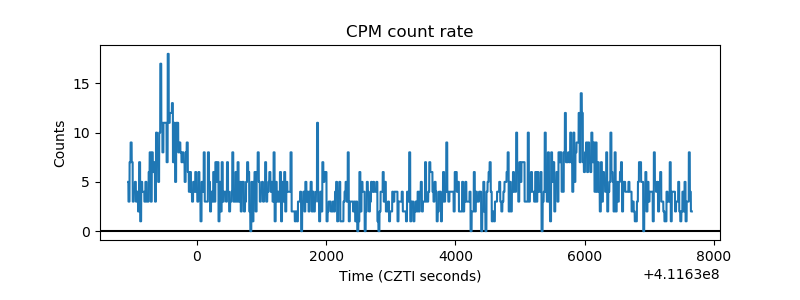 |
| CZT Counter | 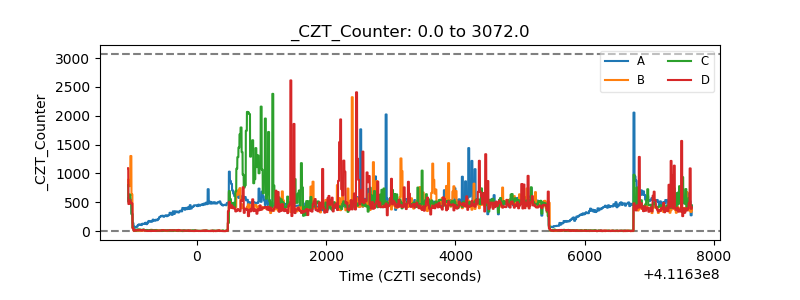 |
| +2.5 Volts monitor | 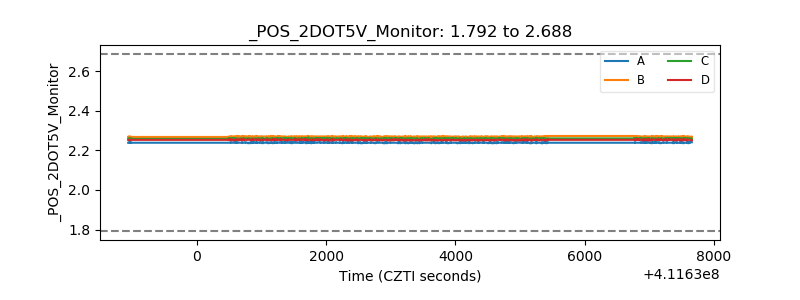 |
| +5 Volts monitor | 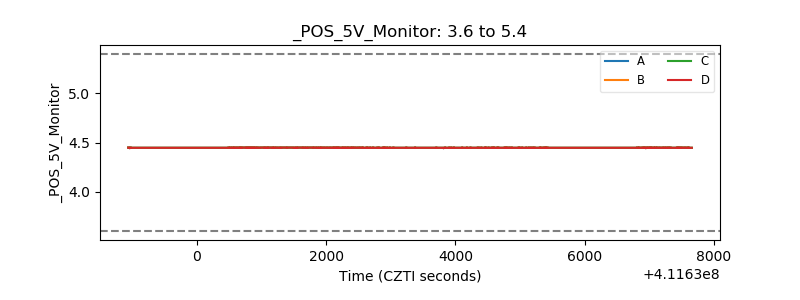 |
| _ROLL_ROT | 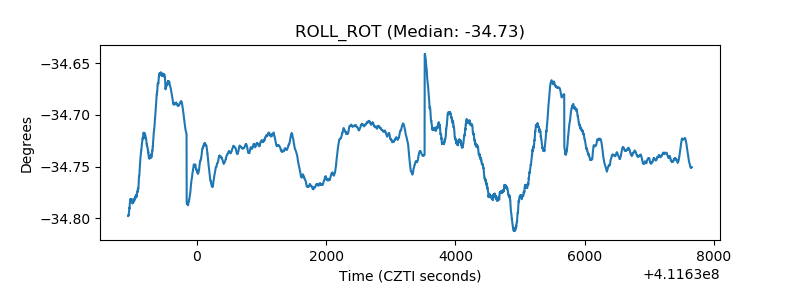 |
| _Roll_DEC | 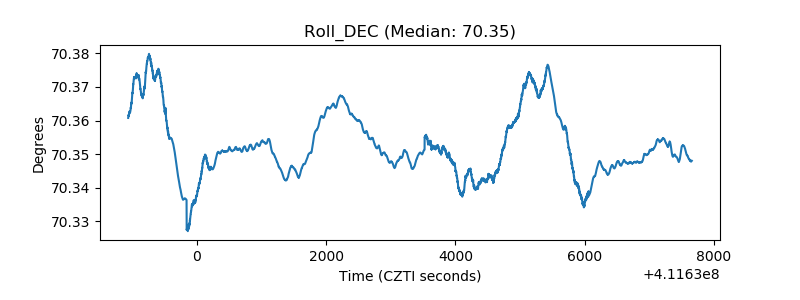 |
| _Roll_RA | 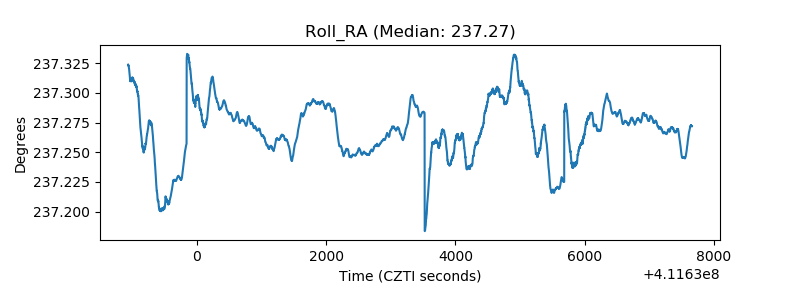 |
| Veto Counter | 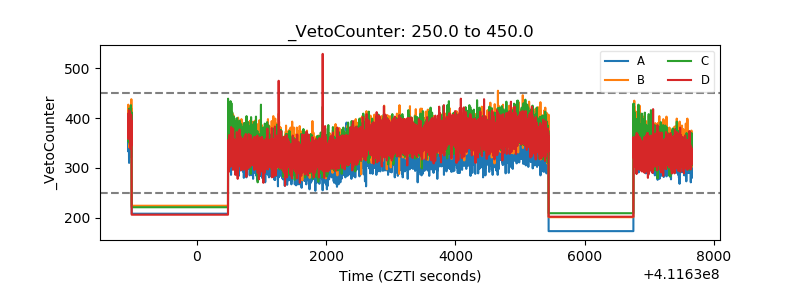 |