| Param | Original file | Final file |
|---|---|---|
| Filename | modeM0/AS1C07_001T02_9000005486_39496cztM0_level2.fits | modeM0/AS1C07_001T02_9000005486_39496cztM0_level2_quad_clean.evt |
| Size (bytes) | 323,729,280 | 89,507,520 |
| Size | 308.7 MB | 85.4 MB |
| Events in quadrant A | 3,025,440 | 596,050 |
| Events in quadrant B | 2,500,813 | 616,790 |
| Events in quadrant C | 2,932,927 | 580,034 |
| Events in quadrant D | 3,094,236 | 531,160 |
| Mode M0 | |||
|---|---|---|---|
| Quadrant | BADHDUFLAG | Total packets | Discarded packets |
| A | 0 | 12221 | 2 |
| B | 0 | 11444 | 2 |
| C | 0 | 12128 | 2 |
| D | 0 | 13194 | 2 |
| Mode M9 | |||
|---|---|---|---|
| Quadrant | BADHDUFLAG | Total packets | Discarded packets |
| A | 0 | 14 | 0 |
| B | 0 | 14 | 0 |
| C | 0 | 14 | 0 |
| D | 0 | 15 | 0 |
| Mode SS | |||
|---|---|---|---|
| Quadrant | BADHDUFLAG | Total packets | Discarded packets |
| A | 0 | 112 | 0 |
| B | 0 | 112 | 0 |
| C | 0 | 112 | 0 |
| D | 0 | 112 | 0 |
| Quadrant | Total seconds | Saturated seconds | Saturation percentage |
|---|---|---|---|
| A | 5517 | 15 | 0.271887% |
| B | 5517 | 8 | 0.145006% |
| C | 5517 | 33 | 0.598151% |
| D | 5517 | 99 | 1.794454% |
Noise dominated data is calculated using 1-second bins in cleaned event files. If a bin has >2000 counts, and if more than 50% of those come from <1% of pixels, then it is considered to be noise-dominated and hence unusable.
| Quadrant | # 1 sec bins | Bins with >0 counts | Bins with >2000 counts | High rate bins dominated by noise | Noise dominated (total time) | Noise dominated (detector-on time) | Marked lightcurve |
|---|---|---|---|---|---|---|---|
| A | 6798 | 5518 | 12 | 12 | 0.18% | 0.22% | 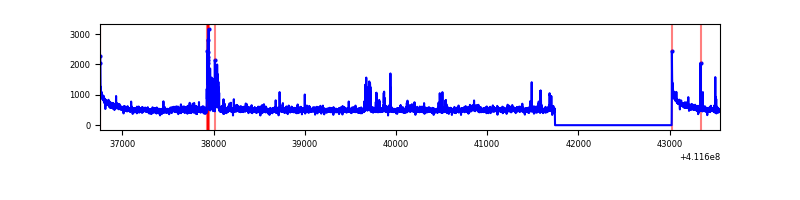 |
| B | 6798 | 5518 | 3 | 3 | 0.04% | 0.05% | 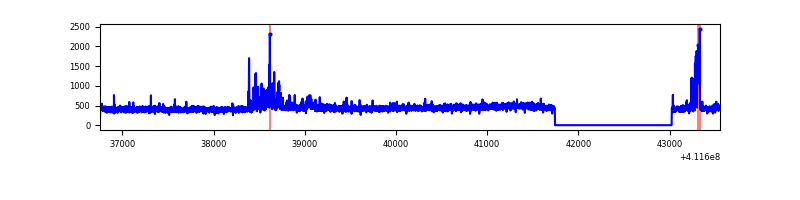 |
| C | 6798 | 5518 | 30 | 30 | 0.44% | 0.54% | 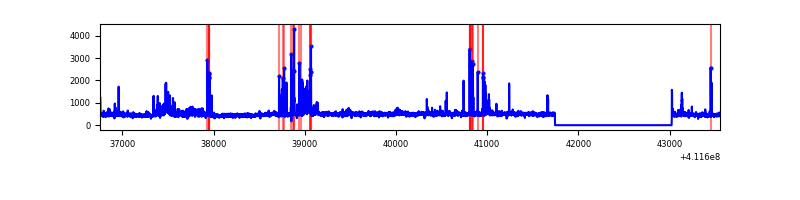 |
| D | 6798 | 5518 | 87 | 87 | 1.28% | 1.58% | 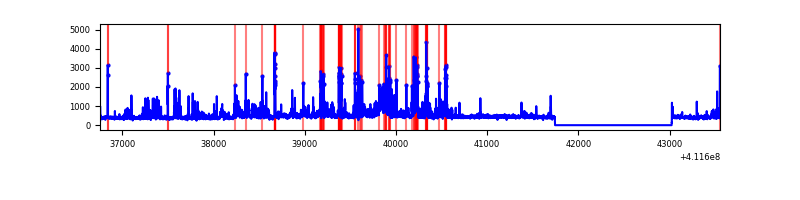 |
Top three noisy pixels from each quadrant. If the there are fewer than three noisy pixels in the level2.evt file, extra rows are filled as -1
| Pixel properties | Quadrant properties | ||||||
|---|---|---|---|---|---|---|---|
| Quadrant | DetID | PixID | Counts | Sigma | Mean | Median | Sigma |
| A | 10 | 83 | 458465 | 3747.78 | 593 | 581 | 122.2 |
| A | 6 | 10 | 209454 | 1709.62 | 593 | 581 | 122.2 |
| A | 2 | 79 | 41739 | 336.88 | 593 | 581 | 122.2 |
| B | 5 | 255 | 85141 | 729.36 | 592 | 576 | 115.9 |
| B | 5 | 172 | 73873 | 632.18 | 592 | 576 | 115.9 |
| B | 12 | 111 | 14406 | 119.28 | 592 | 576 | 115.9 |
| C | 15 | 208 | 391423 | 2893.2 | 577 | 581 | 135.1 |
| C | 15 | 214 | 232961 | 1720.19 | 577 | 581 | 135.1 |
| C | 3 | 233 | 52602 | 385.08 | 577 | 581 | 135.1 |
| D | 12 | 227 | 417352 | 2950.07 | 574 | 556 | 141.3 |
| D | 13 | 249 | 178519 | 1259.62 | 574 | 556 | 141.3 |
| D | 12 | 233 | 160627 | 1132.98 | 574 | 556 | 141.3 |
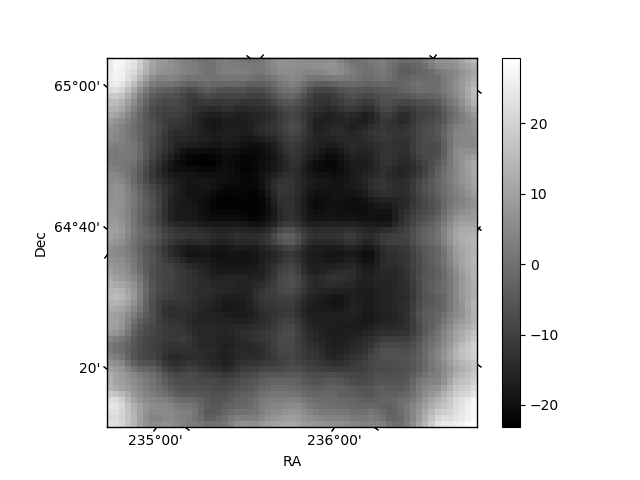
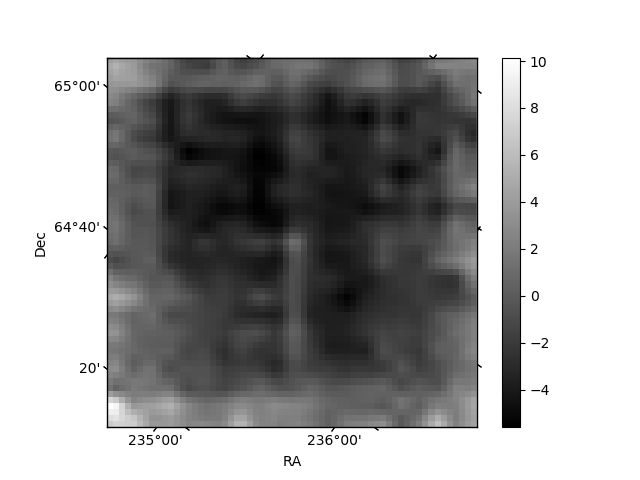
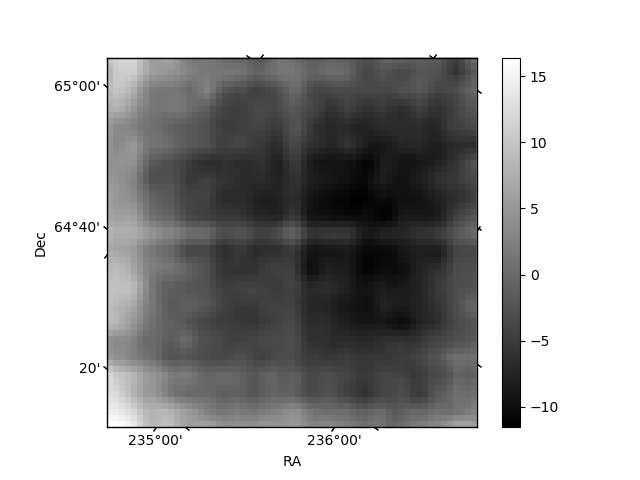
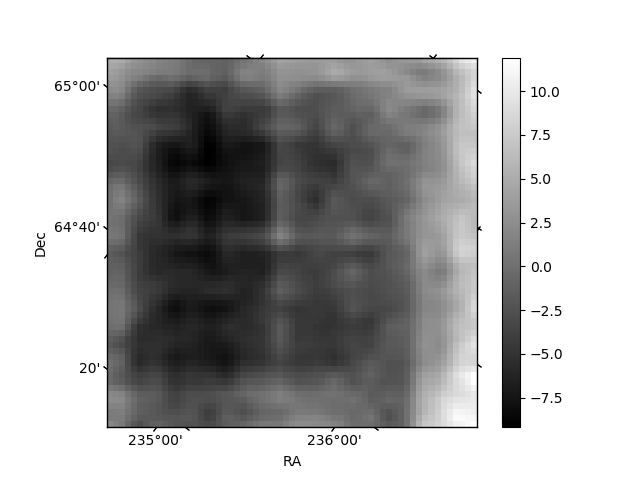
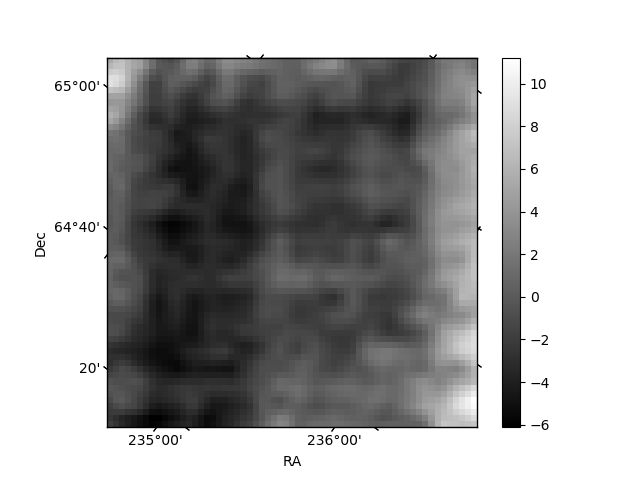
Histogram calculated using DETX and DETY for each event in the final _common_clean file
| Quadrant A | 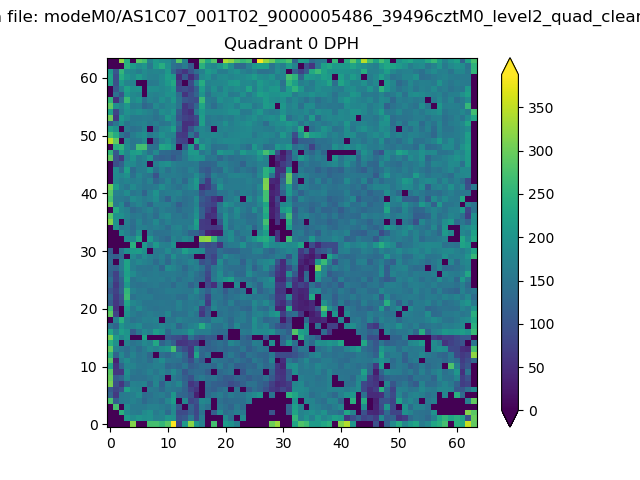 |
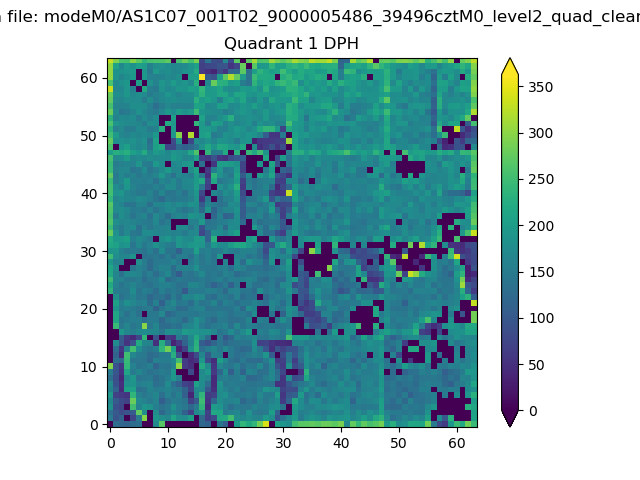 |
Quadrant B |
|---|---|---|---|
| Quadrant D | 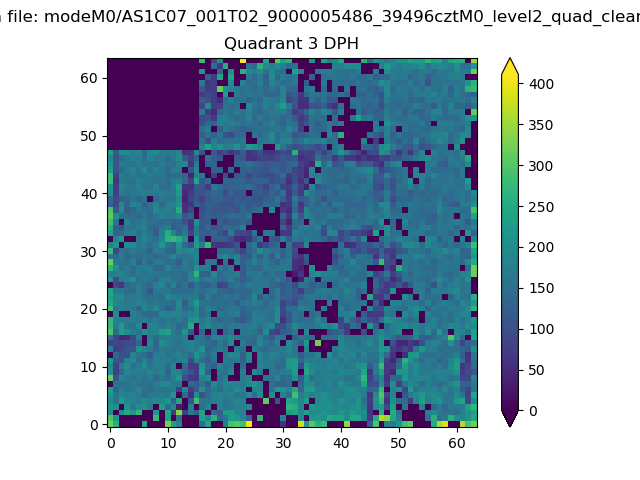 |
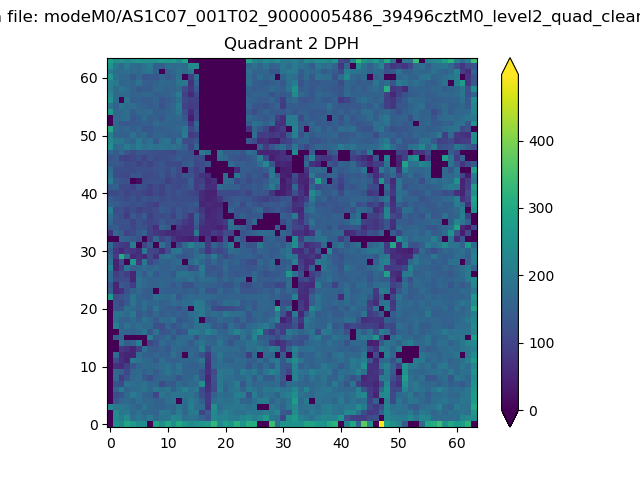 |
Quadrant C |
| Plot type | Count rate plots | Images |
|---|---|---|
| Comparison with Poisson distribution Blue bars denote a histogram of data divided into 1 sec bins. Red curve is a Poisson curve with rate = median count rate of data. |
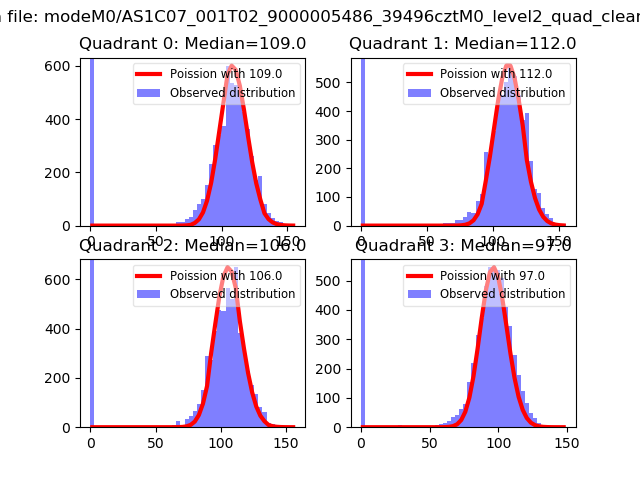 |
 |
| Quadrant-wise count rates Data is divided into 100 sec bins |
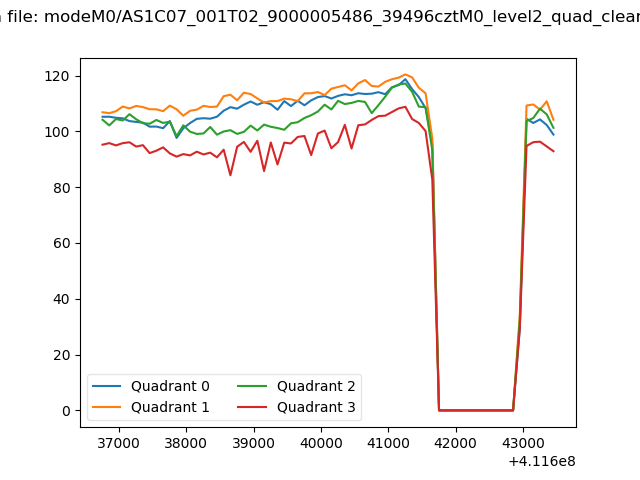 |
|
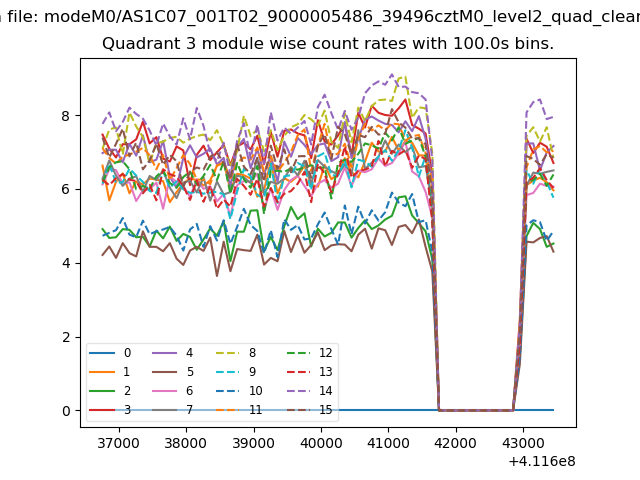
| Module-wise count rates for Quadrant A Data is divided into 100 sec bins |
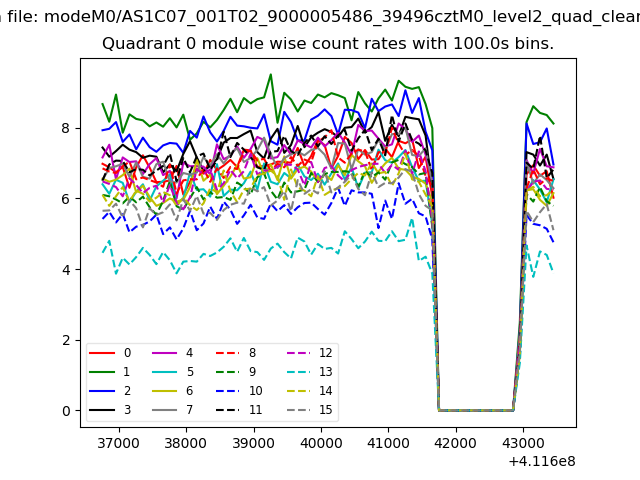 |
 |
| Module-wise count rates for Quadrant B Data is divided into 100 sec bins |
 |
 |
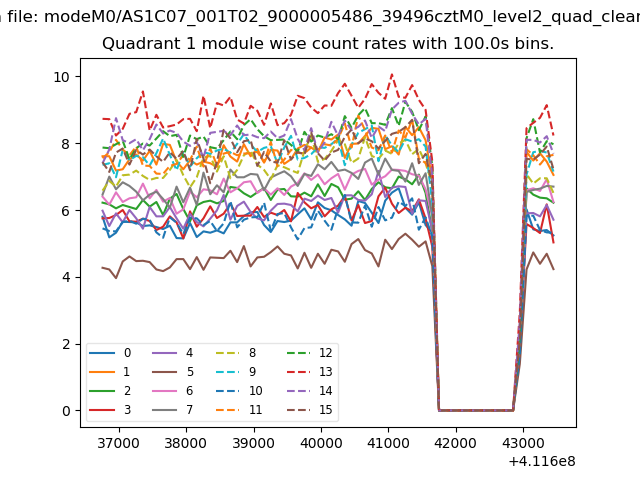
| Module-wise count rates for Quadrant C Data is divided into 100 sec bins |
 |
 |
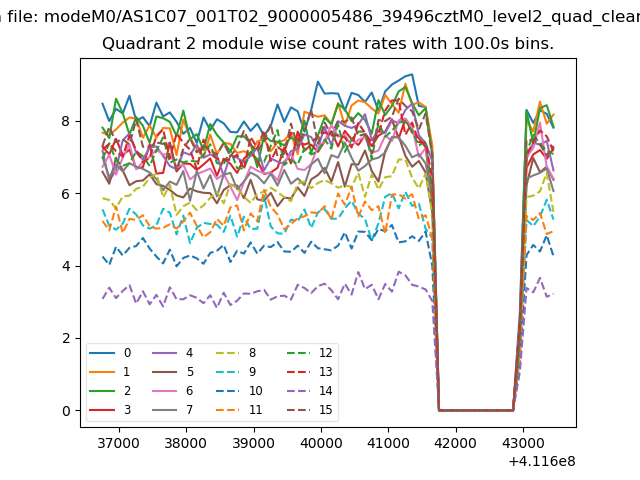
| Module-wise count rates for Quadrant D Data is divided into 100 sec bins |
 |
 |
| Parameter | Plot |
|---|---|
| CZT HV Monitor | 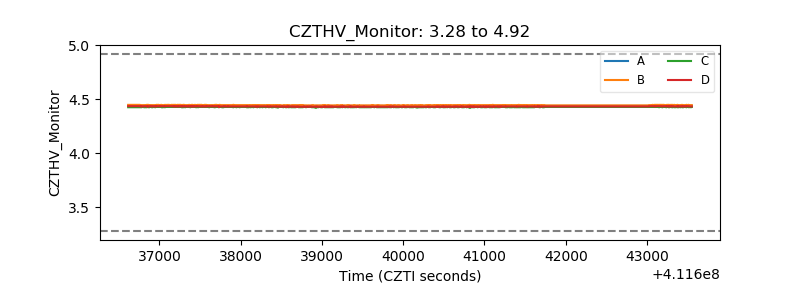 |
| D_VDD | 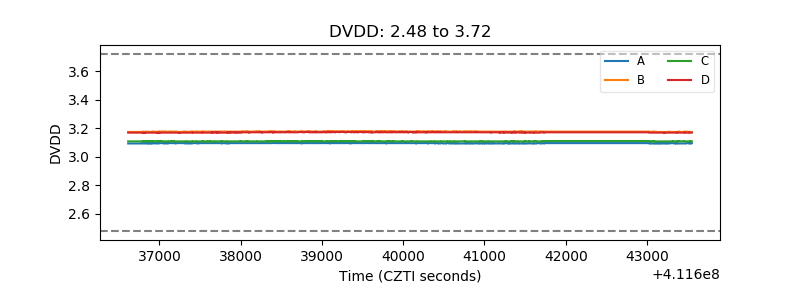 |
| Temperature 1 | 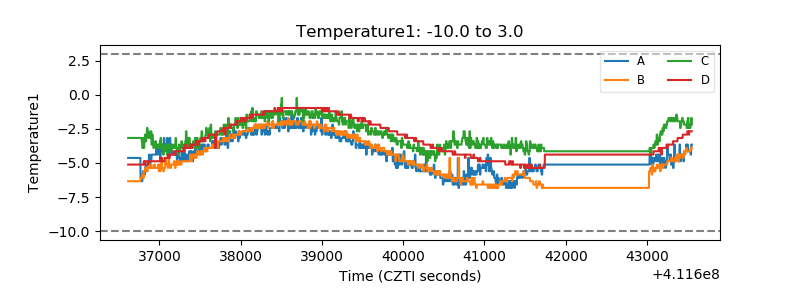 |
| Veto HV Monitor | 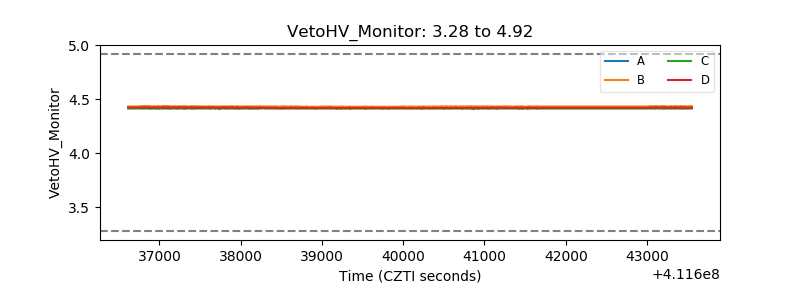 |
| Veto LLD | 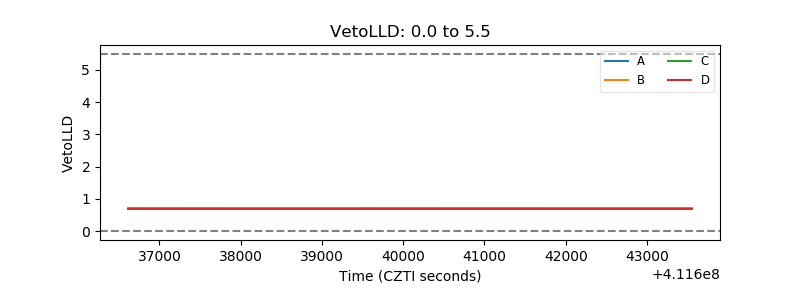 |
| Alpha Counter | 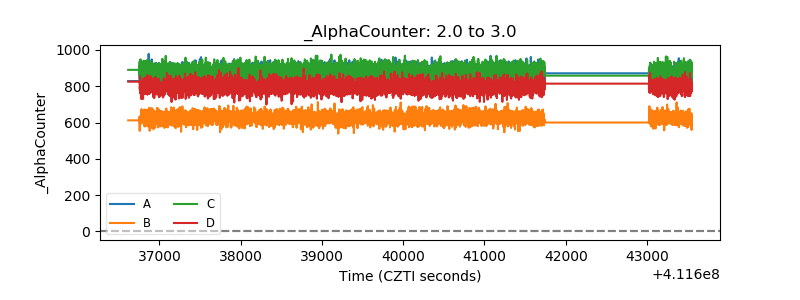 |
| _CPM_Rate | 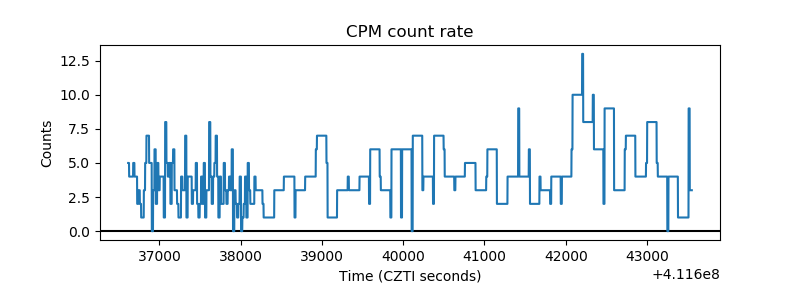 |
| CZT Counter | 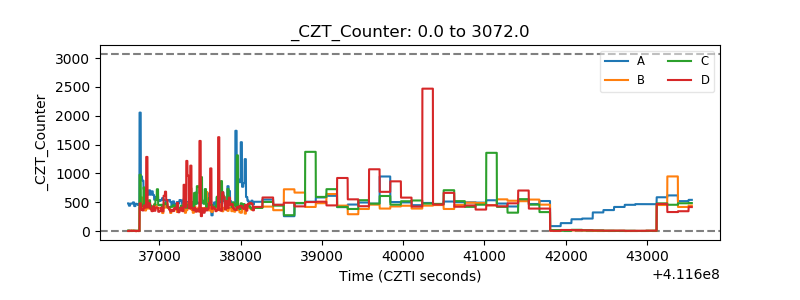 |
| +2.5 Volts monitor | 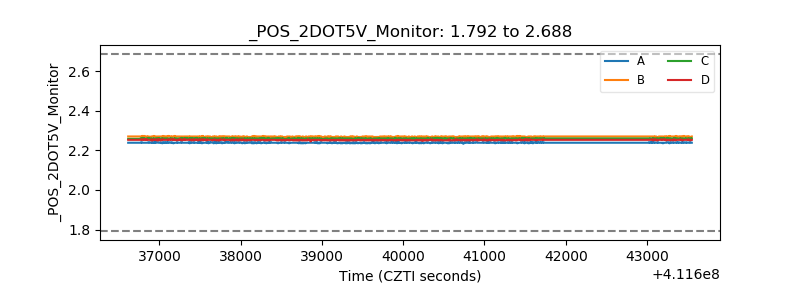 |
| +5 Volts monitor | 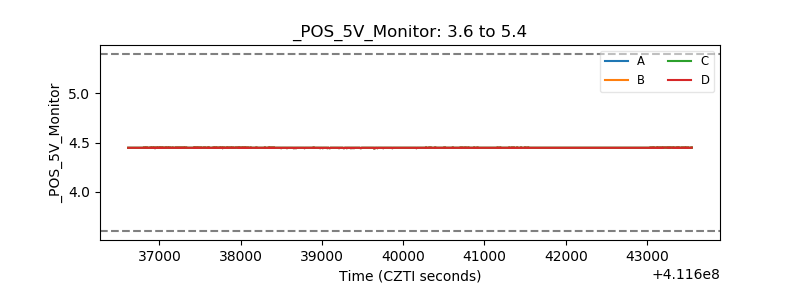 |
| _ROLL_ROT | 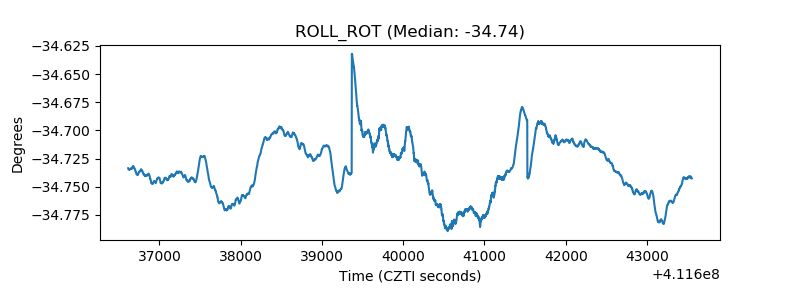 |
| _Roll_DEC | 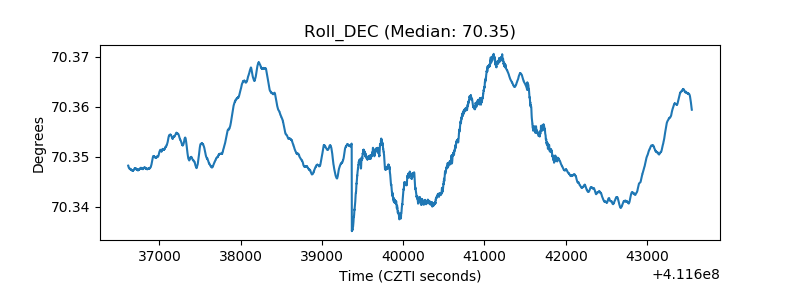 |
| _Roll_RA | 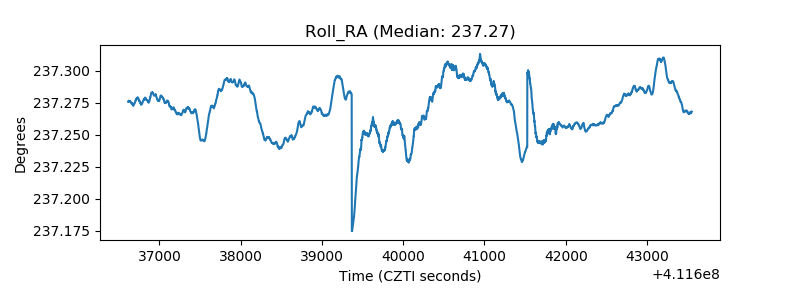 |
| Veto Counter | 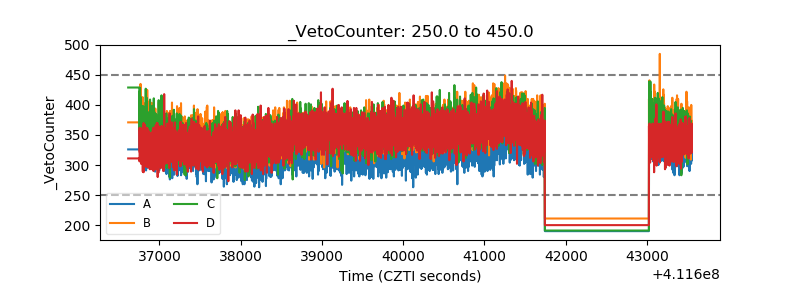 |