| Param | Original file | Final file |
|---|---|---|
| Filename | modeM0/AS1A12_018T01_9000005488_39496cztM0_level2.fits | modeM0/AS1A12_018T01_9000005488_39496cztM0_level2_quad_clean.evt |
| Size (bytes) | 4,374,720 | 532,800 |
| Size | 4.2 MB | 520.3 KB |
| Events in quadrant A | 45,266 | 529 |
| Events in quadrant B | 33,959 | 490 |
| Events in quadrant C | 35,891 | 477 |
| Events in quadrant D | 36,438 | 470 |
| Mode SS | |||
|---|---|---|---|
| Quadrant | BADHDUFLAG | Total packets | Discarded packets |
| A | 0 | 2 | 0 |
| B | 0 | 2 | 0 |
| C | 0 | 2 | 0 |
| D | 0 | 2 | 0 |
| Mode M0 | |||
|---|---|---|---|
| Quadrant | BADHDUFLAG | Total packets | Discarded packets |
| A | 0 | 189 | 1 |
| B | 0 | 166 | 0 |
| C | 0 | 166 | 0 |
| D | 0 | 173 | 0 |
| Quadrant | Total seconds | Saturated seconds | Saturation percentage |
|---|---|---|---|
| A | 83 | 0 | 0.000000% |
| B | 83 | 0 | 0.000000% |
| C | 83 | 0 | 0.000000% |
| D | 83 | 0 | 0.000000% |
Noise dominated data is calculated using 1-second bins in cleaned event files. If a bin has >2000 counts, and if more than 50% of those come from <1% of pixels, then it is considered to be noise-dominated and hence unusable.
| Quadrant | # 1 sec bins | Bins with >0 counts | Bins with >2000 counts | High rate bins dominated by noise | Noise dominated (total time) | Noise dominated (detector-on time) | Marked lightcurve |
|---|---|---|---|---|---|---|---|
| A | 83 | 83 | 0 | 0 | 0.00% | 0.00% | 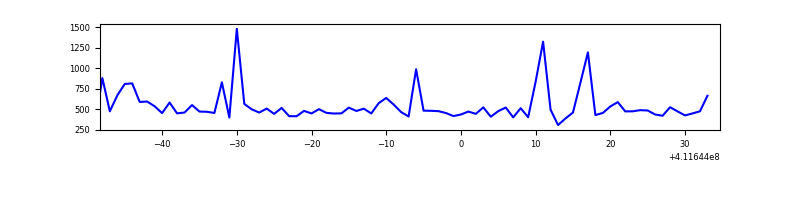 |
| B | 83 | 83 | 0 | 0 | 0.00% | 0.00% | 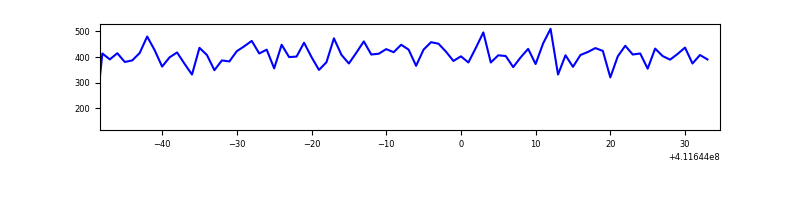 |
| C | 83 | 83 | 0 | 0 | 0.00% | 0.00% | 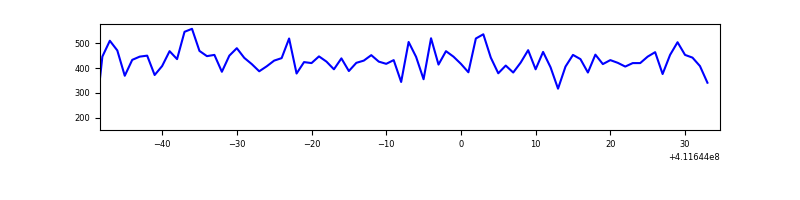 |
| D | 83 | 83 | 0 | 0 | 0.00% | 0.00% | 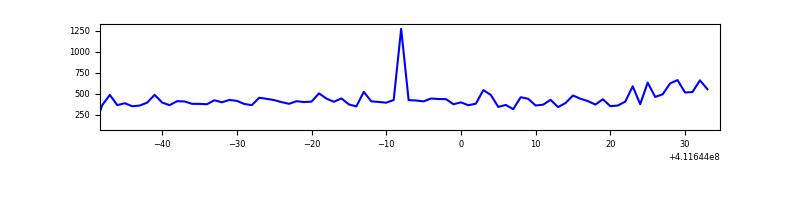 |
Top three noisy pixels from each quadrant. If the there are fewer than three noisy pixels in the level2.evt file, extra rows are filled as -1
| Pixel properties | Quadrant properties | ||||||
|---|---|---|---|---|---|---|---|
| Quadrant | DetID | PixID | Counts | Sigma | Mean | Median | Sigma |
| A | 6 | 10 | 5048 | 1470.83 | 8 | 8 | 3.4 |
| A | 10 | 83 | 4595 | 1338.63 | 8 | 8 | 3.4 |
| A | 2 | 79 | 2152 | 625.68 | 8 | 8 | 3.4 |
| B | 5 | 172 | 440 | 130.15 | 8 | 8 | 3.3 |
| B | 12 | 111 | 204 | 59.05 | 8 | 8 | 3.3 |
| B | 11 | 111 | 190 | 54.83 | 8 | 8 | 3.3 |
| C | 15 | 214 | 3339 | 984.75 | 8 | 8 | 3.4 |
| C | 3 | 233 | 279 | 80.12 | 8 | 8 | 3.4 |
| C | 15 | 208 | 75 | 19.81 | 8 | 8 | 3.4 |
| D | 13 | 249 | 1564 | 441.22 | 8 | 7 | 3.5 |
| D | 2 | 249 | 1208 | 340.34 | 8 | 7 | 3.5 |
| D | 12 | 233 | 1125 | 316.82 | 8 | 7 | 3.5 |
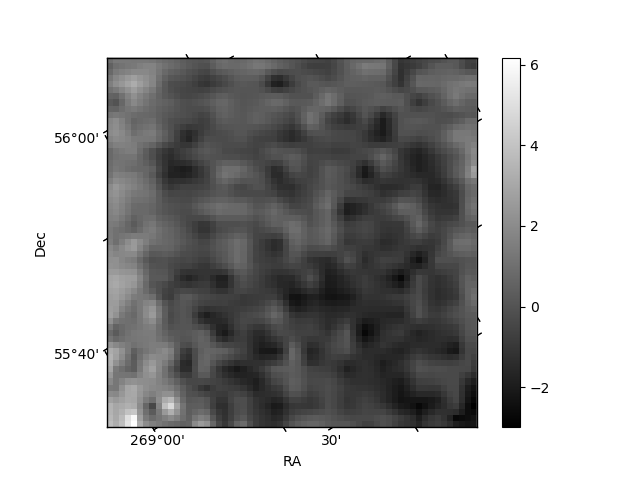
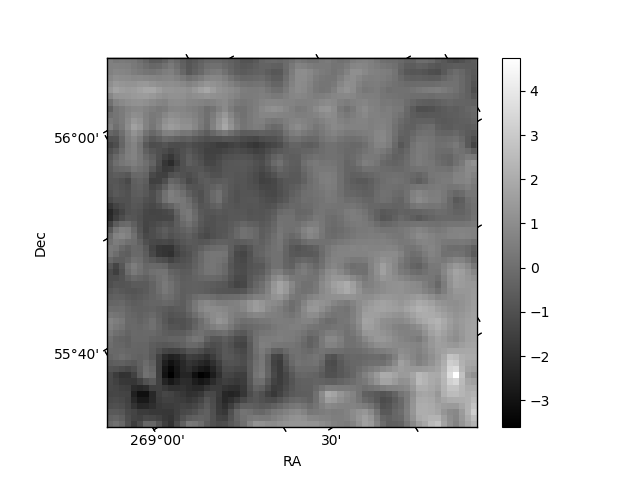
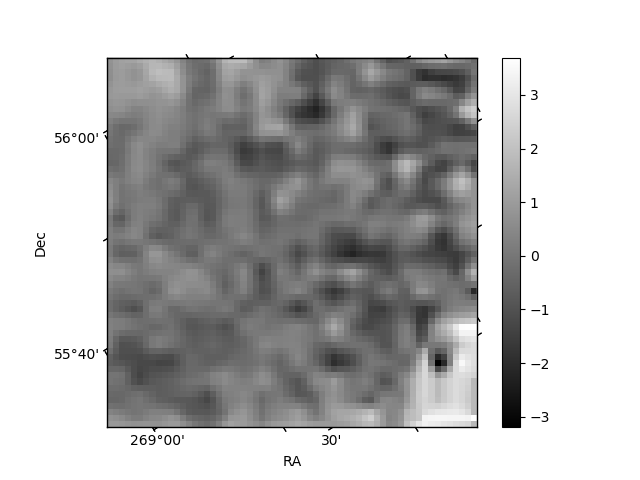
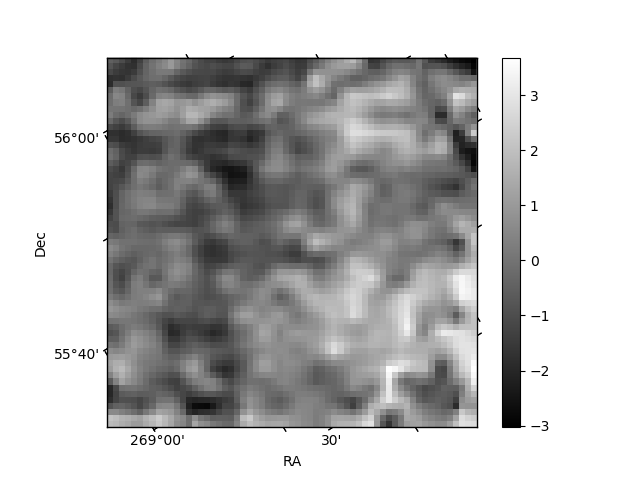
Histogram calculated using DETX and DETY for each event in the final _common_clean file
| Quadrant A | 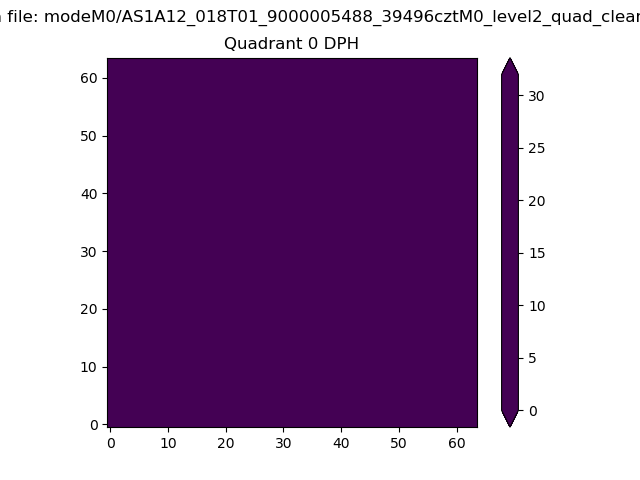 |
 |
Quadrant B |
|---|---|---|---|
| Quadrant D |  |
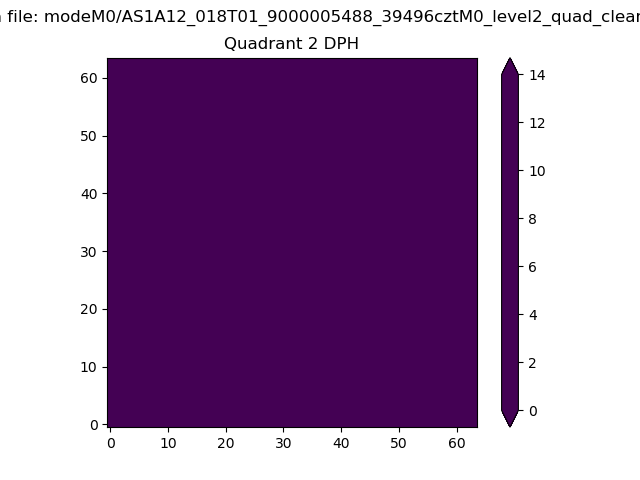 |
Quadrant C |
| Plot type | Count rate plots | Images |
|---|---|---|
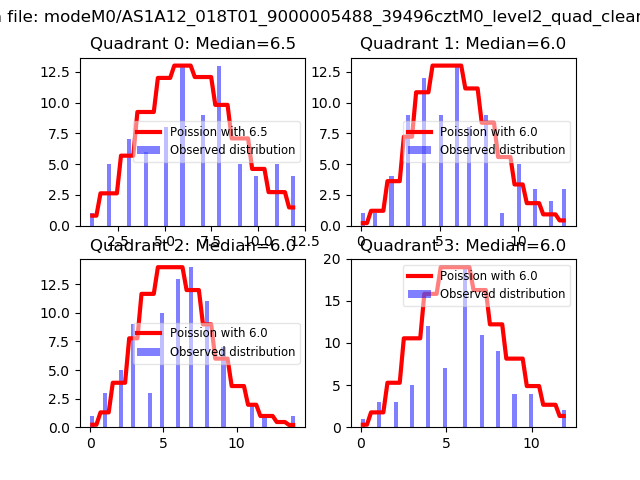
| Comparison with Poisson distribution Blue bars denote a histogram of data divided into 1 sec bins. Red curve is a Poisson curve with rate = median count rate of data. |
 |
 |
| Quadrant-wise count rates Data is divided into 100 sec bins |
 |
|
| Module-wise count rates for Quadrant A Data is divided into 100 sec bins |
 |
 |
| Module-wise count rates for Quadrant B Data is divided into 100 sec bins |
 |
 |
| Module-wise count rates for Quadrant C Data is divided into 100 sec bins |
 |
 |
| Module-wise count rates for Quadrant D Data is divided into 100 sec bins |
 |
 |
| Parameter | Plot |
|---|---|
| CZT HV Monitor | 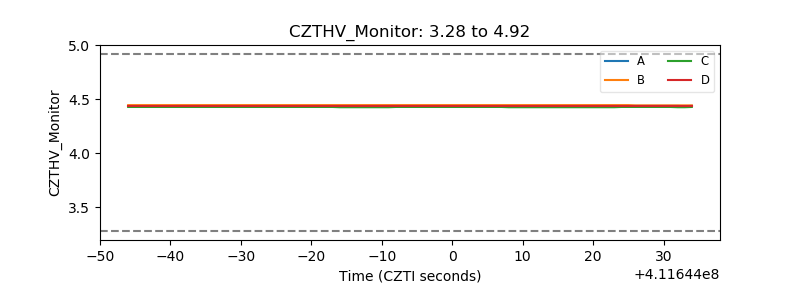 |
| D_VDD | 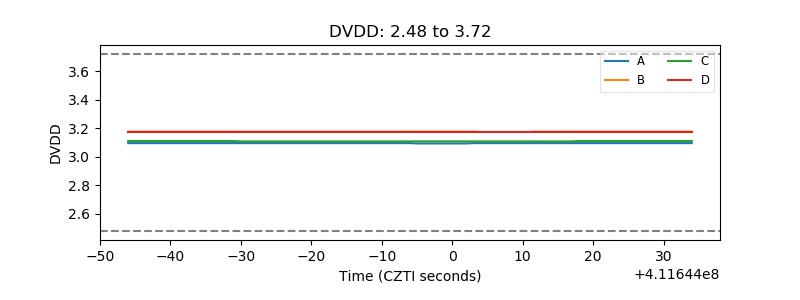 |
| Temperature 1 | 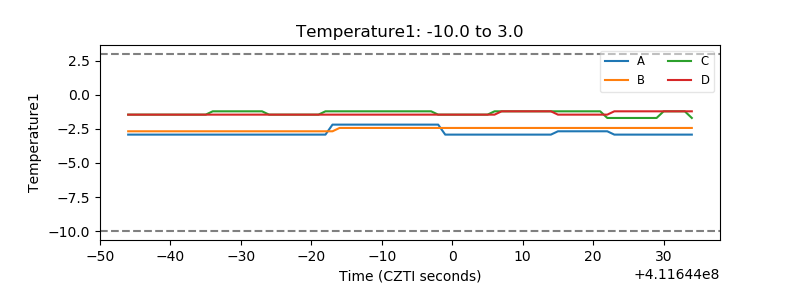 |
| Veto HV Monitor | 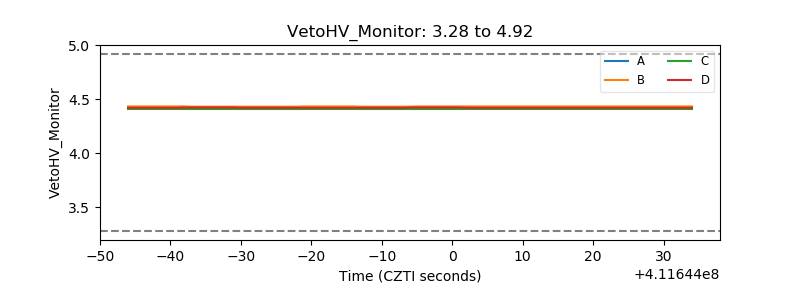 |
| Veto LLD | 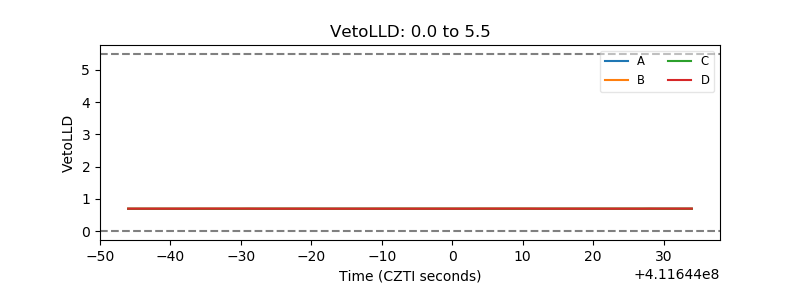 |
| Alpha Counter | 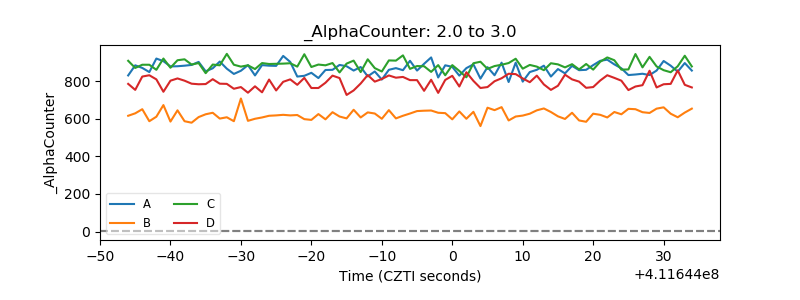 |
| _CPM_Rate | 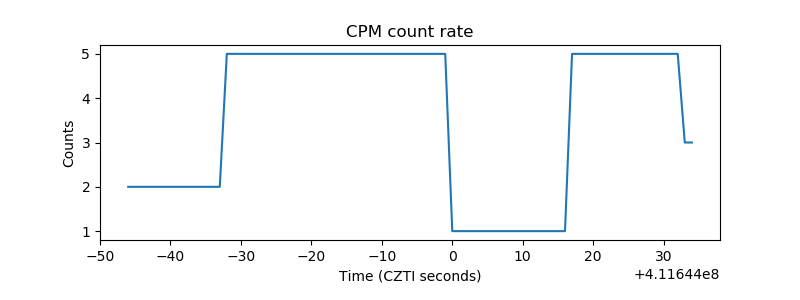 |
| CZT Counter | 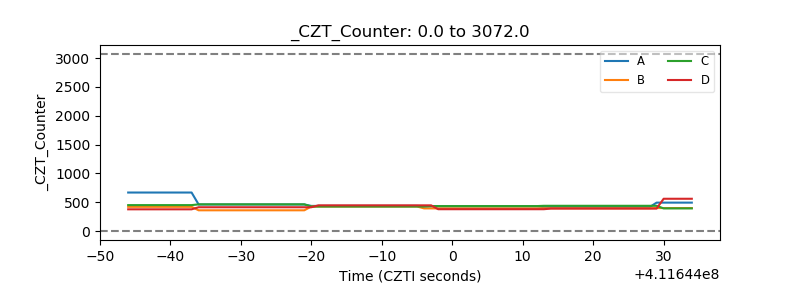 |
| +2.5 Volts monitor | 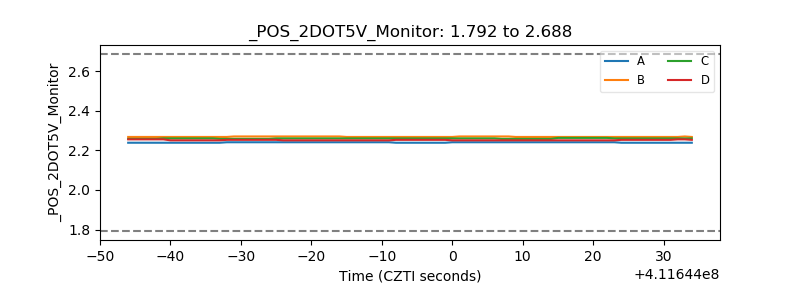 |
| +5 Volts monitor | 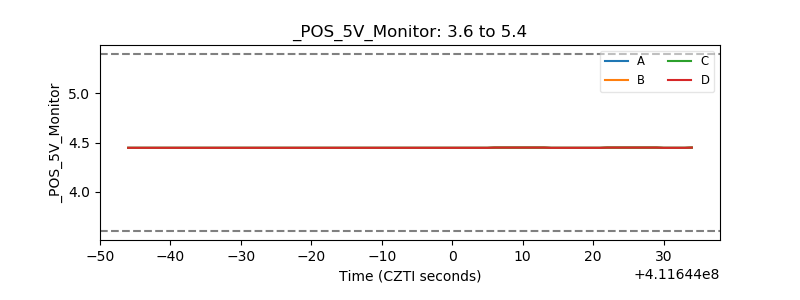 |
| _ROLL_ROT | 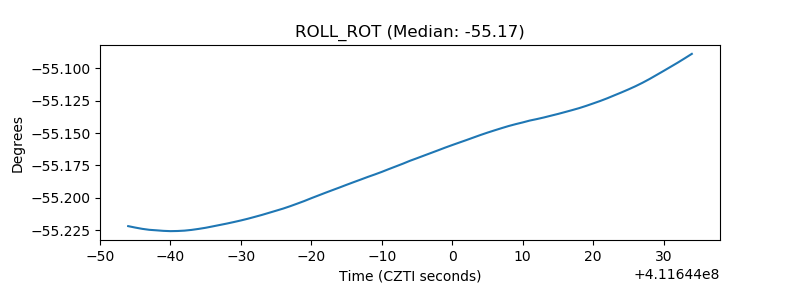 |
| _Roll_DEC | 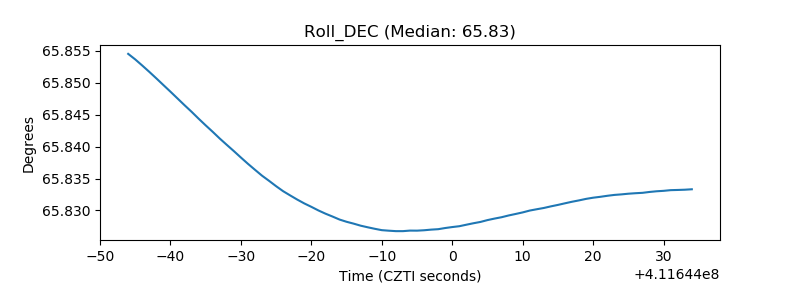 |
| _Roll_RA | 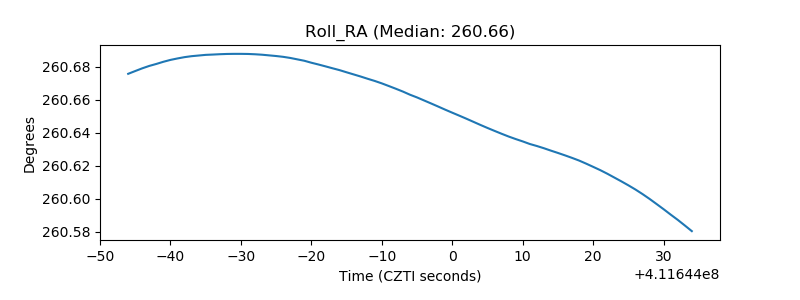 |
| Veto Counter | 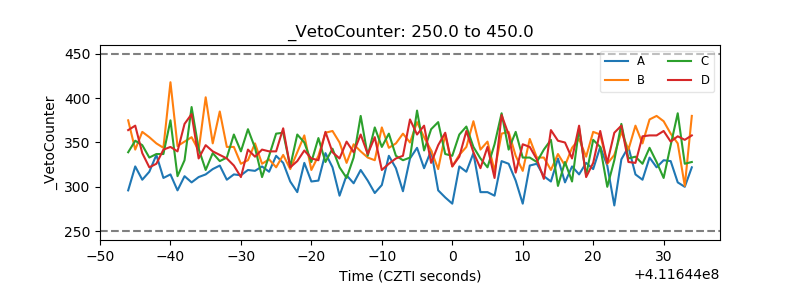 |