| Param | Original file | Final file |
|---|---|---|
| Filename | modeM0/AS1A12_018T01_9000005488_39498cztM0_level2.fits | modeM0/AS1A12_018T01_9000005488_39498cztM0_level2_quad_clean.evt |
| Size (bytes) | 571,993,920 | 160,410,240 |
| Size | 545.5 MB | 153.0 MB |
| Events in quadrant A | 5,346,170 | 1,071,824 |
| Events in quadrant B | 4,632,458 | 1,109,000 |
| Events in quadrant C | 4,680,698 | 1,039,041 |
| Events in quadrant D | 5,743,197 | 948,697 |
| Mode SS | |||
|---|---|---|---|
| Quadrant | BADHDUFLAG | Total packets | Discarded packets |
| A | 0 | 204 | 0 |
| B | 0 | 204 | 0 |
| C | 0 | 204 | 0 |
| D | 0 | 204 | 0 |
| Mode M0 | |||
|---|---|---|---|
| Quadrant | BADHDUFLAG | Total packets | Discarded packets |
| A | 0 | 21857 | 3 |
| B | 0 | 20671 | 2 |
| C | 0 | 20207 | 2 |
| D | 0 | 24036 | 2 |
| Mode M9 | |||
|---|---|---|---|
| Quadrant | BADHDUFLAG | Total packets | Discarded packets |
| A | 0 | 27 | 0 |
| B | 0 | 27 | 0 |
| C | 0 | 27 | 0 |
| D | 0 | 27 | 0 |
| Quadrant | Total seconds | Saturated seconds | Saturation percentage |
|---|---|---|---|
| A | 9927 | 139 | 1.400222% |
| B | 9927 | 32 | 0.322353% |
| C | 9927 | 5 | 0.050368% |
| D | 9927 | 257 | 2.588899% |
Noise dominated data is calculated using 1-second bins in cleaned event files. If a bin has >2000 counts, and if more than 50% of those come from <1% of pixels, then it is considered to be noise-dominated and hence unusable.
| Quadrant | # 1 sec bins | Bins with >0 counts | Bins with >2000 counts | High rate bins dominated by noise | Noise dominated (total time) | Noise dominated (detector-on time) | Marked lightcurve |
|---|---|---|---|---|---|---|---|
| A | 12702 | 9929 | 103 | 103 | 0.81% | 1.04% | 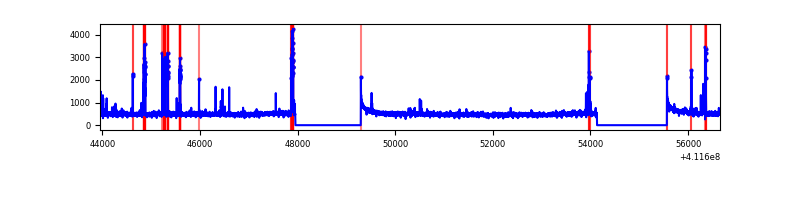 |
| B | 12702 | 9929 | 15 | 15 | 0.12% | 0.15% | 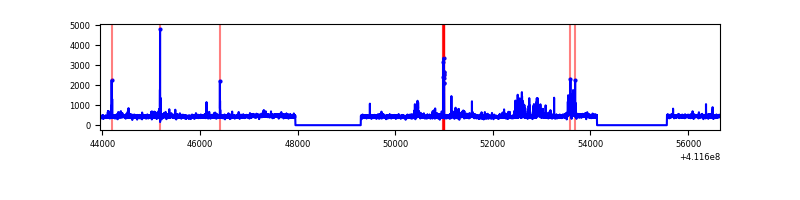 |
| C | 12702 | 9929 | 3 | 3 | 0.02% | 0.03% | 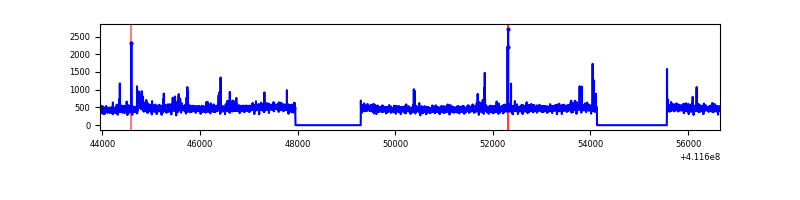 |
| D | 12702 | 9929 | 204 | 204 | 1.61% | 2.05% | 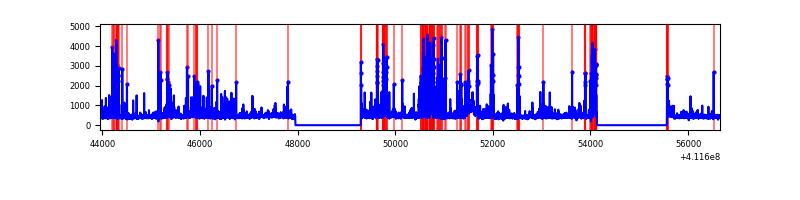 |
Top three noisy pixels from each quadrant. If the there are fewer than three noisy pixels in the level2.evt file, extra rows are filled as -1
| Pixel properties | Quadrant properties | ||||||
|---|---|---|---|---|---|---|---|
| Quadrant | DetID | PixID | Counts | Sigma | Mean | Median | Sigma |
| A | 10 | 83 | 686801 | 3144.24 | 1078 | 1056 | 218.1 |
| A | 15 | 174 | 151949 | 691.87 | 1078 | 1056 | 218.1 |
| A | 2 | 79 | 146702 | 667.81 | 1078 | 1056 | 218.1 |
| B | 5 | 255 | 274126 | 1315.03 | 1075 | 1043 | 207.7 |
| B | 0 | 186 | 38215 | 179.0 | 1075 | 1043 | 207.7 |
| B | 0 | 213 | 32806 | 152.95 | 1075 | 1043 | 207.7 |
| C | 15 | 214 | 408902 | 1649.92 | 1057 | 1062 | 247.2 |
| C | 15 | 208 | 61014 | 242.54 | 1057 | 1062 | 247.2 |
| C | 3 | 233 | 43272 | 170.76 | 1057 | 1062 | 247.2 |
| D | 13 | 249 | 646430 | 2492.88 | 1047 | 1014 | 258.9 |
| D | 7 | 38 | 489704 | 1887.54 | 1047 | 1014 | 258.9 |
| D | 2 | 249 | 190726 | 732.75 | 1047 | 1014 | 258.9 |
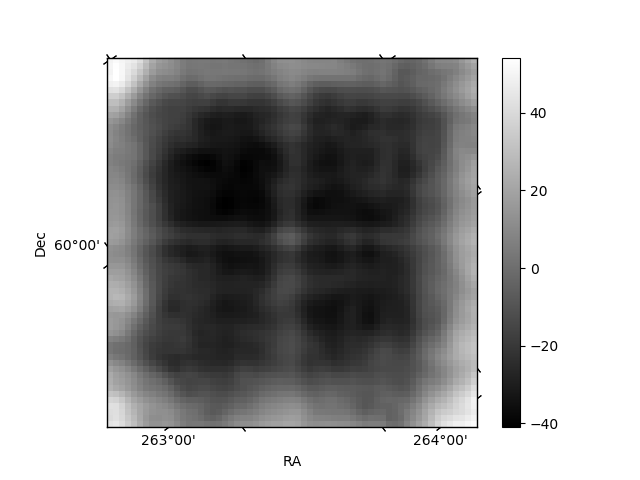
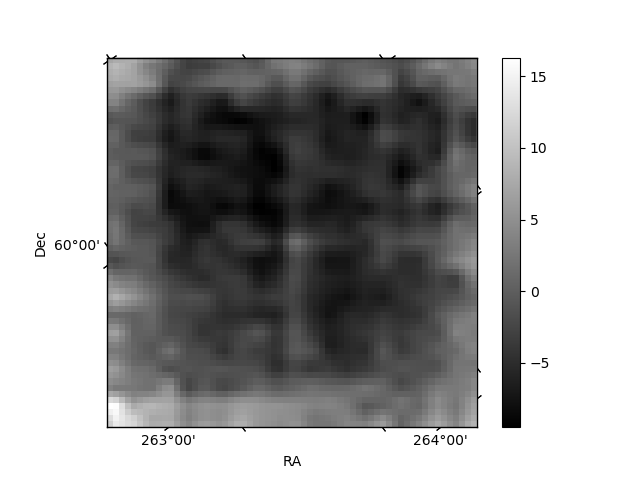
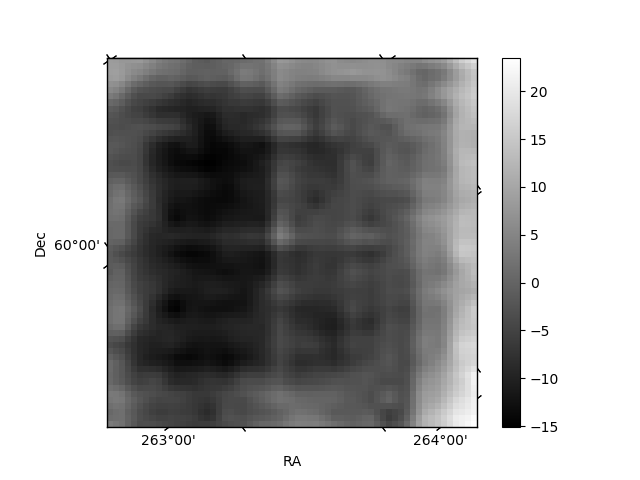
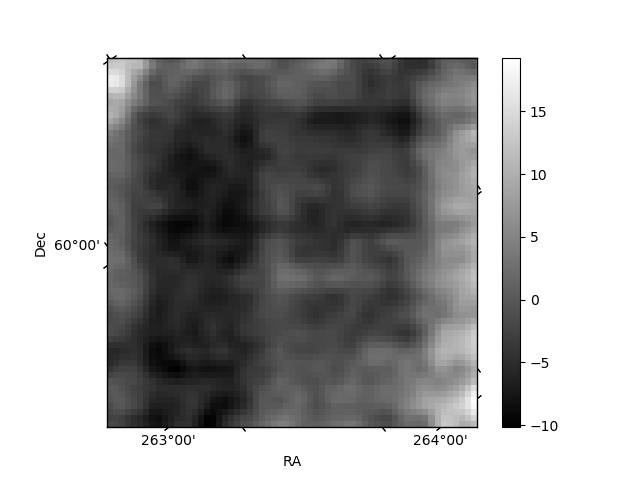
Histogram calculated using DETX and DETY for each event in the final _common_clean file
| Quadrant A | 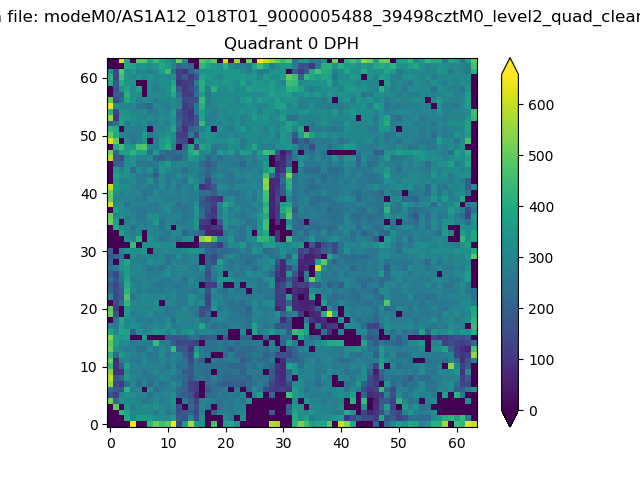 |
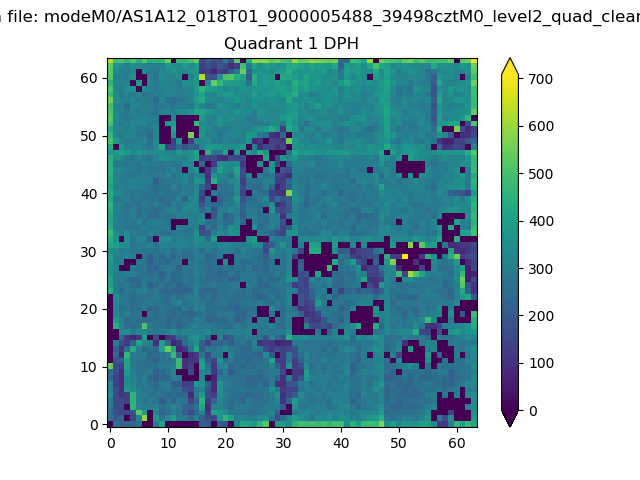 |
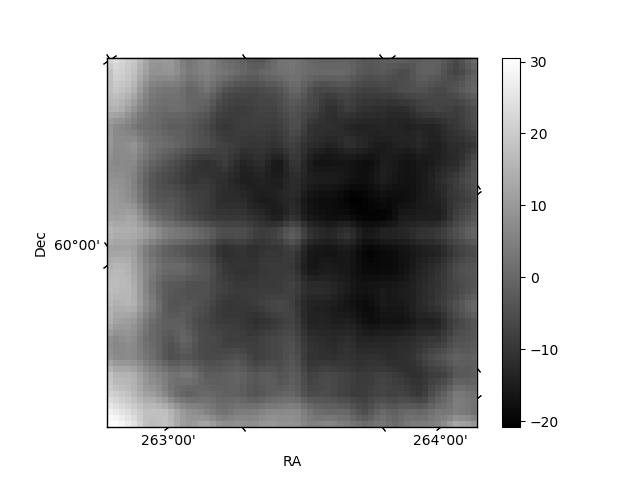
Quadrant B |
|---|---|---|---|
| Quadrant D | 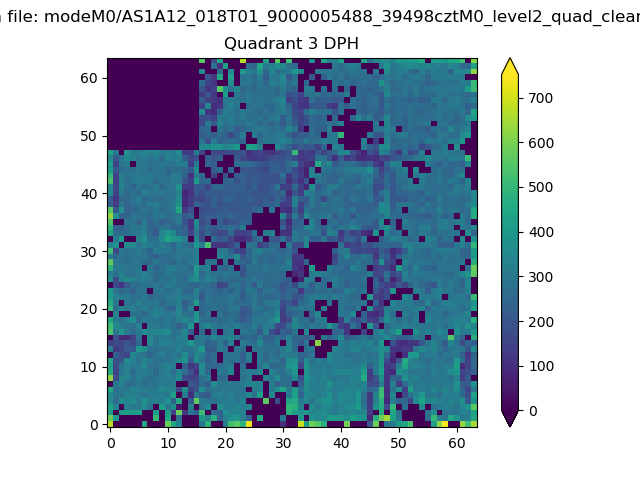 |
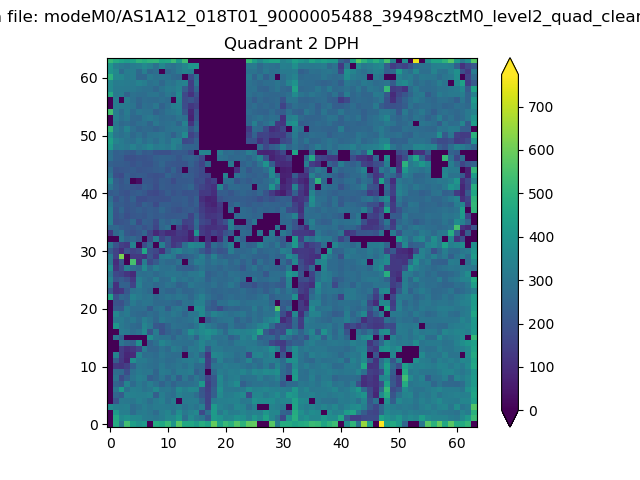 |
Quadrant C |
| Plot type | Count rate plots | Images |
|---|---|---|
| Comparison with Poisson distribution Blue bars denote a histogram of data divided into 1 sec bins. Red curve is a Poisson curve with rate = median count rate of data. |
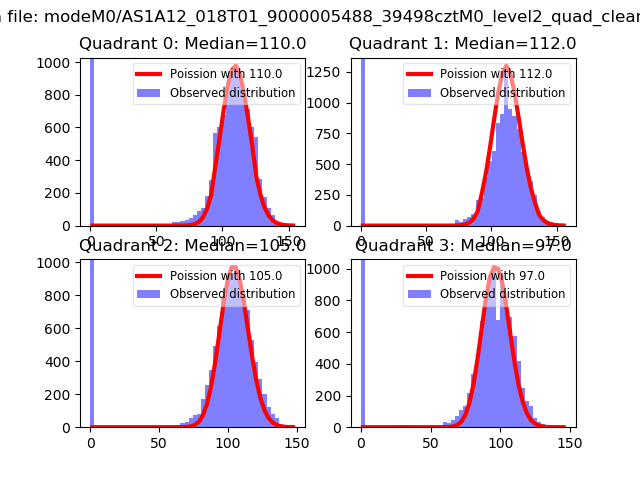 |
 |
| Quadrant-wise count rates Data is divided into 100 sec bins |
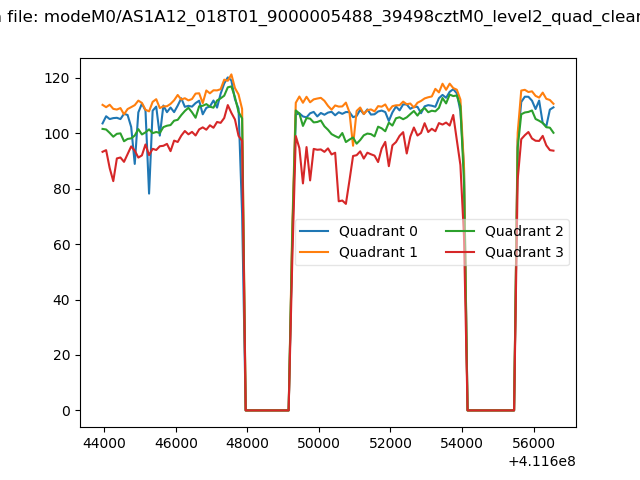 |
|
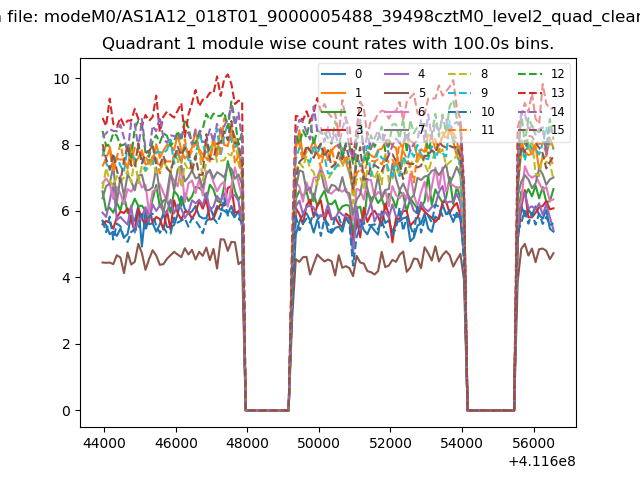
| Module-wise count rates for Quadrant A Data is divided into 100 sec bins |
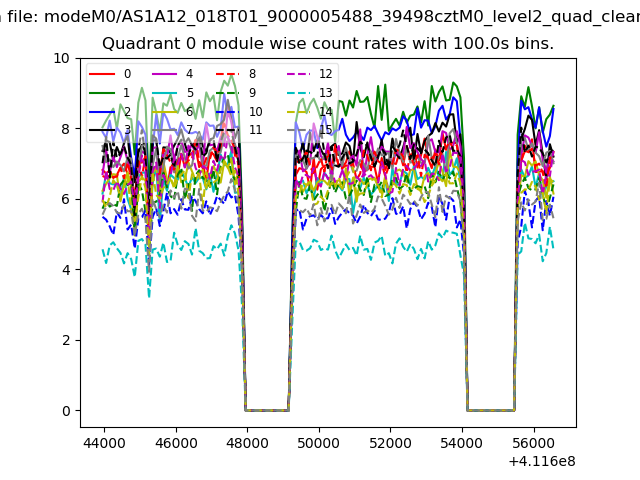 |
 |
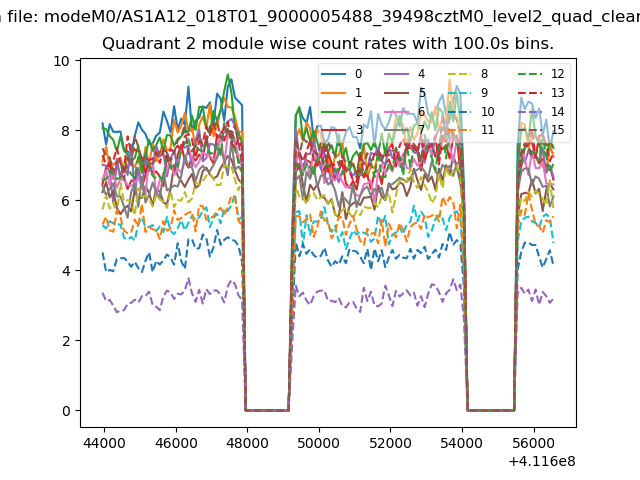
| Module-wise count rates for Quadrant B Data is divided into 100 sec bins |
 |
 |
| Module-wise count rates for Quadrant C Data is divided into 100 sec bins |
 |
 |
| Module-wise count rates for Quadrant D Data is divided into 100 sec bins |
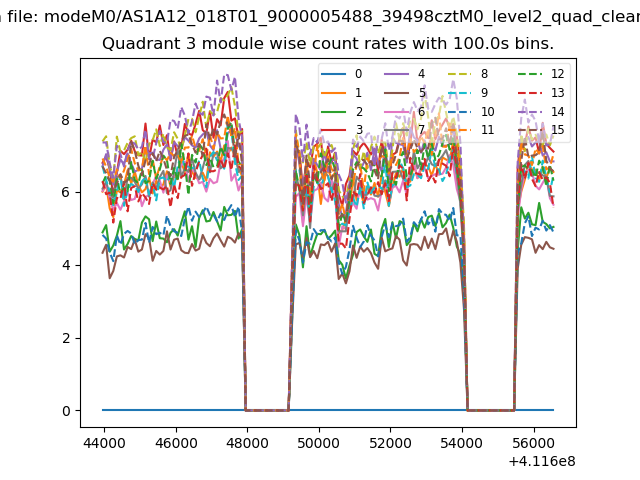 |
 |
| Parameter | Plot |
|---|---|
| CZT HV Monitor | 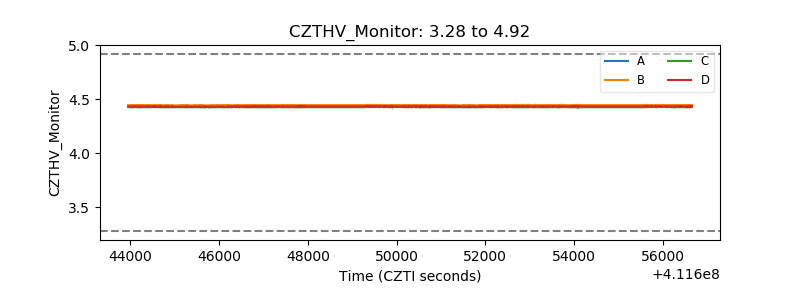 |
| D_VDD | 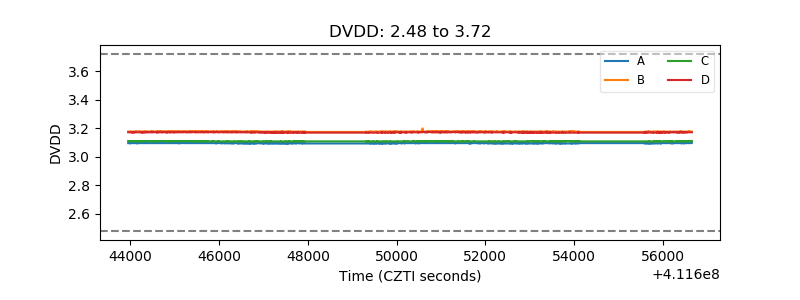 |
| Temperature 1 | 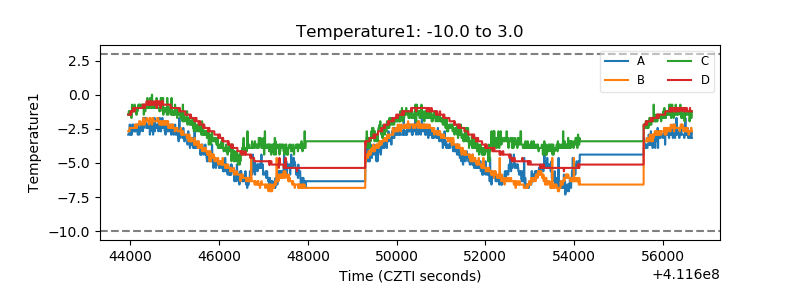 |
| Veto HV Monitor | 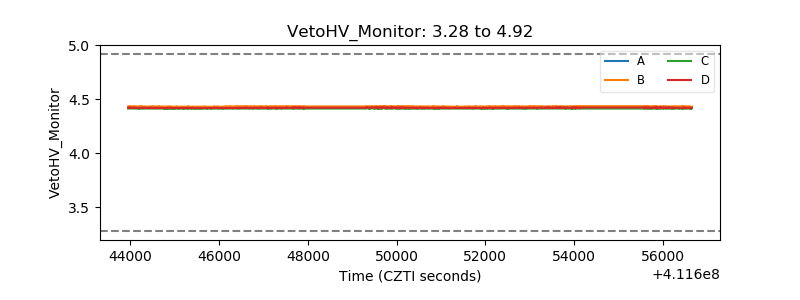 |
| Veto LLD | 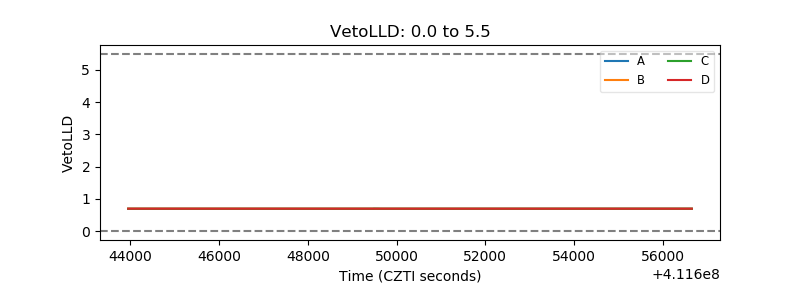 |
| Alpha Counter | 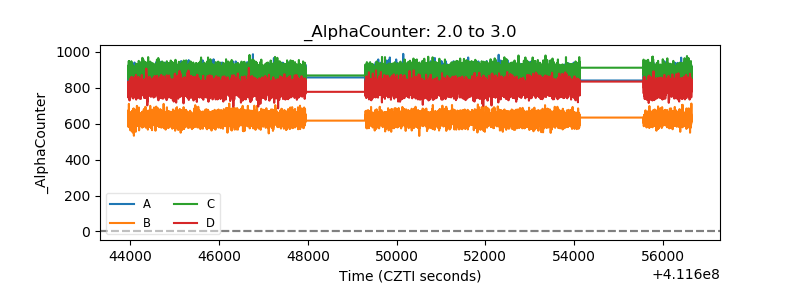 |
| _CPM_Rate | 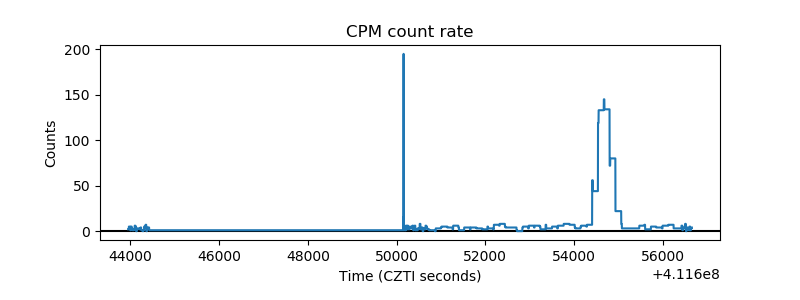 |
| CZT Counter | 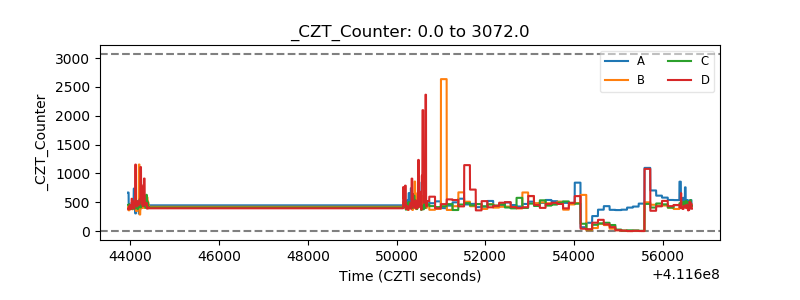 |
| +2.5 Volts monitor | 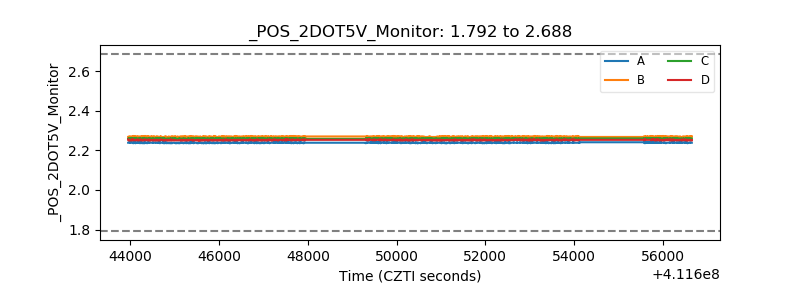 |
| +5 Volts monitor | 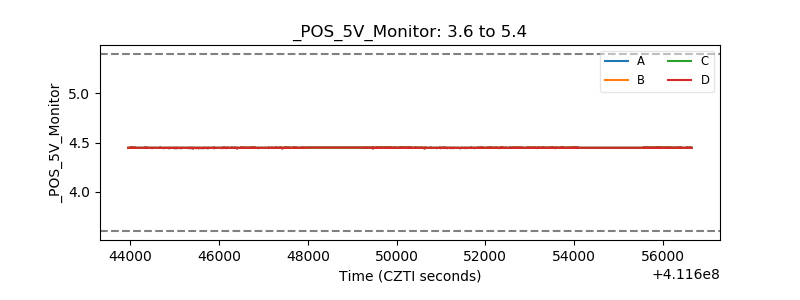 |
| _ROLL_ROT | 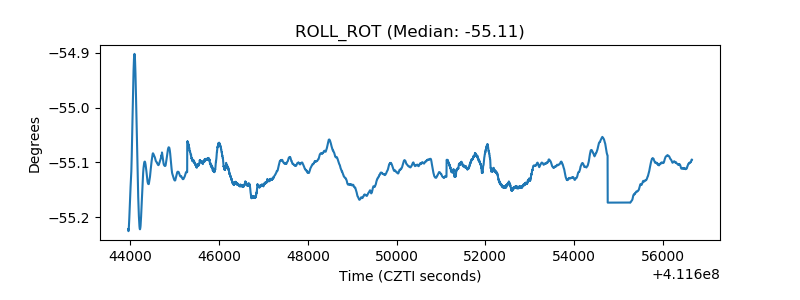 |
| _Roll_DEC | 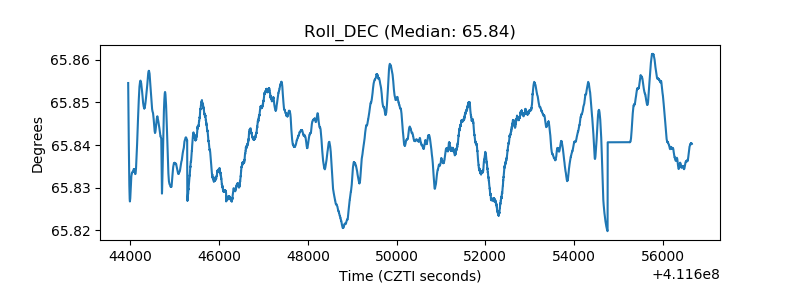 |
| _Roll_RA | 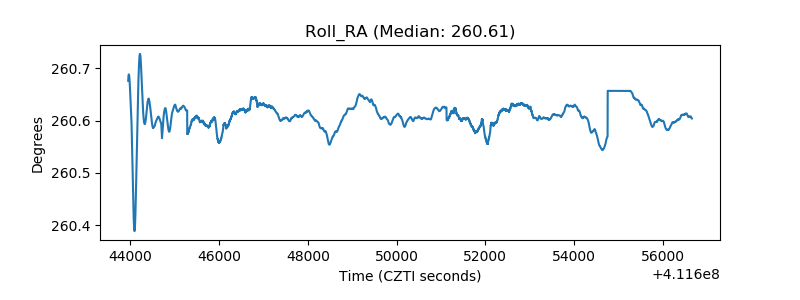 |
| Veto Counter | 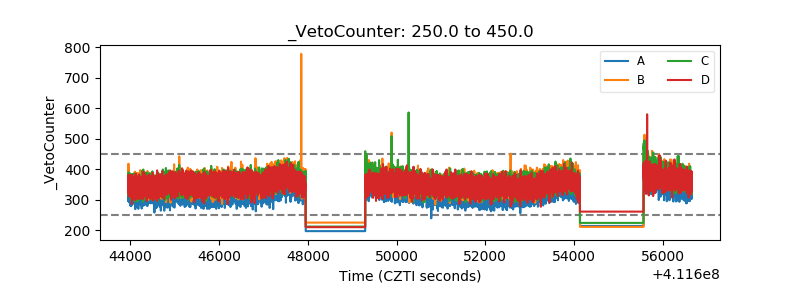 |