| Param | Original file | Final file |
|---|---|---|
| Filename | modeM0/AS1A12_018T01_9000005488_39500cztM0_level2.fits | modeM0/AS1A12_018T01_9000005488_39500cztM0_level2_quad_clean.evt |
| Size (bytes) | 312,189,120 | 92,568,960 |
| Size | 297.7 MB | 88.3 MB |
| Events in quadrant A | 2,999,132 | 624,203 |
| Events in quadrant B | 2,435,511 | 637,471 |
| Events in quadrant C | 2,602,491 | 603,611 |
| Events in quadrant D | 3,088,032 | 550,986 |
| Mode SS | |||
|---|---|---|---|
| Quadrant | BADHDUFLAG | Total packets | Discarded packets |
| A | 0 | 112 | 0 |
| B | 0 | 112 | 0 |
| C | 0 | 112 | 0 |
| D | 0 | 112 | 0 |
| Mode M0 | |||
|---|---|---|---|
| Quadrant | BADHDUFLAG | Total packets | Discarded packets |
| A | 0 | 12615 | 3 |
| B | 0 | 11184 | 2 |
| C | 0 | 11219 | 2 |
| D | 0 | 13025 | 2 |
| Mode M9 | |||
|---|---|---|---|
| Quadrant | BADHDUFLAG | Total packets | Discarded packets |
| A | 0 | 22 | 0 |
| B | 0 | 22 | 0 |
| C | 0 | 22 | 0 |
| D | 0 | 23 | 0 |
| Quadrant | Total seconds | Saturated seconds | Saturation percentage |
|---|---|---|---|
| A | 5528 | 17 | 0.307525% |
| B | 5528 | 5 | 0.090449% |
| C | 5528 | 4 | 0.072359% |
| D | 5528 | 132 | 2.387844% |
Noise dominated data is calculated using 1-second bins in cleaned event files. If a bin has >2000 counts, and if more than 50% of those come from <1% of pixels, then it is considered to be noise-dominated and hence unusable.
| Quadrant | # 1 sec bins | Bins with >0 counts | Bins with >2000 counts | High rate bins dominated by noise | Noise dominated (total time) | Noise dominated (detector-on time) | Marked lightcurve |
|---|---|---|---|---|---|---|---|
| A | 7231 | 5529 | 11 | 11 | 0.15% | 0.20% | 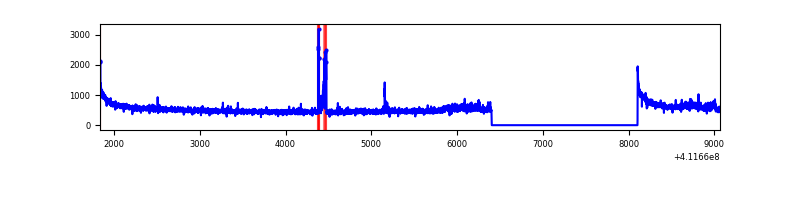 |
| B | 7231 | 5529 | 0 | 0 | 0.00% | 0.00% | 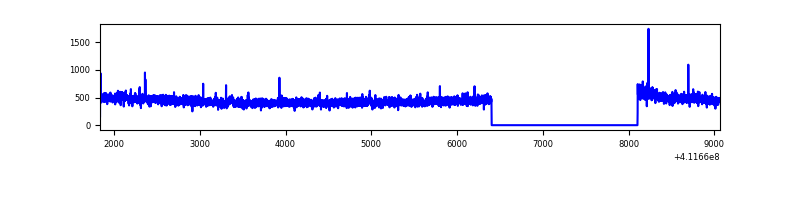 |
| C | 7231 | 5529 | 1 | 1 | 0.01% | 0.02% | 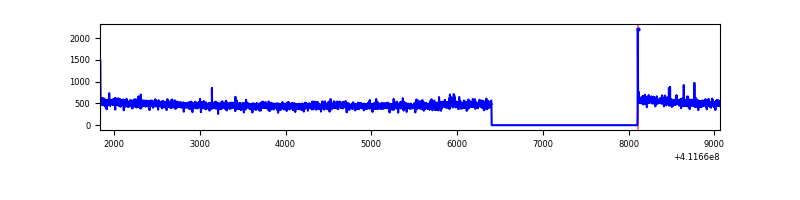 |
| D | 7231 | 5529 | 98 | 98 | 1.36% | 1.77% | 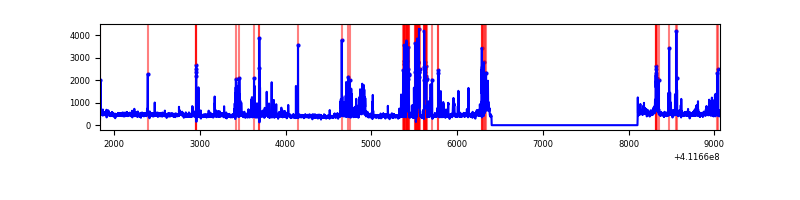 |
Top three noisy pixels from each quadrant. If the there are fewer than three noisy pixels in the level2.evt file, extra rows are filled as -1
| Pixel properties | Quadrant properties | ||||||
|---|---|---|---|---|---|---|---|
| Quadrant | DetID | PixID | Counts | Sigma | Mean | Median | Sigma |
| A | 10 | 83 | 456892 | 3668.69 | 607 | 594 | 124.4 |
| A | 6 | 10 | 94422 | 754.39 | 607 | 594 | 124.4 |
| A | 15 | 174 | 68693 | 547.52 | 607 | 594 | 124.4 |
| B | 0 | 213 | 26152 | 218.62 | 607 | 591 | 116.9 |
| B | 12 | 111 | 14654 | 120.28 | 607 | 591 | 116.9 |
| B | 11 | 111 | 13460 | 110.07 | 607 | 591 | 116.9 |
| C | 15 | 214 | 231781 | 1661.07 | 598 | 601 | 139.2 |
| C | 3 | 233 | 27777 | 195.26 | 598 | 601 | 139.2 |
| C | 0 | 10 | 8044 | 53.48 | 598 | 601 | 139.2 |
| D | 13 | 249 | 407672 | 2803.45 | 590 | 572 | 145.2 |
| D | 2 | 249 | 156142 | 1071.32 | 590 | 572 | 145.2 |
| D | 12 | 227 | 155902 | 1069.66 | 590 | 572 | 145.2 |
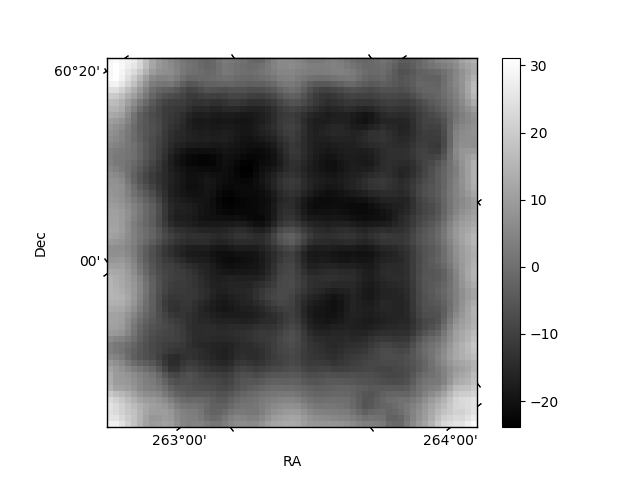
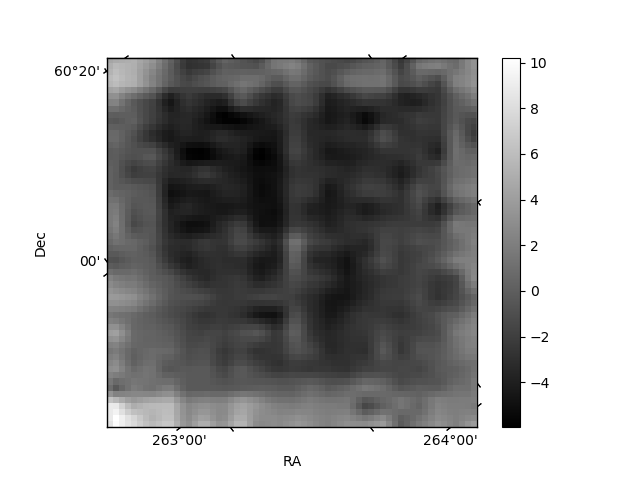
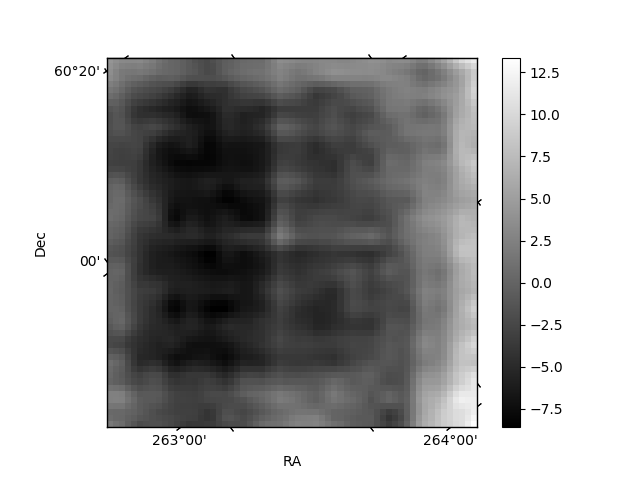
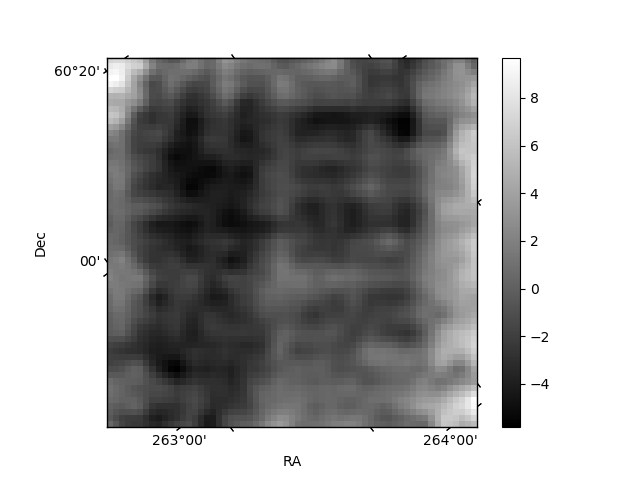
Histogram calculated using DETX and DETY for each event in the final _common_clean file
| Quadrant A | 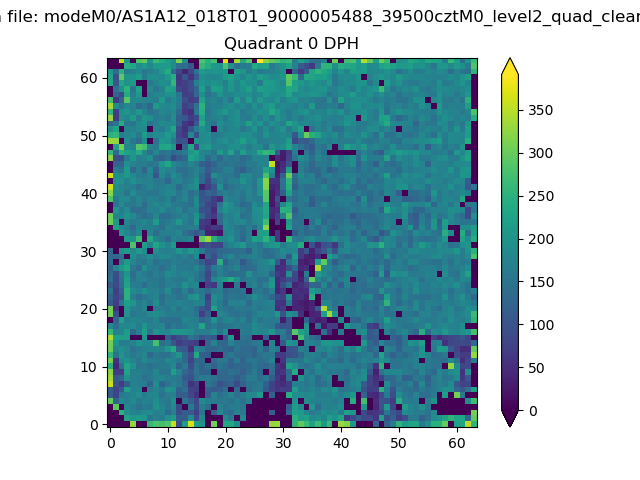 |
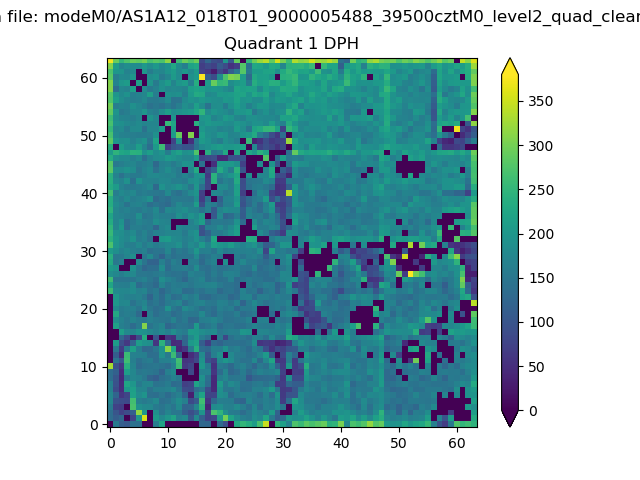 |
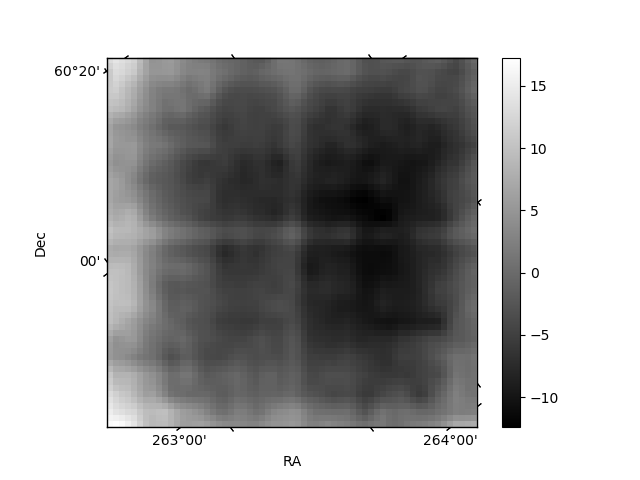
Quadrant B |
|---|---|---|---|
| Quadrant D | 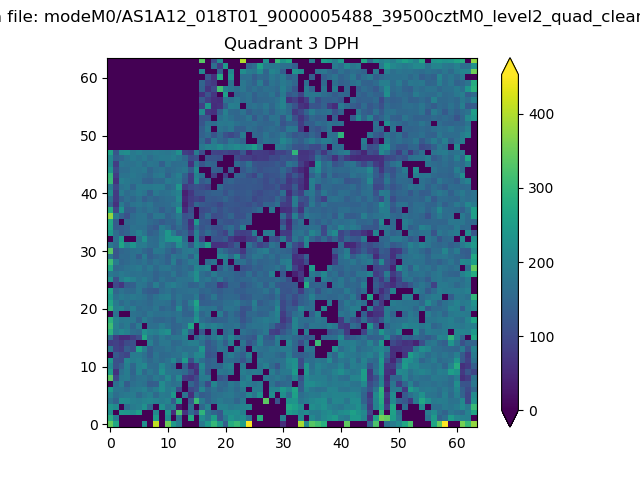 |
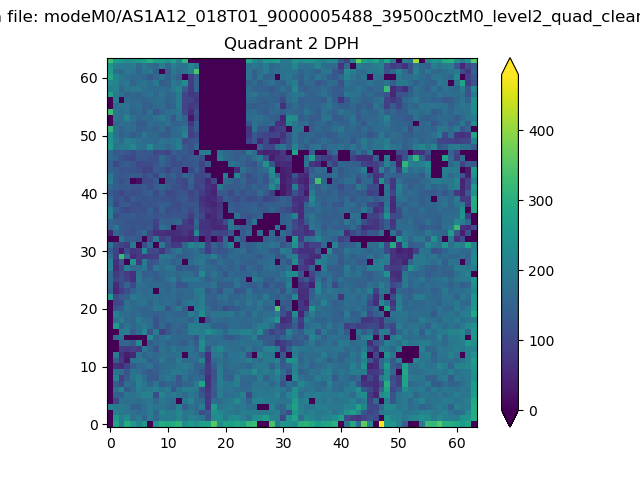 |
Quadrant C |
| Plot type | Count rate plots | Images |
|---|---|---|
| Comparison with Poisson distribution Blue bars denote a histogram of data divided into 1 sec bins. Red curve is a Poisson curve with rate = median count rate of data. |
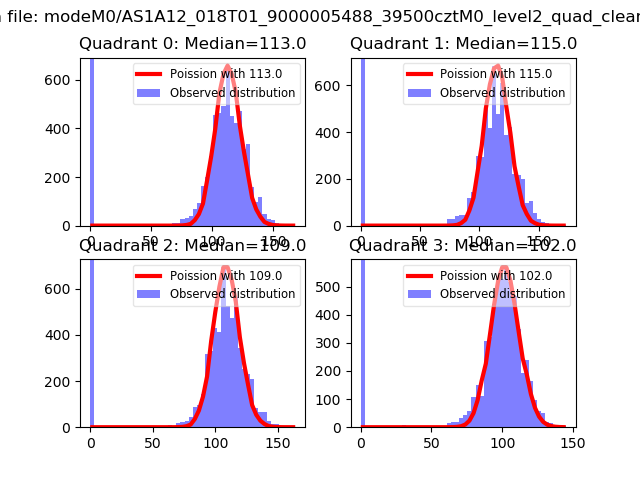 |
 |
| Quadrant-wise count rates Data is divided into 100 sec bins |
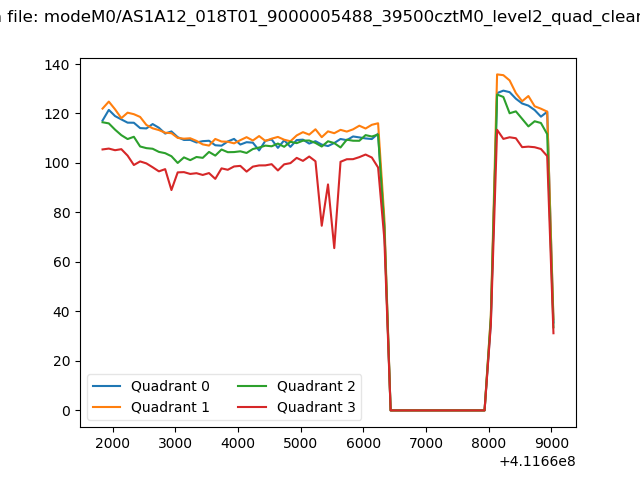 |
|
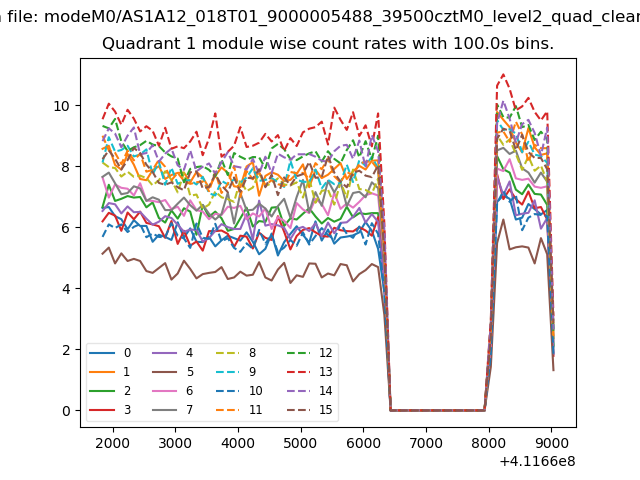
| Module-wise count rates for Quadrant A Data is divided into 100 sec bins |
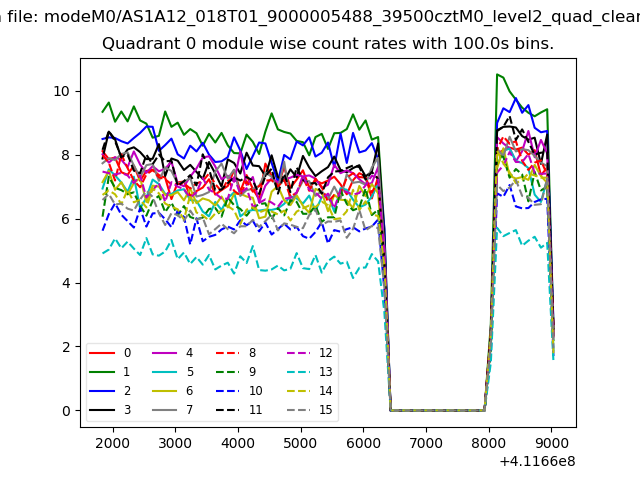 |
 |
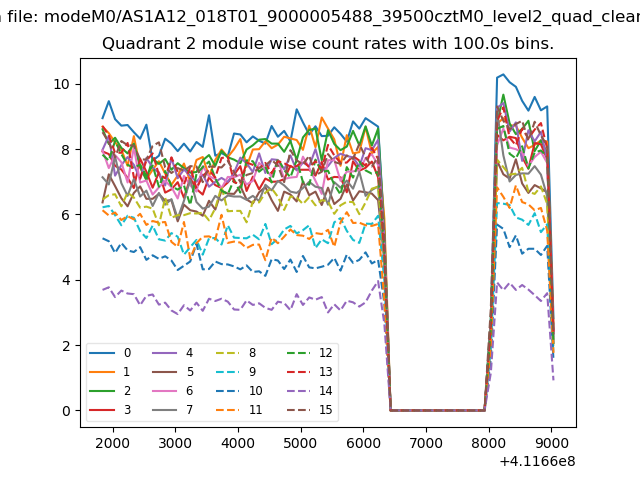
| Module-wise count rates for Quadrant B Data is divided into 100 sec bins |
 |
 |
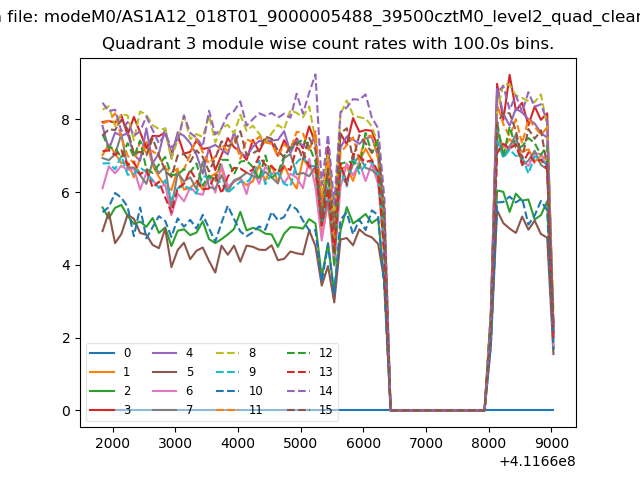
| Module-wise count rates for Quadrant C Data is divided into 100 sec bins |
 |
 |
| Module-wise count rates for Quadrant D Data is divided into 100 sec bins |
 |
 |
| Parameter | Plot |
|---|---|
| CZT HV Monitor | 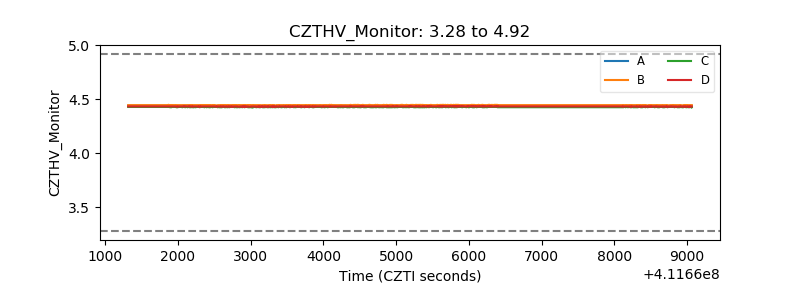 |
| D_VDD | 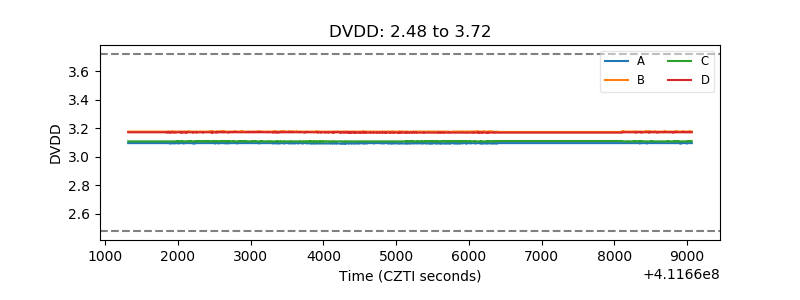 |
| Temperature 1 | 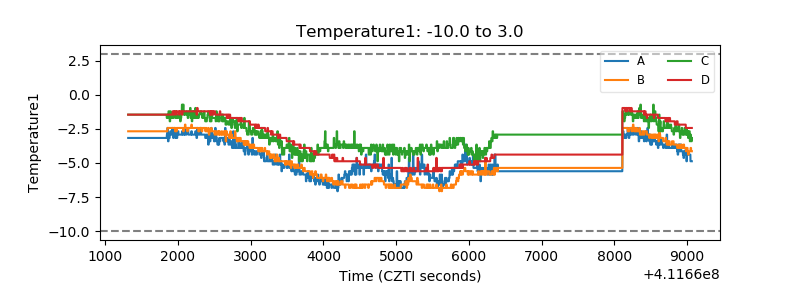 |
| Veto HV Monitor | 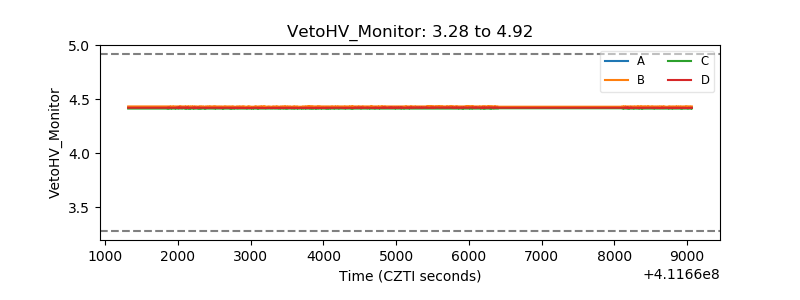 |
| Veto LLD | 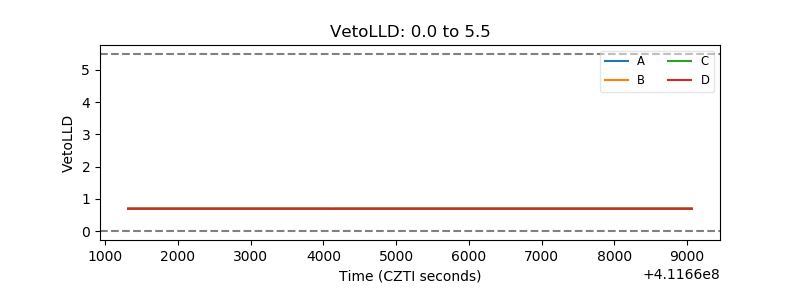 |
| Alpha Counter | 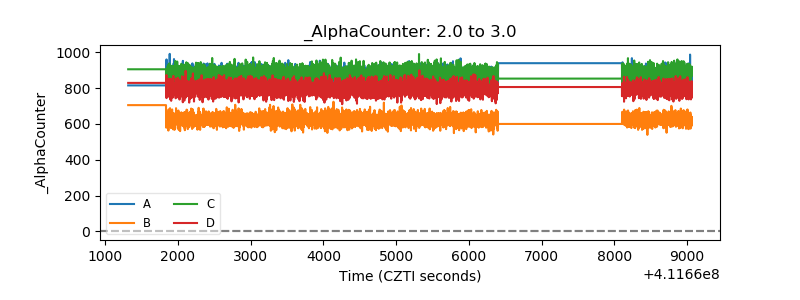 |
| _CPM_Rate | 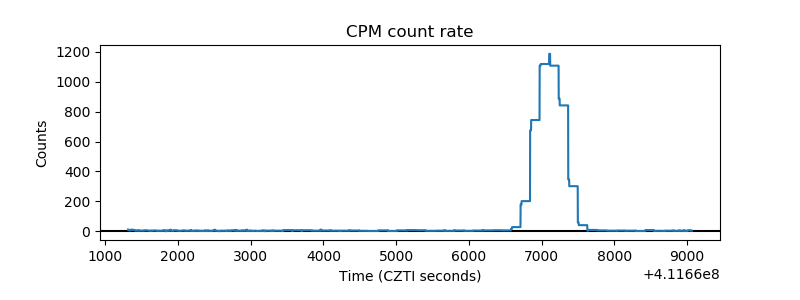 |
| CZT Counter | 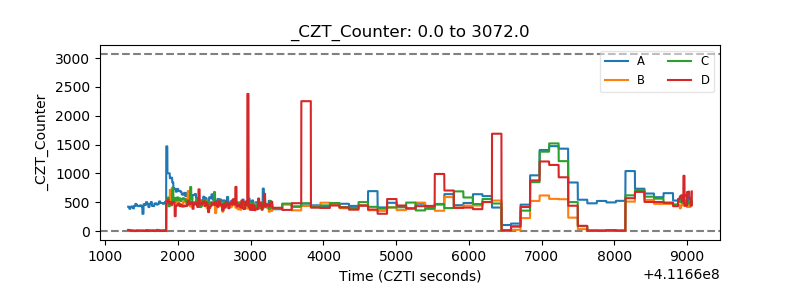 |
| +2.5 Volts monitor | 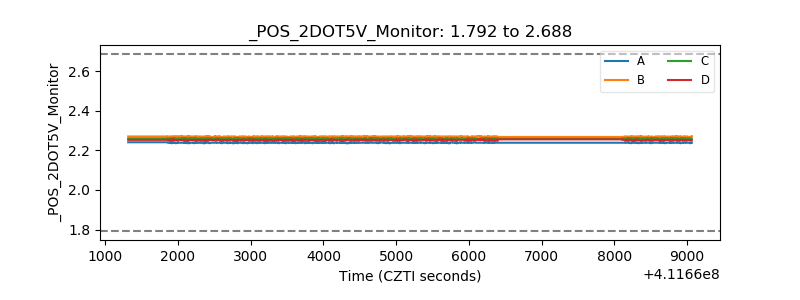 |
| +5 Volts monitor | 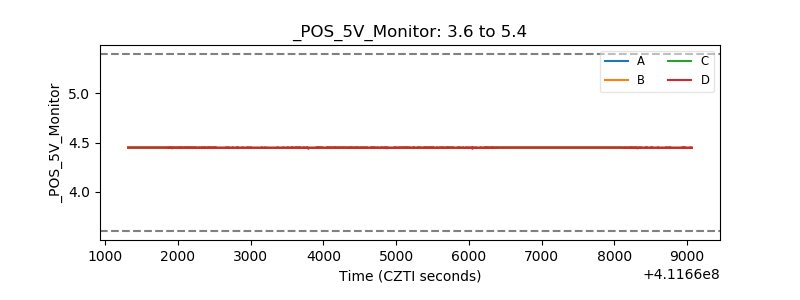 |
| _ROLL_ROT | 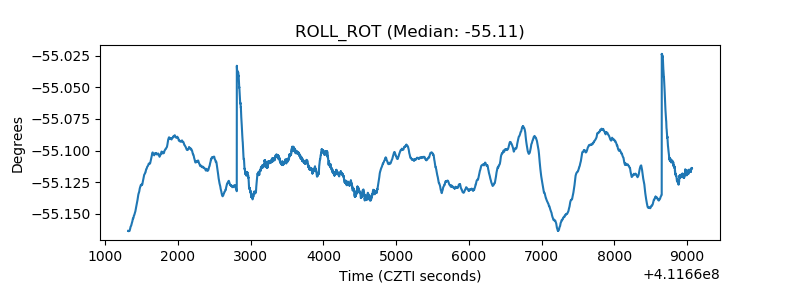 |
| _Roll_DEC | 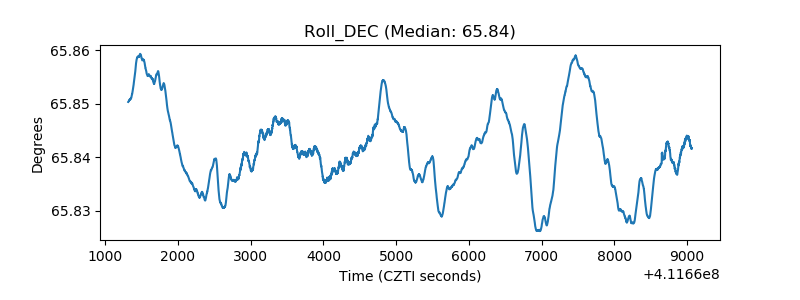 |
| _Roll_RA | 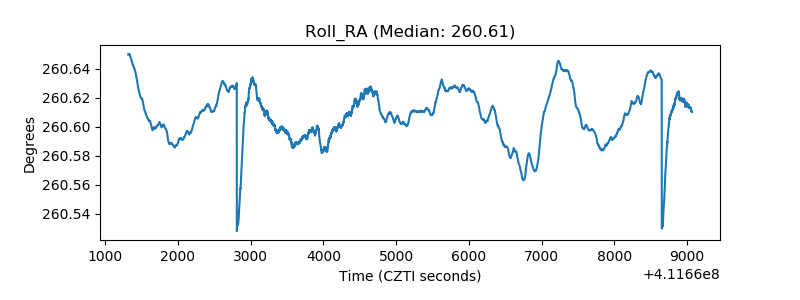 |
| Veto Counter | 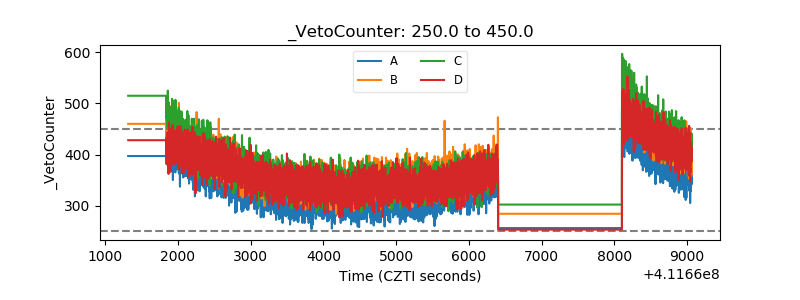 |